. 2021 Aug 18;14(1):410.
doi: 10.1186/s13071-021-04889-x.

Estimating the impact of Tiny Targets in reducing the incidence of Gambian sleeping sickness in the North-west Uganda focus

Affiliations

Estimating the impact of Tiny Targets in reducing the incidence of Gambian sleeping sickness in the North-west Uganda focus

Paul R Bessell et al. Parasit Vectors. .

Abstract

Background: Riverine species of tsetse (Glossina) transmit Trypanosoma brucei gambiense, which causes Gambian human African trypanosomiasis (gHAT), a neglected tropical disease. Uganda aims to eliminate gHAT as a public health problem through detection and treatment of human cases and vector control. The latter is being achieved through the deployment of 'Tiny Targets', insecticide-impregnated panels of material which attract and kill tsetse. We analysed the spatial and temporal distribution of cases of gHAT in Uganda during the period 2010-2019 to assess whether Tiny Targets have had an impact on disease incidence.

Methods: To quantify the deployment of Tiny Targets, we mapped the rivers and their associated watersheds in the intervention area. We then categorised each of these on a scale of 0-3 according to whether Tiny Targets were absent (0), present only in neighbouring watersheds (1), present in the watersheds but not all neighbours (2), or present in the watershed and all neighbours (3). We overlaid all cases that were diagnosed between 2000 and 2020 and assessed whether the probability of finding cases in a watershed changed following the deployment of targets. We also estimated the number of cases averted through tsetse control.

Results: We found that following the deployment of Tiny Targets in a watershed, there were fewer cases of HAT, with a sampled error probability of 0.007. We estimate that during the intervention period 2012-2019 we should have expected 48 cases (95% confidence intervals = 40-57) compared to the 36 cases observed. The results are robust to a range of sensitivity analyses.

Conclusions: Tiny Targets have reduced the incidence of gHAT by 25% in north-western Uganda.

Keywords: Disease control; Elimination; Human African trypanosomiasis; Tiny Targets; Tsetse control; Uganda.


Conflict of interest statement

The authors declare that they have no competing interests.

Figures

Fig. 1
Fig. 1
Map showing the study area (in yellow) and the rivers as extracted by HydroSHEDS created from the NASA SRTM1 DEM using ESRI ArcGIS 10.5
Fig. 2
Fig. 2
Watersheds for the study area in red; each of the polygons represents a single watershed derived from HydroSHEDS created from the NASA SRTM1 DEM using ESRI ArcGIS 10.5
Fig. 3
Fig. 3
Map of watersheds deployed for four key intervention points. The black outlines represent the island watersheds that were filled in
Fig. 4
Fig. 4
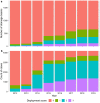
Bar chart of the watershed deployment scores per year for watersheds that are within the deployment districts (a). The total number of cases between 2000 and 2020 (n = 4187), broken down by the deployment zone scores for each year of intervention (b)
Fig. 5
Fig. 5
Bar chart of the mean deployment scores for cases and case–controls against the year in which the cases were assumed to have been infected. The numbers above the case bars represent the number of cases assumed to be infected that year. There were 4186 controls in each year
Fig. 6
Fig. 6
Line chart of the cumulative number of reported cases (black line) and modelled case numbers (blue line). The blue line represents the cumulative number of cases that were modelled without vector control and the red ribbon the 95% confidence around these cases. The black line is the observed number of cases by infection date
Fig. 7
Fig. 7
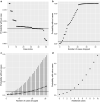
Results of sensitivity analyses. a The remaining probability when one case at a time is dropped out; the cases are ranked and the black line shows that basic P-value. b Starting with the highest ranked case, the resulting P-value when no cases are dropped, the top ranked case, the top two ranked, the nth ranked cases are dropped. c The resulting probability after randomly removing n cases; the points are the mean probability and lines 95% confidence intervals. d The impacts of adding additional cases to the controlled zone (score 3) in 2019

References

    1. Franco JR, Cecchi G, Priotto G, Paone M, Diarra A, Grout L, et al. Monitoring the elimination of human African trypanosomiasis at continental and country level: update to 2018. PLoS Negl Trop Dis. 2020;14:e0008261. doi: 10.1371/journal.pntd.0008261. - DOI - PMC - PubMed
    1. Berrang-Ford L, Odiit M, Maiso F, Waltner-Toews D, McDermott J. Sleeping sickness in Uganda: revisiting current and historical distributions. Afr Health Sci. 2006;6:223–231. - PMC - PubMed
    1. Steverding D. The history of African trypanosomiasis. Parasit Vectors. 2008;1:3. doi: 10.1186/1756-3305-1-3. - DOI - PMC - PubMed
    1. Franco JR, Cecchi G, Priotto G, Paone M, Diarra A, Grout L, et al. Monitoring the elimination of human African trypanosomiasis: update to 2014. PLoS Negl Trop Dis. 2017;11:e0005585. doi: 10.1371/journal.pntd.0005585. - DOI - PMC - PubMed
    1. WHO . Report of a WHO meeting on elimination of African trypanosomiasis (Trypanosoma brucei gambiense) Geneva: WHO; 2010.

LinkOut - more resources