. 2021 Aug 18;7(34):eabi9119.
doi: 10.1126/sciadv.abi9119. Print 2021 Aug.

Microengineered perfusable 3D-bioprinted glioblastoma model for in vivo mimicry of tumor microenvironment

Affiliations

Microengineered perfusable 3D-bioprinted glioblastoma model for in vivo mimicry of tumor microenvironment

Lena Neufeld et al. Sci Adv. .

Abstract

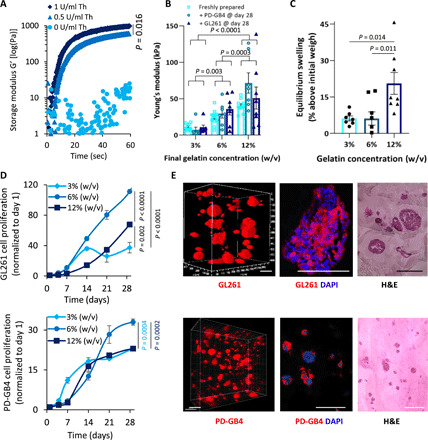
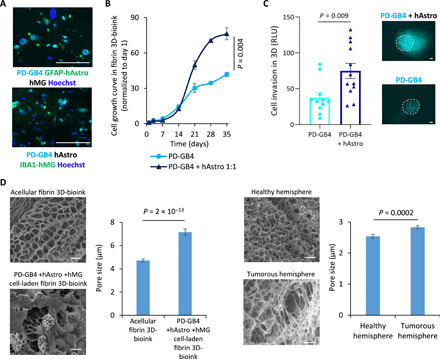
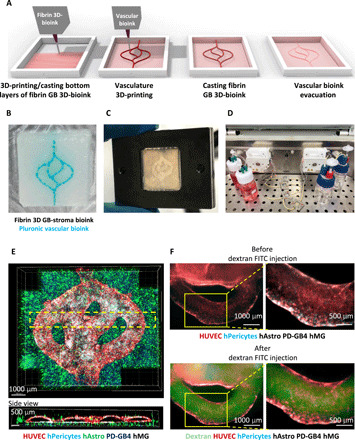
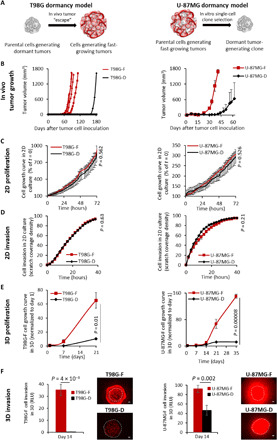
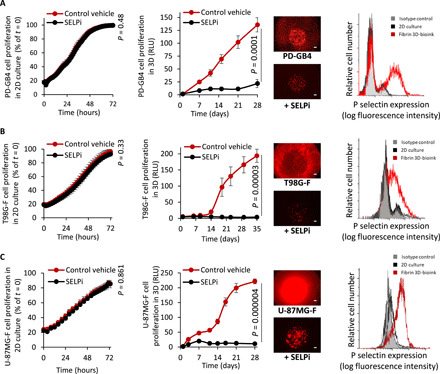
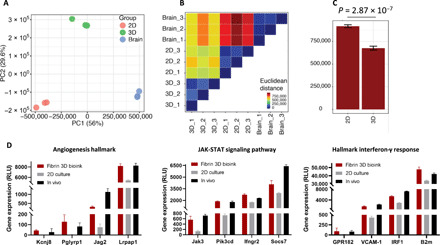
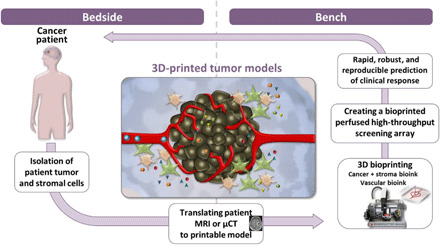
Many drugs show promising results in laboratory research but eventually fail clinical trials. We hypothesize that one main reason for this translational gap is that current cancer models are inadequate. Most models lack the tumor-stroma interactions, which are essential for proper representation of cancer complexed biology. Therefore, we recapitulated the tumor heterogenic microenvironment by creating fibrin glioblastoma bioink consisting of patient-derived glioblastoma cells, astrocytes, and microglia. In addition, perfusable blood vessels were created using a sacrificial bioink coated with brain pericytes and endothelial cells. We observed similar growth curves, drug response, and genetic signature of glioblastoma cells grown in our 3D-bioink platform and in orthotopic cancer mouse models as opposed to 2D culture on rigid plastic plates. Our 3D-bioprinted model could be the basis for potentially replacing cell cultures and animal models as a powerful platform for rapid, reproducible, and robust target discovery; personalized therapy screening; and drug development.


Figures

Fig. 1
Fig. 1. Bio-mechanical characterization determined the bioink composition that best mimics the elasticity and composition of the brain tissue.
(A) G′ of fibrin 3D-bioink formation at different Th concentrations with 3% (w/v) TG at 37°C (average shown of n = 3 per group). (B) Young’s modulus of fibrin 3D-bioink at different concentrations of gelatin [3%, 6%, and 12% (w/v)] with 3% (w/v) TG and Th (0. 5 U/ml) as a clear bioink and as a cell-laden bioink composed of PD-GB4 or GL261 at 1 × 10⁶ cells/ml (n = 8 to 13 per group). (C) Swelling at equilibrium of fibrin 3D-bioink at different concentrations of gelatin [3%, 6%, and 12% (w/v)] with 3% (w/v) TG and Th (0.5 U/ml) (n = 8 per group). (D) Growth curves at different concentrations of gelatin [3%, 6%, and 12% (w/v)] with 3% (w/v) TG and 0. 5 U/ml of Th of GL261 [top: 3% (w/v) versus 6% (w/v), P < 0.00001; 6% (w/v) versus 12% (w/v), P < 0.00001; 3% (w/v) versus 12% (w/v), P = 0.002 by t test] and PD-GB4 [bottom: 3% (w/v) versus 6% (w/v), P = 0.0004; 6% (w/v) versus 12% (w/v), P = 0.0004, by t test] in fibrin 3D-bioink (n = 4 per group). (E) Representative images demonstrating the morphology of mCherry-labeled GL261 (top) and iRFP-labeled PD-GB4 cells (bottom) following 14 days in fibrin 3D-bioink [6% (w/v) gelatin, 3% (w/v) TG, and Th (0.5 U/ml)]. Cells were analyzed by live confocal Z-stack imaging of the whole bioink and by fluorescence imaging and H&E staining of bioink sections (n = 3 to 4 per group). Scale bars, 100 μm.
Fig. 2
Fig. 2. 3D brain-mimicking bioink is biocompatible and promotes long-term cell viability of GB cells and brain stromal cells.
(A) Representative immunostaining images of GFAP (top, in green) or IBA1 (bottom, in green) in fibrin 3D-bioink seeded with GB and stromal cells cocultured for 7 days. Images depict Hoechst-stained nucleus (in blue), iRFP-labeled PD-GB cells (PD-GB4; in cyan). Scale bars, 100 μm. (B) Growth curves of PD-GB cells (PD-GB4), alone or cocultured with hAstro (1:1 ratio) in fibrin 3D-bioink (P = 0.004, t test; n = 4 per group). (C) The invasion of iRFP-labeled PD-GB4 cells from the inner core to the surrounding area in the absence or presence of hAstro (1 × 10⁶ cells/ml) was evaluated by fluorescent microscopy imaging. The invasion was calculated as the total area density in outer bioink and quantified using ImageJ by RLU (P = 0.004, t test; n = 12 per group). Representative images of cell invasion are shown; dashed lines delineate the edge between the core and the surrounding tissue according to the images on day 1. Scale bars, 100 μm. (D) SEM images of acellular fibrin 3D-bioink (top left); cell-laden fibrin 3D-bioink composed of patient-derived PD-GB4 cells, hAstro, and hMG cells (bottom left); healthy hemisphere of a C57BL/6 mouse (top right); and GL261 tumor-containing hemisphere of the same mouse (bottom right). Scale bars, 10 μm. The pore size diameter of each group was quantified using ImageJ (n = 2 to 20 photos per group, n = 13 to 170 measurements in each photo) and showed that enlarged and diverse pore sizes characterized the cell-laden bioink and brain tissue bearing the GB tumor.
Fig. 3
Fig. 3. Fibrin brain-mimicking 3D-bioink integrated with 3D engineered printed perfusable vascular network.
(A) Schematic illustration of the 3D-bioprinting model multistage process. (B) 3D-printed Pluronic-based vascular bioink (in cyan) on top of 3D-printed layers of fibrin 3D GB-stroma bioink (in white). (C) 3D-bioprinted vascularized GB model sealed in a metal frame showing the complete perfusion chip. (D) The vascularized 3D-bioprinted GB model is connected to a peristaltic pump through a tubing system, placed in a designated incubator. (E) Tiled Z-stack confocal microscopy images of the 3D-printed penta-culture vascularized GB model. Blood vessels are lined with iRFP-labeled hPericytes (in cyan) together with mCherry-labeled HUVEC (in red) (107 cells/ml; 4:1 ratio) and surrounded by azurite-labeled PD-GB4 (in blue), GFP-labeled hAstro (in green), and nonlabeled hMG (2.1 × 10⁶ cells/ml; 1:1:0.1 ratio). The dashed box represents a coronal cross-sectional plane of the vessel. (F) Fluorescence microscopy images of the 3D-bioprinted vascularized GB model before (top) and after (bottom) perfusion of 70-kDa dextran-FITC. The 3D-bioprinted model is composed of a fluorescently labeled vascular network (mCherry-labeled HUVEC and iRFP-labeled hPericytes) surrounded by nonlabeled GB-bioink (hAstro, PD-GB4, and hMG).
Fig. 4
Fig. 4. Fibrin 3D-bioink reproduced the dormancy phenomenon of two GB human cell types, which thus far could only be observed in SCID mice and not in 2D culture.
(A) Schematic illustration of T98-G and U-87MG human dormancy models. (B) In vivo growth kinetics of dormant (T98G-D and U-87MG-D) and fast-growing (T98G-F and U-87MG-F) cell types. n = 4 in the T98G-F group and n = 3 in the T98G-D group. Values for U-87MG growth in mice were averaged from data previously presented (29). (C) Cell growth evaluation of both GB pairs in 2D culture. n = 3 per group. (D) Cell invasion evaluation of both GB pairs in 2D culture. n = 3 per group. (E) Growth kinetics of both dormant and fast-growing cell types were evaluated in fibrin 3D-bioink. n = 4 per group. (F) Cell invasion ability in fibrin 3D-bioink was quantified using ImageJ. n = 12 per group. Representative fluorescent images of the invasion from the core tumor model to the surrounding area are presented. Scale bars, 100 μm. Dashed lines delineate the edge between the core and the surrounding tissue according to the images on day 1.
Fig. 5
Fig. 5. Treatment with SELPi resulted in a substantial reduction in GB cell proliferation in fibrin 3D-bioink compared to 2D culture.
(A to C) Response of PD-GB4 (A), T98G-F (B), and U-87MG-F (C) to treatment with SELPi in 2D culture (left, n = 3 per group) and in 3D-bioink (center, n = 8/12 per group), representative images of labeled cells at the end of evaluation. Scale bars, 100 μm. Flow cytometry analysis of P-selectin expression of cells grown in 2D culture and in fibrin 3D-bioink (right, n = 3 per group).
Fig. 6
Fig. 6. RNA-seq analysis shows higher similarities between the gene expression of GL261 grown in fibrin 3D-bioink and GL261 cells grown in mice compared to those grown in 2D culture.
(A) PCA analysis showing gene expression profile derived from 2D culture, 3D-bioink, and GB tumors in mice in vivo (n = 3 per group). (B) Euclidian distance matrix between samples showing a closer distance between the in vivo samples and the fibrin 3D-bioink compared to increased distance between the in vivo samples and the 2D culture. (C) Summary comparison between the Euclidian distance of the 3D-bioink and the 2D culture to the in vivo samples (P = 2.8 × 10⁷, t test). (D) A comparison of gene expression levels of enriched pathways, displaying similarly high levels of expression both in fibrin 3D-bioink and in vivo.
Fig. 7
Fig. 7. Bridging the translational gap from bedside to bench and back.
Schematic illustration of the methodological approach using a perfusable microengineered vascular 3D-bioprinted tumor model for drug screening and target discovery. MRI, magnetic resonance imaging; μ-CT, micro–computed tomography.

References

    1. World Health Organization. Cancer. March 3, 2021. www.who.int/news-room/fact-sheets/detail/cancer (2018).
    1. Jakka S., Rossbach M., An economic perspective on personalized medicine. HUGO J. 7, 1 (2013).
    1. Ben-David U., Siranosian B., Ha G., Tang H., Oren Y., Hinohara K., Strathdee C. A., Dempster J., Lyons N. J., Burns R., Nag A., Kugener G., Cimini B., Tsvetkov P., Maruvka Y. E., O’Rourke R., Garrity A., Tubelli A. A., Bandopadhayay P., Tsherniak A., Vazquez F., Wong B., Birger C., Ghandi M., Thorner A. R., Bittker J. A., Meyerson M., Getz G., Beroukhim R., Golub T. R., Genetic and transcriptional evolution alters cancer cell line drug response. Nature 560, 325–330 (2018). - PMC - PubMed
    1. DiMasi J. A., Grabowski H. G., Hansen R. W., Innovation in the pharmaceutical industry: New estimates of R&D costs. J. Health Econ. 47, 20–33 (2016). - PubMed
    1. Clinical Development Success Rates and Contributing Factors 2011–2020 (BIO, QLS Advisors, Informa UK Ltd, 2021).

Publication types