Clinical Trial
. 2021 Nov 1;27(21):5961-5978.
doi: 10.1158/1078-0432.CCR-21-0986. Epub 2021 Aug 18.

Upregulation of C/EBPα Inhibits Suppressive Activity of Myeloid Cells and Potentiates Antitumor Response in Mice and Patients with Cancer

Affiliations
Clinical Trial

Upregulation of C/EBPα Inhibits Suppressive Activity of Myeloid Cells and Potentiates Antitumor Response in Mice and Patients with Cancer

Ayumi Hashimoto et al. Clin Cancer Res. .

Abstract

Purpose: To evaluate the mechanisms of how therapeutic upregulation of the transcription factor, CCAAT/enhancer-binding protein alpha (C/EBPα), prevents tumor progression in patients with advanced hepatocellular carcinoma (HCC) and in different mouse tumor models.

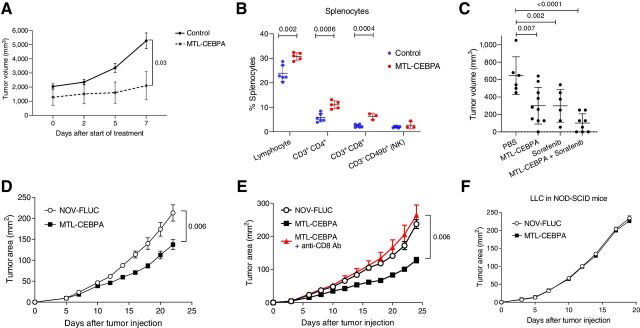
Experimental design: We conducted a phase I trial in 36 patients with HCC (NCT02716012) who received sorafenib as part of their standard care, and were given therapeutic C/EBPα small activating RNA (saRNA; MTL-CEBPA) as either neoadjuvant or adjuvant treatment. In the preclinical setting, the effects of MTL-CEBPA were assessed in several mouse models, including BNL-1ME liver cancer, Lewis lung carcinoma (LLC), and colon adenocarcinoma (MC38).

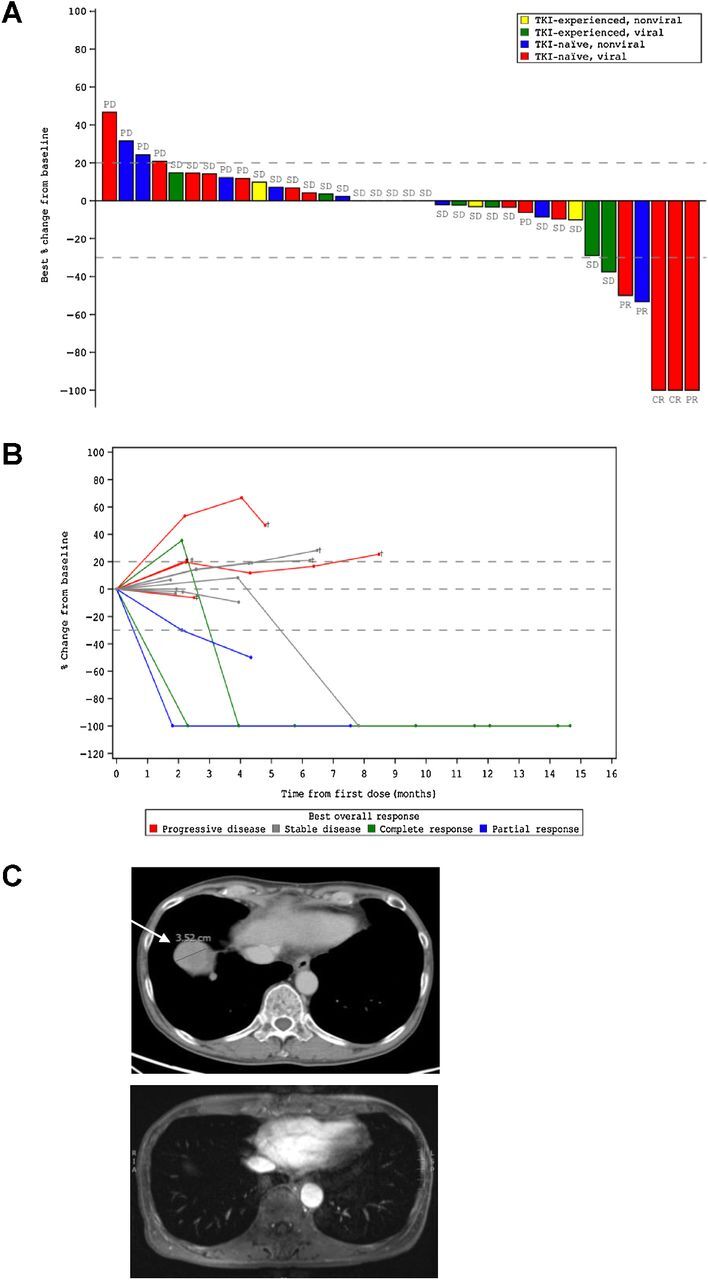
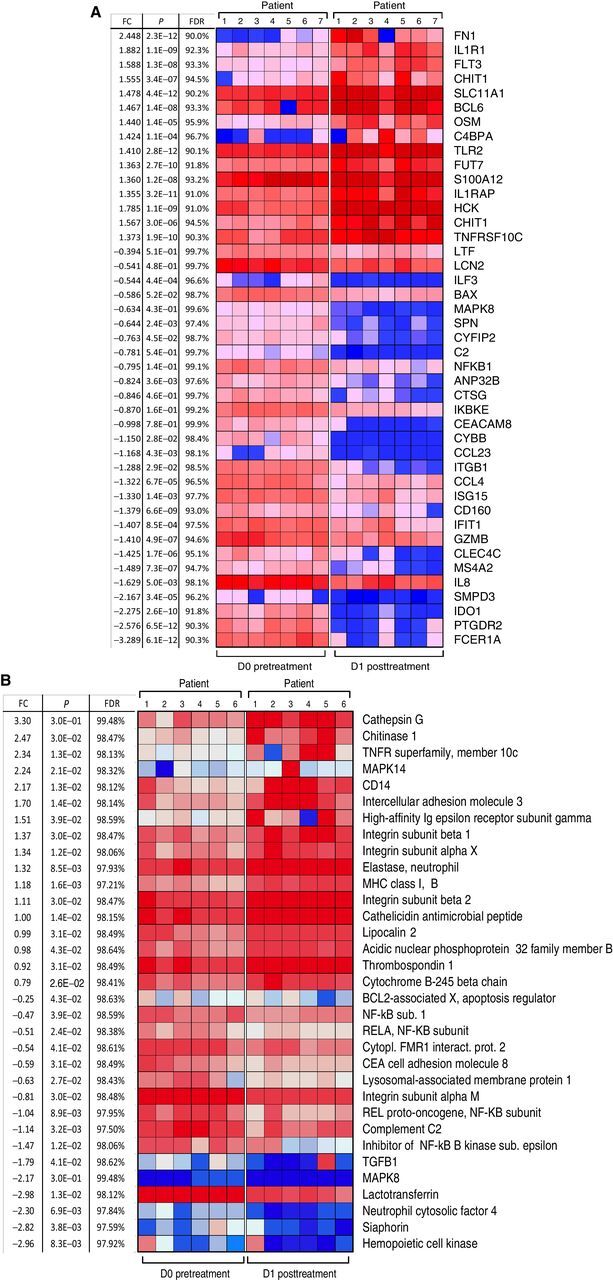
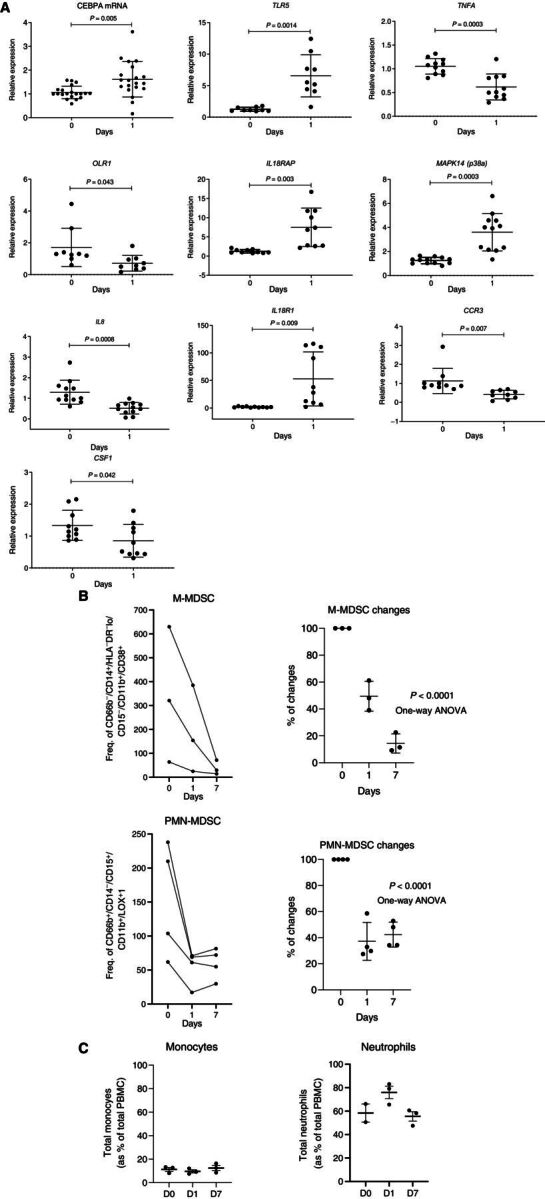
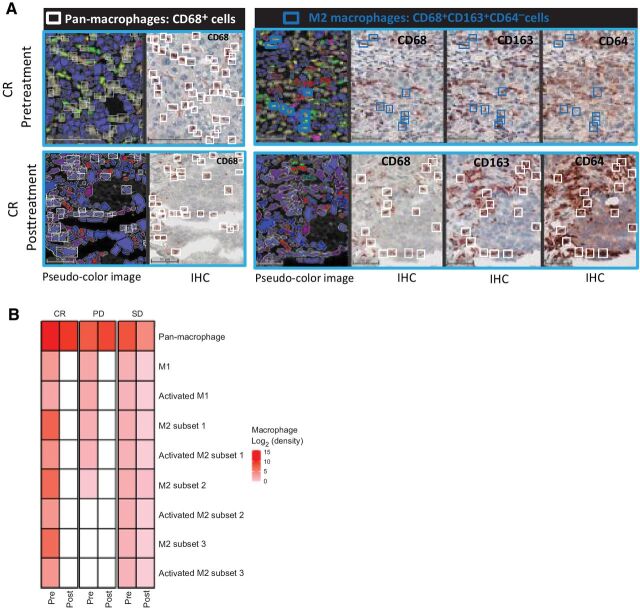
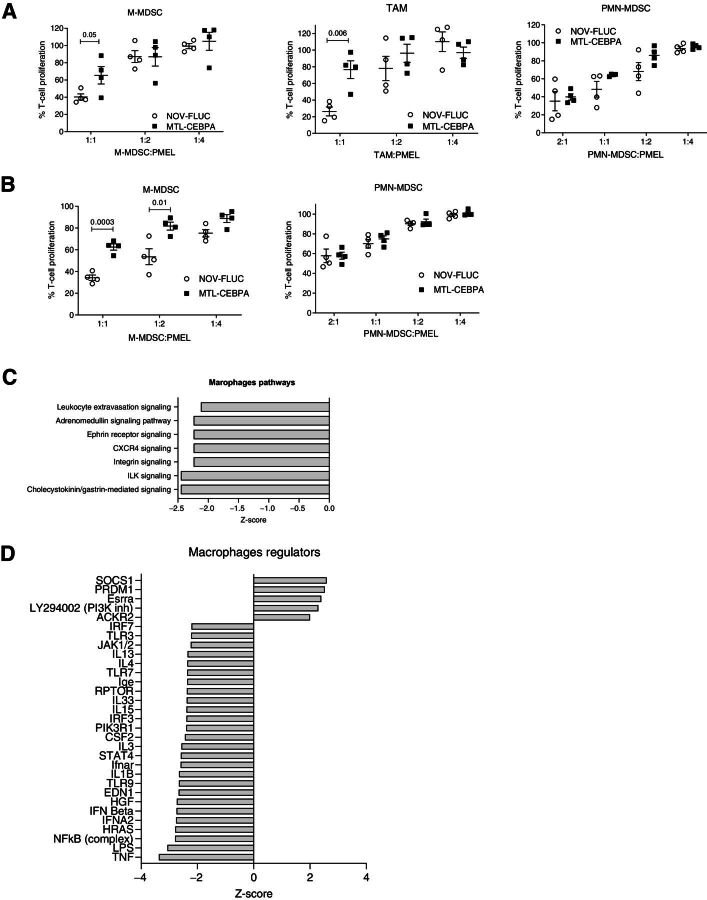
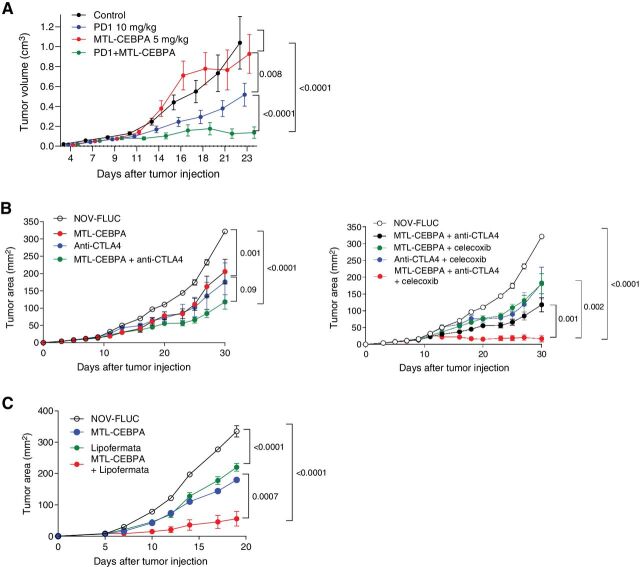
Results: MTL-CEBPA treatment caused radiologic regression of tumors in 26.7% of HCC patients with an underlying viral etiology with 3 complete responders. MTL-CEBPA treatment in those patients caused a marked decrease in peripheral blood monocytic myeloid-derived suppressor cell (M-MDSC) numbers and an overall reduction in the numbers of protumoral M2 tumor-associated macrophages (TAM). Gene and protein analysis of patient leukocytes following treatment showed CEBPA activation affected regulation of factors involved in immune-suppressive activity. To corroborate this observation, treatment of all the mouse tumor models with MTL-CEBPA led to a reversal in the suppressive activity of M-MDSCs and TAMs, but not polymorphonuclear MDSCs (PMN-MDSC). The antitumor effects of MTL-CEBPA in these tumor models showed dependency on T cells. This was accentuated when MTL-CEBPA was combined with checkpoint inhibitors or with PMN-MDSC-targeted immunotherapy.

Conclusions: This report demonstrates that therapeutic upregulation of the transcription factor C/EBPα causes inactivation of immune-suppressive myeloid cells with potent antitumor responses across different tumor models and in cancer patients. MTL-CEBPA is currently being investigated in combination with pembrolizumab in a phase I/Ib multicenter clinical study (NCT04105335).


Figures

Figure 1. Clinical activity of MTL-CEBPA in advanced HCC patients treated in combination with sorafenib. A, Waterfall plot of patients in phase Ib study showing best percentage (%) change from baseline, with identification of groups that had previously been treated with TKI and those that had HCC of viral etiology. B, Durable responses of patients previously naïve to TKI with HCC of viral etiology. Spider plot in phase Ib patients who had not previously been treated with TKI and had HCC of viral etiology, showing tumor response for target lesions. C, Complete radiologic response of lung metastases following treatment with MTL-CEBPA and sorafenib. Cross-sectional imaging of a patient with baseline imaging on top from June 12, 2018, showing right lung metastases and on bottom from December 31, 2018, showing complete resolution of lung metastases. This patient maintains a complete radiologic response to both liver and lung metastases on last surveillance imaging on March 13, 2020.
Figure 1.
Clinical activity of MTL-CEBPA in advanced HCC patients treated in combination with sorafenib. A, Waterfall plot of patients in phase Ib study showing best percentage (%) change from baseline, with identification of groups that had previously been treated with TKI and those that had HCC of viral etiology. B, Durable responses of patients previously naïve to TKI with HCC of viral etiology. Spider plot in phase Ib patients who had not previously been treated with TKI and had HCC of viral etiology, showing tumor response for target lesions. C, Complete radiologic response of lung metastases following treatment with MTL-CEBPA and sorafenib. Cross-sectional imaging of a patient with baseline imaging on top from June 12, 2018, showing right lung metastases and on bottom from December 31, 2018, showing complete resolution of lung metastases. This patient maintains a complete radiologic response to both liver and lung metastases on last surveillance imaging on March 13, 2020.
Figure 2. Effect of MTL-CEBPA treatment of patients with HCC on gene and protein expression in myeloid cells. A, Gene-expression profile was evaluated by NanoString using the human PanCaner IO 360 panel. Heat map of gene-expression upregulated (+1> log2 fold change and above) or downregulated (−1< log2 fold change and below) with a false discovery rate (FDR) of <5% is shown. B, Protein expression profile was evaluated by mass spectroscopy. Proteins with P < 0.05 and absolute log2 fold change > 1 were considered as significantly differentially expressed. Adjusted P values were calculated by correcting for an FDR of <5%.
Figure 2.
Effect of MTL-CEBPA treatment of patients with HCC on gene and protein expression in myeloid cells. A, Gene-expression profile was evaluated by NanoString using the human PanCaner IO 360 panel. Heat map of gene-expression upregulated (+1> log2 fold change and above) or downregulated (−1< log2 fold change and below) with a false discovery rate (FDR) of <5% is shown. B, Protein expression profile was evaluated by mass spectroscopy. Proteins with P < 0.05 and absolute log2 fold change > 1 were considered as significantly differentially expressed. Adjusted P values were calculated by correcting for an FDR of <5%.
Figure 3. Changes in gene expression in total leukocytes in patients treated with MTL-CEBPA. A, Expression of indicated genes in leukocytes from 12 patients. Gene expression was evaluated by qRT-PCR. Individual results, mean, and standard deviation are shown. P values are calculated using two-sided Student t test. B, the presence of M-MDSCs (CD66b− CD14+ HLA-DR−/loCD15− CD11b+CD38+) and PMN-MDSCs (CD66b+CD14−CD15+CD11b+ LOX1+) among mononuclear cells was analyzed by flow cytometry and represented as frequency of gated cell population at 60K event per 1 × 10⁶ cells (n = 3). C, Total circulating population of monocytes and neutrophils in the same patients was measured as a percentage of total PBMC.
Figure 3.
Changes in gene expression in total leukocytes in patients treated with MTL-CEBPA. A, Expression of indicated genes in leukocytes from 12 patients. Gene expression was evaluated by qRT-PCR. Individual results, mean, and standard deviation are shown. P values are calculated using two-sided Student t test. B, the presence of M-MDSCs (CD66b CD14+ HLA-DR−/loCD15 CD11b+CD38+) and PMN-MDSCs (CD66b+CD14CD15+CD11b+ LOX1+) among mononuclear cells was analyzed by flow cytometry and represented as frequency of gated cell population at 60K event per 1 × 10⁶ cells (n = 3). C, Total circulating population of monocytes and neutrophils in the same patients was measured as a percentage of total PBMC.
Figure 4. The effects of MTL-CEBPA treatment on TAMs in patients with HCC. A, Representative images of a CR patient's biopsies with a complete loss of protumoral M2 macrophages (blue squares: CD68+ CD163+ CD64− cells) are shown in bottom (CR posttreatment) panel when compared with top (CR pretreatment) panel. White squares represent the pan-macrophage population expressing CD68+. Pseudo-color image: created by virtual slides alignment and imported in Halo software for biomarker analysis. B, A heat map of macrophage subsets was set up based on log2 fold change between pre- and posttreatment (cell densities) samples of 3 HCC patients including the CR as shown in A, stable disease (SD), and progressive disease (PD). The macrophage populations analyzed were: pan-macrophage (CD68+ cells), antitumoral M1 macrophages (CD68+CD64+CD163−CD206− cells), activated M1 macrophages (CD68+CD64+CD163−CD206− cells), protumoral M2 macrophages subset 1 (CD68+CD163+CD64− cells), protumoral M2 macrophages subset 2 (CD68+CD206+CD64− cells), protumoral M2 macrophages subset 3 (CD68+CD163+CD206+CD64− cells), and activated M2 subsets characterized by IL10 production.
Figure 4.
The effects of MTL-CEBPA treatment on TAMs in patients with HCC. A, Representative images of a CR patient's biopsies with a complete loss of protumoral M2 macrophages (blue squares: CD68+ CD163+ CD64 cells) are shown in bottom (CR posttreatment) panel when compared with top (CR pretreatment) panel. White squares represent the pan-macrophage population expressing CD68+. Pseudo-color image: created by virtual slides alignment and imported in Halo software for biomarker analysis. B, A heat map of macrophage subsets was set up based on log2 fold change between pre- and posttreatment (cell densities) samples of 3 HCC patients including the CR as shown in A, stable disease (SD), and progressive disease (PD). The macrophage populations analyzed were: pan-macrophage (CD68+ cells), antitumoral M1 macrophages (CD68+CD64+CD163CD206 cells), activated M1 macrophages (CD68+CD64+CD163CD206 cells), protumoral M2 macrophages subset 1 (CD68+CD163+CD64 cells), protumoral M2 macrophages subset 2 (CD68+CD206+CD64 cells), protumoral M2 macrophages subset 3 (CD68+CD163+CD206+CD64 cells), and activated M2 subsets characterized by IL10 production.
Figure 5. The effect of MTL-CEBPA on tumor growth in mouse tumor models. MTL-CEBPA and control NOV-FLUC were intravenously injected to the tumor-bearing mice at 3 mg/kg twice a week from day 5. A, Kinetic of tumor growth in mice bearing BNL HCC cell line (n = 5). P value was calculated using two-way ANOVA test. B, The presence of the indicated cell population in spleens of NBL tumor–bearing mice presented as percentages (%). C, Tumor volume in NBL tumor–bearing mice treated with MTL-CEBPA and sorafenib after 10 days of treatment. Mean and standard deviation are shown. n = 6 for PBS control- and sorafenib-treated groups, n = 10 for the MTL-CEBPA–treated group, n = 8 for the combination group. P values were calculated in one-way ANOVA test with corrections for multiple comparisons. D, Kinetics of LLC tumor growth (n = 5 per group). P value was calculated using two-way ANOVA test. E, Kinetics of LLC tumor growth in the mice depleted of CD8 T cells and treated with MTL-CEBPA (n = 5 per group). Mean and standard deviation are shown. P values were calculated using two-way ANOVA. F, Kinetics of tumor growth in NOD-SCID mice (n = 4 and 5 per group).
Figure 5.
The effect of MTL-CEBPA on tumor growth in mouse tumor models. MTL-CEBPA and control NOV-FLUC were intravenously injected to the tumor-bearing mice at 3 mg/kg twice a week from day 5. A, Kinetic of tumor growth in mice bearing BNL HCC cell line (n = 5). P value was calculated using two-way ANOVA test. B, The presence of the indicated cell population in spleens of NBL tumor–bearing mice presented as percentages (%). C, Tumor volume in NBL tumor–bearing mice treated with MTL-CEBPA and sorafenib after 10 days of treatment. Mean and standard deviation are shown. n = 6 for PBS control- and sorafenib-treated groups, n = 10 for the MTL-CEBPA–treated group, n = 8 for the combination group. P values were calculated in one-way ANOVA test with corrections for multiple comparisons. D, Kinetics of LLC tumor growth (n = 5 per group). P value was calculated using two-way ANOVA test. E, Kinetics of LLC tumor growth in the mice depleted of CD8 T cells and treated with MTL-CEBPA (n = 5 per group). Mean and standard deviation are shown. P values were calculated using two-way ANOVA. F, Kinetics of tumor growth in NOD-SCID mice (n = 4 and 5 per group).
Figure 6. Effect of MTL-CEBPA treatment on immune-suppressive function of myeloid cells. A, Suppression of T-cell proliferation by M-MDSCs, macrophages, and PMN-MDSCs isolated from the tumors of the LLC tumor–bearing mice treated with NOV-FLUC or MTL-CEBPA for 2 weeks (n = 4). Mean and standard deviation are shown. P values were calculated using two-sided Student t test. B, Suppression of T-cell proliferation by M-MDSCs and PMN-MDSCs isolated from the spleens of the LLC tumor–bearing mice treated with NOV-FLUC or MTL-CEBPA for 2 weeks (n = 4). Mean and standard deviation are shown. P values were calculated using a two-sided Student t test. C and D, TAMs and PMN-MDSCs were isolated from the tumors of LLC tumor–bearing mice treated with NOV-FLUC or MTL-CEBPA for 2 weeks and used for RNA-seq analysis. C, Pathways predicted to be inhibited (z-score < −2) in TAMs in MTL-CEBPA as compared with NOV-FLUC–treated groups. D, Regulators predicted to be activated (z-score > 2) or inhibited (z-score < −2) in TAMs in MTL-CEBPA as compared with NOV-FLUC–treated group.
Figure 6.
Effect of MTL-CEBPA treatment on immune-suppressive function of myeloid cells. A, Suppression of T-cell proliferation by M-MDSCs, macrophages, and PMN-MDSCs isolated from the tumors of the LLC tumor–bearing mice treated with NOV-FLUC or MTL-CEBPA for 2 weeks (n = 4). Mean and standard deviation are shown. P values were calculated using two-sided Student t test. B, Suppression of T-cell proliferation by M-MDSCs and PMN-MDSCs isolated from the spleens of the LLC tumor–bearing mice treated with NOV-FLUC or MTL-CEBPA for 2 weeks (n = 4). Mean and standard deviation are shown. P values were calculated using a two-sided Student t test. C and D, TAMs and PMN-MDSCs were isolated from the tumors of LLC tumor–bearing mice treated with NOV-FLUC or MTL-CEBPA for 2 weeks and used for RNA-seq analysis. C, Pathways predicted to be inhibited (z-score < −2) in TAMs in MTL-CEBPA as compared with NOV-FLUC–treated groups. D, Regulators predicted to be activated (z-score > 2) or inhibited (z-score < −2) in TAMs in MTL-CEBPA as compared with NOV-FLUC–treated group.
Figure 7. Therapeutic activity of MTL-CEBPA in combination with checkpoint inhibitors. A, MC38 tumor–bearing mice were treated with MTL-CEBPA or NOV-FLUC control at 5 mg/kg from day 4 (twice a week). Anti–PD-1 antibody was intraperitoneally injected to the mice twice a week at 10 mg/kg. n = 5 per group. Mean and SEM are shown. P values were calculated using two-way ANOVA test. B, LLC tumor–bearing mice were treated with MTL-CEBPA or NOV-FLUC control at 3 mg/kg from day 3 (twice a week). Anti–CTLA-4 antibody was intraperitoneally injected to the mice on days 10, 17, and 24 (100 μg/mouse). Celecoxib was orally given to the mice at 50 mg/kg from day 3 (daily). Mean and SEM (n = 4) are shown. P values were calculated using two-way ANOVA test. C, LLC tumor–bearing mice were treated with MTL-CEBPA or NOV-FLUC (3 mg/kg from day 3, twice a week) in combination with lipofermata (2 mg/kg, twice per day from day 3, subcutaneously). In each experiment, P values were calculated in two-way ANOVA.
Figure 7.
Therapeutic activity of MTL-CEBPA in combination with checkpoint inhibitors. A, MC38 tumor–bearing mice were treated with MTL-CEBPA or NOV-FLUC control at 5 mg/kg from day 4 (twice a week). Anti–PD-1 antibody was intraperitoneally injected to the mice twice a week at 10 mg/kg. n = 5 per group. Mean and SEM are shown. P values were calculated using two-way ANOVA test. B, LLC tumor–bearing mice were treated with MTL-CEBPA or NOV-FLUC control at 3 mg/kg from day 3 (twice a week). Anti–CTLA-4 antibody was intraperitoneally injected to the mice on days 10, 17, and 24 (100 μg/mouse). Celecoxib was orally given to the mice at 50 mg/kg from day 3 (daily). Mean and SEM (n = 4) are shown. P values were calculated using two-way ANOVA test. C, LLC tumor–bearing mice were treated with MTL-CEBPA or NOV-FLUC (3 mg/kg from day 3, twice a week) in combination with lipofermata (2 mg/kg, twice per day from day 3, subcutaneously). In each experiment, P values were calculated in two-way ANOVA.

References

    1. Binnewies M, Roberts EW, Kersten K, Chan V, Fearon DF, Merad M, et al. Understanding the tumor immune microenvironment (TIME) for effective therapy. Nat Med 2018;24:541–50. - PMC - PubMed
    1. Veglia F, Perego M, Gabrilovich D. Myeloid-derived suppressor cells coming of age. Nat Immunol 2018;19:108–19. - PMC - PubMed
    1. Newman JR, Keating AE. Comprehensive identification of human bZIP interactions with coiled-coil arrays. Science 2003;300:2097–101. - PubMed
    1. Avellino R, Delwel R. Expression and regulation of C/EBPalpha in normal myelopoiesis and in malignant transformation. Blood 2017;129:2083–91. - PubMed
    1. Lourenco AR, Coffer PJ. A tumor suppressor role for C/EBPalpha in solid tumors: more than fat and blood. Oncogene 2017;36:5221–30. - PubMed

Publication types

Associated data