Clinical Trial
. 2021 Nov 1;27(21):6001-6011.
doi: 10.1158/1078-0432.CCR-21-1819. Epub 2021 Aug 18.

Circulating and Intratumoral Adrenal Androgens Correlate with Response to Abiraterone in Men with Castration-Resistant Prostate Cancer

Affiliations
Clinical Trial

Circulating and Intratumoral Adrenal Androgens Correlate with Response to Abiraterone in Men with Castration-Resistant Prostate Cancer

Elahe A Mostaghel et al. Clin Cancer Res. .

Abstract

Purpose: In metastatic castration-resistant prostate cancer (mCRPC) low serum androgens prior to starting abiraterone acetate (AA) is associated with more rapid progression. We evaluated the effect of AA on androgens in castration-resistant prostate cancer (CRPC) metastases and associations of intratumoral androgens with response.

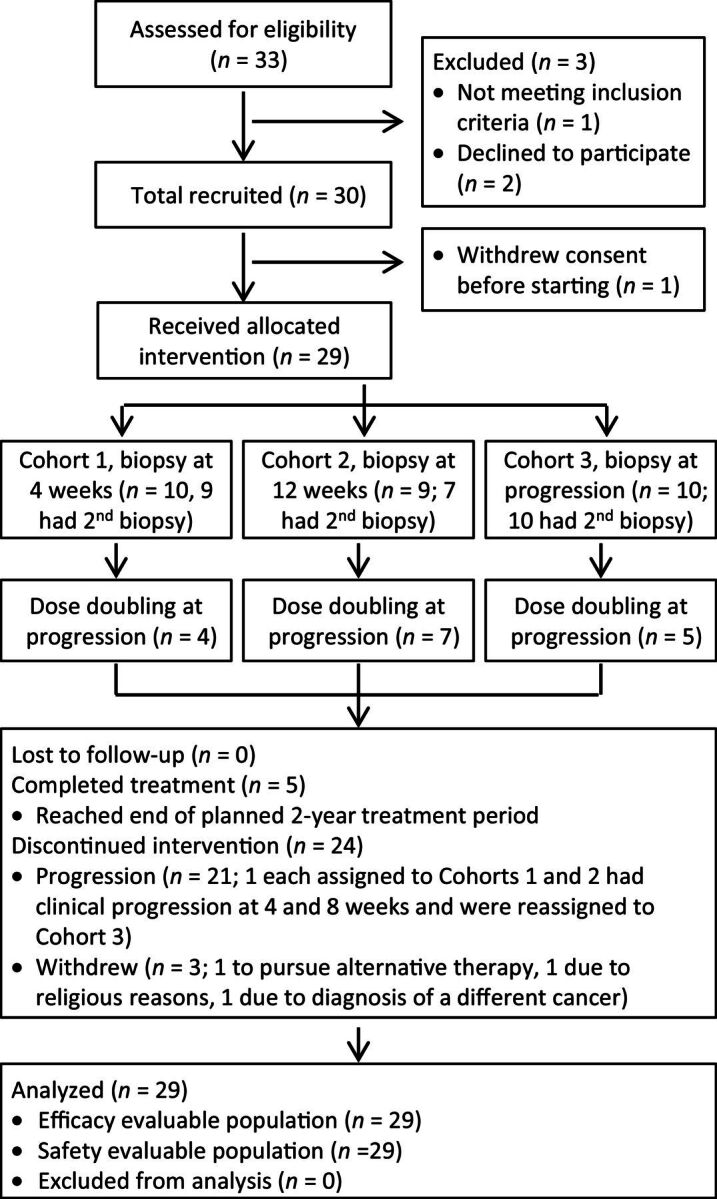
Experimental design: We performed a phase II study of AA plus prednisone in mCRPC. The primary outcome was tissue testosterone at 4 weeks. Exploratory outcomes were association of steroid levels and genomic alterations with response, and escalating AA to 2,000 mg at progression.

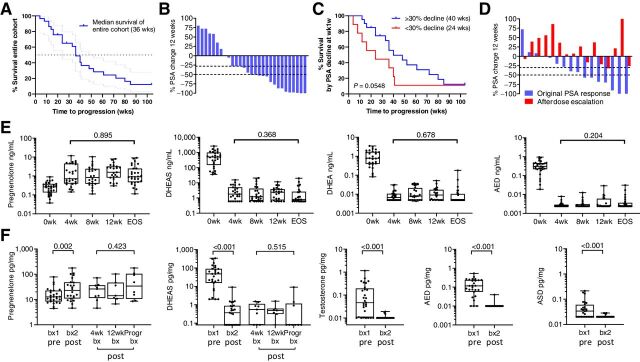
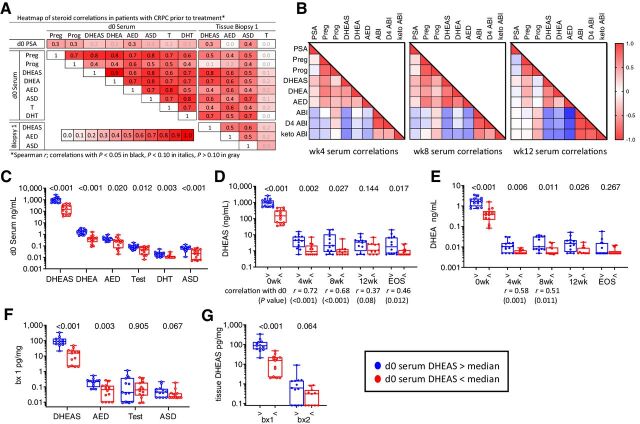
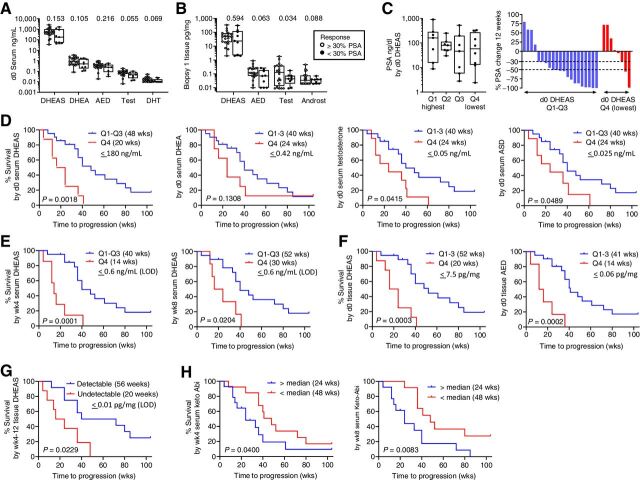
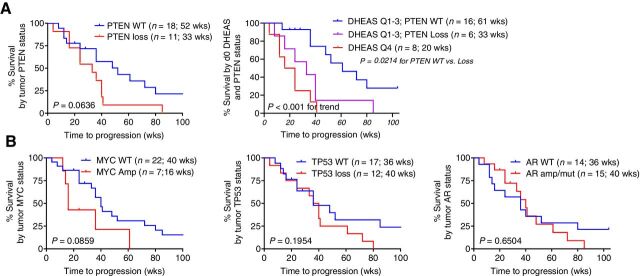
Results: Twenty-nine of 30 men were evaluable. Testosterone in metastatic biopsies became undetectable at 4 weeks (P < 0.001). Serum and tissue dehydroepiandrosterone sulfate (DHEAS) remained detectable in many patients and was not increased at progression. Serum and tissue DHEAS in the lowest quartile (pretreatment), serum DHEAS in the lowest quartile (4 weeks), and undetectable tissue DHEAS (on-therapy) associated with rapid progression (20 vs. 48 weeks, P = 0.0018; 20 vs. 52 weeks, P = 0.0003; 14 vs. 40 weeks, P = 0.0001; 20 vs. 56 weeks, P = 0.02, respectively). One of 16 men escalating to 2,000 mg had a 30% PSA decline; 13 developed radiographic progression by 12 weeks. Among patients with high serum DHEAS at baseline, wild-type (WT) PTEN status associated with longer response (61 vs. 33 weeks, P = 0.02).

Conclusions: Low-circulating adrenal androgen levels are strongly associated with an androgen-poor tumor microenvironment and with poor response to AA. Patients with CRPC with higher serum DHEAS levels may benefit from dual androgen receptor (AR)-pathway inhibition, while those in the lowest quartile may require combinations with non-AR-directed therapy.


Figures

Figure 1. Flow diagram of patient recruitment, enrollment, and participation. Diagram depicts participant flow through the study process from patient screening to data analysis.
Figure 1.
Flow diagram of patient recruitment, enrollment, and participation. Diagram depicts participant flow through the study process from patient screening to data analysis.
Figure 2. Clinical response and steroid levels in serum and metastatic tissue on AA plus prednisone. A, Kaplan–Meier plot of time to radiographic progression on standard dose AA. B, Waterfall plot showing percent change in PSA at 12 weeks. C, Kaplan–Meier plot of time to radiographic progression comparing patients with or without a 30% PSA decline at 12 weeks. D, Waterfall plot comparing the original change in PSA (blue bars) to the percent change in PSA after dose escalation of AA to 2,000 mg per day (red bars). E, Change in serum steroid levels after standard dose AA plus prednisone at baseline (0 weeks); at 4, 8 and 12 weeks (4wk, 8wk, 12wk); and at end of study (EOS) at the time of radiographic progression. F, Change in steroid levels in metastatic tissue (tx) biopsies prior to therapy (biopsy 1, bx1) and while on therapy (biopsy 2, bx2). Biopsy 2 was taken at either 4 weeks (4wk bx), 12 weeks (12wk bx), or at progression (Progr bx). P values for the indicated comparison calculated via the Wilcoxon matched-pairs test. Data are shown as box and whisker plots, where horizontal lines indicate median values, white boxes denote the 75th (upper margin) and 25th percentiles (lower margin), and upper and lower bars indicate the minimum and maximum values, respectively. AED, androstenedione; DHEA, dehydroepiandrosterone; DHEAS, dehydroepiandrosterone sulfate.
Figure 2.
Clinical response and steroid levels in serum and metastatic tissue on AA plus prednisone. A, Kaplan–Meier plot of time to radiographic progression on standard dose AA. B, Waterfall plot showing percent change in PSA at 12 weeks. C, Kaplan–Meier plot of time to radiographic progression comparing patients with or without a 30% PSA decline at 12 weeks. D, Waterfall plot comparing the original change in PSA (blue bars) to the percent change in PSA after dose escalation of AA to 2,000 mg per day (red bars). E, Change in serum steroid levels after standard dose AA plus prednisone at baseline (0 weeks); at 4, 8 and 12 weeks (4wk, 8wk, 12wk); and at end of study (EOS) at the time of radiographic progression. F, Change in steroid levels in metastatic tissue (tx) biopsies prior to therapy (biopsy 1, bx1) and while on therapy (biopsy 2, bx2). Biopsy 2 was taken at either 4 weeks (4wk bx), 12 weeks (12wk bx), or at progression (Progr bx). P values for the indicated comparison calculated via the Wilcoxon matched-pairs test. Data are shown as box and whisker plots, where horizontal lines indicate median values, white boxes denote the 75th (upper margin) and 25th percentiles (lower margin), and upper and lower bars indicate the minimum and maximum values, respectively. AED, androstenedione; DHEA, dehydroepiandrosterone; DHEAS, dehydroepiandrosterone sulfate.
Figure 3. Correlation of steroid levels in serum and metastatic tissue before and after treatment with AA plus prednisone. A, Heatmap of steroid correlations in pretreatment serum (day 0) and metastatic tissue biopsies (Biopsy 1). The Spearman r value for each correlation is shown in the box. Correlations with P < 0.05 in black, P < 0.10 in italics, P > 0.10 in gray. B, Heatmap of Spearman correlations for steroids in serum at week 4 (wk4), week 8 (wk8), and week 12 (wk12). C, Comparison of baseline serum steroid levels stratified by serum DHEAS levels above (blue) versus below (red) the median at baseline (d0). D and E, Comparison of DHEAS levels (D) and DHEA levels (E) in serum stratified by baseline serum DHEAS levels at baseline (0 weeks); at 4, 8, and 12 weeks; and at EOS. Significant Spearmen correlations between on-treatment and baseline values at each time point is indicated below the timepoint. F, Comparison of steroid levels in pretreatment tissue biopsies (bx 1) stratified by serum DHEAS levels above (blue) vs. below (red) the median at baseline. G, Comparison of tissue (tx) DHEAS levels stratified by baseline serum DHEAS levels in pretreatment and on-treatment tissue biopsies (bx1 and bx2). P values for the indicated comparison calculated via nonparametric Mann–Whitney t tests. ABI, abiraterone; D4 ABI, D4-abiraterone; Keto ABI, 3-keto-5α-abiraterone; Preg, pregnenolone; Prog, progesterone; Test, testosterone.
Figure 3.
Correlation of steroid levels in serum and metastatic tissue before and after treatment with AA plus prednisone. A, Heatmap of steroid correlations in pretreatment serum (day 0) and metastatic tissue biopsies (Biopsy 1). The Spearman r value for each correlation is shown in the box. Correlations with P < 0.05 in black, P < 0.10 in italics, P > 0.10 in gray. B, Heatmap of Spearman correlations for steroids in serum at week 4 (wk4), week 8 (wk8), and week 12 (wk12). C, Comparison of baseline serum steroid levels stratified by serum DHEAS levels above (blue) versus below (red) the median at baseline (d0). D and E, Comparison of DHEAS levels (D) and DHEA levels (E) in serum stratified by baseline serum DHEAS levels at baseline (0 weeks); at 4, 8, and 12 weeks; and at EOS. Significant Spearmen correlations between on-treatment and baseline values at each time point is indicated below the timepoint. F, Comparison of steroid levels in pretreatment tissue biopsies (bx 1) stratified by serum DHEAS levels above (blue) vs. below (red) the median at baseline. G, Comparison of tissue (tx) DHEAS levels stratified by baseline serum DHEAS levels in pretreatment and on-treatment tissue biopsies (bx1 and bx2). P values for the indicated comparison calculated via nonparametric Mann–Whitney t tests. ABI, abiraterone; D4 ABI, D4-abiraterone; Keto ABI, 3-keto-5α-abiraterone; Preg, pregnenolone; Prog, progesterone; Test, testosterone.
Figure 4. Association of steroid and abiraterone levels with PSA decline and radiographic progression on AA plus prednisone. A and B, Comparison of steroid levels in serum (A) and metastatic tissue biopsies (B), based on achieving a 30% PSA decline at 12 weeks. C, Distribution of pretreatment PSA levels and waterfall plot showing percent change in PSA at 12 weeks by quartile (Q1-Q4) of pretreatment serum DHEAS levels. P values for the indicated comparison calculated via nonparametric Wilcoxon rank–sum test (Mann–Whitney test). D, Radiographic PFS (rPFS) as a function of baseline serum androgen levels comparing subjects in the lowest vs. highest 3 quartiles (Q4 vs. Q1–3). E, rPFS as a function of on-treatment serum DHEAS levels at week 4 (wk4) and week 8 (wk8) comparing subjects in the lowest vs. highest 3 quartiles (Q4 vs. Q1–3). F, rPFS as a function of pretreatment tissue DHEAS and AED levels comparing subjects in the lowest vs. highest 3 quartiles (Q4 vs. Q1–3). In each case, the cut-off value reflects the highest number of the bottom one-fourth of the values. The quartiles were separately assessed in the pre- and on-treatment populations. G, rPFS comparing subjects with detectable vs. undetectable levels of DHEAS in tissue biopsies taken at 4 and 12 weeks of therapy. H, rPFS as a function of serum 3-keto-5α-abiraterone levels (keto-Abi) at wk4 and wk8 comparing subjects above vs. below the median. PFS was estimated using Kaplan–Meier methods and compared using the Gehan–Wilcoxan test. Androst, androsterone; Q, quartile.
Figure 4.
Association of steroid and abiraterone levels with PSA decline and radiographic progression on AA plus prednisone. A and B, Comparison of steroid levels in serum (A) and metastatic tissue biopsies (B), based on achieving a 30% PSA decline at 12 weeks. C, Distribution of pretreatment PSA levels and waterfall plot showing percent change in PSA at 12 weeks by quartile (Q1-Q4) of pretreatment serum DHEAS levels. P values for the indicated comparison calculated via nonparametric Wilcoxon rank–sum test (Mann–Whitney test). D, Radiographic PFS (rPFS) as a function of baseline serum androgen levels comparing subjects in the lowest vs. highest 3 quartiles (Q4 vs. Q1–3). E, rPFS as a function of on-treatment serum DHEAS levels at week 4 (wk4) and week 8 (wk8) comparing subjects in the lowest vs. highest 3 quartiles (Q4 vs. Q1–3). F, rPFS as a function of pretreatment tissue DHEAS and AED levels comparing subjects in the lowest vs. highest 3 quartiles (Q4 vs. Q1–3). In each case, the cut-off value reflects the highest number of the bottom one-fourth of the values. The quartiles were separately assessed in the pre- and on-treatment populations. G, rPFS comparing subjects with detectable vs. undetectable levels of DHEAS in tissue biopsies taken at 4 and 12 weeks of therapy. H, rPFS as a function of serum 3-keto-5α-abiraterone levels (keto-Abi) at wk4 and wk8 comparing subjects above vs. below the median. PFS was estimated using Kaplan–Meier methods and compared using the Gehan–Wilcoxan test. Androst, androsterone; Q, quartile.
Figure 5. Association of PTEN status with radiographic progression on AA plus prednisone. A, rPFS as a function of PTEN status alone or as a function of baseline serum DHEAS levels stratified by PTEN status, comparing subjects in the lowest vs highest three quartiles (Q4 vs Q1–3). B, rPFS as a function of MYC, TP53, or AR status.
Figure 5.
Association of PTEN status with radiographic progression on AA plus prednisone. A, rPFS as a function of PTEN status alone or as a function of baseline serum DHEAS levels stratified by PTEN status, comparing subjects in the lowest vs highest three quartiles (Q4 vs Q1–3). B, rPFS as a function of MYC, TP53, or AR status.

References

    1. Montgomery RB, Mostaghel EA, Vessella R, Hess DL, Kalhorn TF, Higano CS, et al. Maintenance of intratumoral androgens in metastatic prostate cancer: a mechanism for castration-resistant tumor growth. Cancer Res 2008;68:4447–54. - PMC - PubMed
    1. Mohler JL, Gregory CW, Ford OH 3rd, Kim D, Weaver CM, Petrusz P, et al. The androgen axis in recurrent prostate cancer. Clin Cancer Res 2004;10:440–8. - PubMed
    1. Stanbrough M, Bubley GJ, Ross K, Golub TR, Rubin MA, Penning TM, et al. Increased expression of genes converting adrenal androgens to testosterone in androgen-independent prostate cancer. Cancer Res 2006;66:2815–25. - PubMed
    1. Sharifi N. The 5alpha-androstanedione pathway to dihydrotestosterone in castration-resistant prostate cancer. J Investig Med 2012;60:504–7. - PMC - PubMed
    1. Taplin ME, Montgomery B, Logothetis CJ, Bubley GJ, Richie JP, Dalkin BL, et al. Intense androgen-deprivation therapy with abiraterone acetate plus leuprolide acetate in patients with localized high-risk prostate cancer: results of a randomized phase II neoadjuvant study. J Clin Oncol 2014;32:3705–15. - PMC - PubMed

Publication types

MeSH terms