. 2021 Aug 18;4(10):e202101152.
doi: 10.26508/lsa.202101152. Print 2021 Oct.

The structure and flexibility analysis of the Arabidopsis synaptotagmin 1 reveal the basis of its regulation at membrane contact sites

Affiliations

The structure and flexibility analysis of the Arabidopsis synaptotagmin 1 reveal the basis of its regulation at membrane contact sites

Juan L Benavente et al. Life Sci Alliance. .

Abstract

Non-vesicular lipid transfer at ER and plasma membrane (PM) contact sites (CS) is crucial for the maintenance of membrane lipid homeostasis. Extended synaptotagmins (E-Syts) play a central role in this process as they act as molecular tethers of ER and PM and as lipid transfer proteins between these organelles. E-Syts are proteins constitutively anchored to the ER through an N-terminal hydrophobic segment and bind the PM via a variable number of C-terminal C2 domains. Synaptotagmins (SYTs) are the plant orthologous of E-Syts and regulate the ER-PM communication in response to abiotic stress. Combining different structural and biochemical techniques, we demonstrate that the binding of SYT1 to lipids occurs through a Ca2+-dependent lipid-binding site and by a site for phosphorylated forms of phosphatidylinositol, thus integrating two different molecular signals in response to stress. In addition, we show that SYT1 displays three highly flexible hinge points that provide conformational freedom to facilitate lipid extraction, protein loading, and subsequent transfer between PM and ER.


Conflict of interest statement

The authors declare that they have no conflict of interest.

Figures

Figure 1.
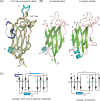
Figure 1.. The structure of the C2A domain of SYT1.
(A) Domain organization of plant (SYTs) and human (E-Syts) extended synaptotagmins. Human E-Syt1 displays five C2 domains, whereas E-Syt2 and E-Syt3 display three. The constructs used in this work are indicated. (B) Ribbon representations of SYT1C2A (left) and E-Syt2C2A (right), Ca2+ ions are displayed as white spheres. “N” and “C” stand for N terminus and C terminus, respectively. (C) Amino acid sequence alignment of the C2 domains of plant SYTs and human E-Syts. Proteins of known structure are marked with an asterisk and the corresponding Protein Data Bank codes are indicated. Residues involved in Ca2+ binding are indicated with a red triangle and highlighted in a red box; residues likely to make up the polybasic sites are indicated with a blue triangle and highlighted in a blue box; secondary structural elements of SYT1C2A are indicated as horizonal arrows and “T” stands for residues involved in a β-turn. SYT1C2A point mutations are indicated with vertical arrows.
Figure S1.
Figure S1.. Comparison between SYT1C2A and the C2 domains of E-Syt2.
(A) Superposition of the structures of SYT1C2A (green) and E-Syt2C2A (wheat; Protein Data Bank [PDB] code 4NPJ). (B) A ribbon representation of the structure of E-Syt2C2B (left; PDB code 4NPJ) and E-Syt2C2C (right, PDB code 2DMG). (C) Schematic representation of the topologies of the C2 domains.
Figure 2.
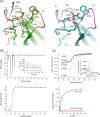
Figure 2.. The structure and properties of the Ca2+-dependent lipid-binding site of SYT1C2A.
(A) A section of the structures of SYT1C2A in complex with Ca2+ (left) and Cd2+ (Right). (B) Calorimetric titration of SYT1C2A with Ca2+. (Upper panel) A representative thermogram obtained by the addition of 20 mM CaCl2 to a solution of 151 μM SYT1C2A at 25°C. The inset corresponds to the thermogram obtained by the addition of CaCl2 to a solution of SYT1C2A supplemented with 10 μM CaCl2; no detectable heat is observed. (Lower panel) Dependence of the heat released per mol of Ca2+ injected as a function of the Ca2+:SYT1C2A molar ratio. The solid line corresponds to the best fit of the experimental data based on a one-set-of-sites model. “DP” stands for differential power. (C) (Upper panel) Thermal denaturation of SYT1C2A at different Ca2+ concentrations. The inset represents the Ti determined as the maximum of the second derivative of the ratio between the fluorescence emission at 350 and 330 nm. (Lower panel) Determination of the Kd of SYT1C2A or SYT1C2A-DADA and Ca2+ using the initial fluorescence change as a function of free Ca2+ concentration. Three independent replicates were performed.
Figure S2.
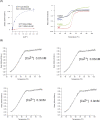
Figure S2.. Ca2+-binding properties of SYT1C2A Ca site I and II mutants and SYT1C2B.
(A) Determination of the Kd of SYT1C2A-E340A and SYT1C2A-D282A in complex with Ca2+ using the initial fluorescence change as a function of free Ca2+ concentration (left). Thermal denaturation of SYT1C2A WT and Ca site mutants at 3 mM Ca2+ (right). Three independent replicates were performed. (B) Thermal denaturation of SYT1C2B at different Ca2+ concentrations. The sequence analysis of SYT1C2B shows that the protein fragment does not harbor any of the residues conforming the Ca2+-binding site (Fig 1C). Thus, as expected, no shift in the Ti nor in the initial fluorescence ratio is observed upon Ca2+ addition, proving that the protein fragment does not bind Ca2+.
Figure S3.
Figure S3.. Analysis of the coordination and geometry of the interaction between Ca2+ (left column) and Cd2+ (right column) with oxygen using crystallographic data from the Cambridge Structural Database (CSD).
(A, B) Distribution of the number of connections for Ca and Cd atoms in the CSD. (C, D) Distribution of Ca/Cd-O distances (Å). (E, F) Observed Ca-Ca and Cd-Cd distances (Å). The mean and the standard deviations of the maximum are given in the histograms. The more likely geometry corresponds to the more stable structures. The metal binding site of SYT1C2A restricts the metal–metal distance to 3.7 Å. This is in agreement with the first maximum at 3.9 Å (F panel). Hence, it is likely that the constraints imposed at SYT1C2Asite hinders the presence of two Cd atoms site hinders the presence of two Cd atoms.
Figure 3.
Figure 3.. The polybasic-binding site of SYT1C2A and equivalent sites of C2 domains of E-Syt1.
(A) Ribbon representation of the structure of SYT1C2A showing as sticks the side chains of those residues making up the polybasic binding site. Those residues mutated to prepare the SYT1C2A-PolyB mutant protein are highlighted. (B) Surface representation displaying the molecular electrostatic potentials of the SYT1C2A domain and C2 domains of E-Syt2. Red and blue stand for negative and positive potentials, respectively. All the representations have been scaled to the same level. The domains are orientated as the ribbon representation. The polybasic patch of SYT1C2A and E-Syt2C2C are squared. The Protein Data Bank codes for E-Syt2 C2 domains are 4NPJ for C2A and C2B and 2DMG for C2C.
Figure 4.
Figure 4.. Lipid-binding properties of SYT1C2A.
(A) Comparative analyses of phospholipid binding of SYT1C2A and mutants. Protein quantifications of the soluble fraction after lipid pelleting were performed by measuring the intrinsic Trp fluorescence under denatured conditions. Lipid binding activity is expressed as the percentage of the bound protein to lipids. Error bars indicate the standard error calculated from three independent measurements. (B) Representative sensograms representing the binding of SYT1C2A, SYT1C2A-PolyB, and SYT1C2B to a PC/PS or to a PC/PS/PI monolayers in the presence of Ca2+, EGTA, or IP3. “a.u.” stands for arbitrary units. The inset represents a scheme of a bio-layer interferometry biosensor in a SYT1C2A bound state. As molecules bind the surface, the layer thickens at the end of the tip and the path length of the reflected light changes. t test (P < 0.5*; P < 0.1**; P < 0.05***).
Figure 5.
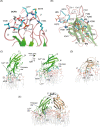
Figure 5.. SYT1C2A recognizes PS and phosphorylated inositol lipids.
(A, B) Computational model of the Ca2+-dependent and polybasic lipid-binding site in complex with DCPS and IP3, respectively. The predicted hydrogen bond and polar interactions between ligands and protein are shown as dashed lines. Relevant hydrophobic interactions are highlighted with red waves. (C) Comparison of the association of SYT1C2A to the PS-M (left) and to the PSPIP-M (right). (D, E) The association of SYT1C2B and SYT1C2AB to the PSPIP-M, respectively. The residues and lipids involved in protein membrane interaction are shown as sticks.
Figure S4.
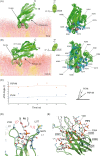
Figure S4.. Details on the molecular dynamics (MD) simulations.
(A, B) Overlay of the different conformations adopted by SYT1C2A during the MD simulations with a PS-M or with a PSPI-M, respectively. (Left panels) Ribbon representation of SYT1C2A inserted in the membrane. (Right panels) A view perpendicular to the plane of the membrane of a ribbon representation of SYT1C2A. Side chains involved in the hydrogen bonding to the phospholipids of the membrane are highlighted. (C) The change in the tilt angle of SYT1C2A with respect to the plane of the membrane along the simulations with a PS-M or with a PSPI-M. (D, E) Two details of the MD simulations showing the relevant interactions of SYT1C2A and PSPI membrane at the Ca2+ and polybasic lipid binding sites, respectively. Those residues mutated to generate the SYT1C2A-PolyB fragment are highlighted. “PIP2” stands for PI(4,5)P2. (F) The RMSD per residue along the MD simulation for the SYT1C2AB protein fragment in solution, and attached to PSPI-M. The representation illustrates an overall reduction of the RMSD as a result of the protein stabilization at the membrane, which is more significant at the membrane binding loops. (G) The insertion of the SYT1C2AB tandem distorts membrane structure by defining large cavities into one leaflet. The bilayer is depicted as a white surface and the lipids interacting with the C2AB tandem are displayed in red. (H) Time traces illustrating the RMSD of the individual SYT1C2A, SYT1C2B, and the linker in-between them during the course of the simulations.
Figure S5.
Figure S5.. SAXS data and their analysis for C2AB, C2AB-Ca, and SMPC2A.
(A) Experimental scattering curves compared to the fit (black solid traces) of the simulated curves calculated from MultiFoxs modeling (the χ2 values are reported in Fig S6). (B) Guinier analysis. The black solid trace represents the linear fit from which Rg was calculated. (C) Dimensionless Kratky plot. The intersection of the dotted black trace corresponds to the value for bovine serum albumin. (D) Pair-distance distribution function plot, P(r). C2AB-Ca and C2A stand for the experiments carried out in presence of Ca and EGTA, respectively.
Figure S6.
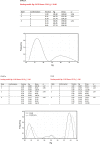
Figure S6.. MultiFoXS output for SMPC2A, C2AB-Ca, and C2AB.
The tables show the top scoring solutions for several state models together with the Rg distribution for the conformations generated by the server. More than 10,000 conformations were calculated. The histograms display two obvious relative modes that correspond to two different conformations. Note the large difference between these modes for the C2AB fragment.
Figure 6.
Figure 6.. Low resolution structure of SYT1.
(A) Schematic representation of the structure and topology of SYT1. The black dots represent the side where membrane binding occurs. (B) Comparison of the ribbon representation of the SMPC2A fragment of E-Syt2 crystal structure with two representative conformations of SYT1 SMPC2A fragment in solution. (C) Comparison of the ribbon representation of the C2AB fragment of E-Syt2 crystal structure with two representative conformations of SYT1C2AB fragment in solution. The relative weight of each conformer as estimated by the MultiFox server is indicated (W1 and W2).
Figure 7.
Figure 7.. Schematic representation of the interaction of SYT1 with the ER and plasma membrane (PM).
(Step 1) In the resting state, SYT1 is anchored to the ER membrane through the N-terminal hydrophobic segment and to the PM through the C2B domain. Stress elicits a fast Ca2+ signal (Step 2) followed by a slow accumulation of PI(4,5)P2 at the PM (Step 3). This triggers the binding of C2A to the PM. Molecular flexibility provides de basis for intimate adaptation of the C2 domains to the PM and enables a strong interaction. This rearrangement may generate tense molecular conformations and/or membrane distortions that would favor lipid extraction from the membrane and loading to SYT1. The PI(4,5)P2 reduction at PM might enable the binding of C2A to the ER membrane. This may represent the end point of the cycle in which DAG is delivered to the ER (Step 4).
Figure S7.
Figure S7.. Comparison of the hydrophobic regions of plant SYTs, human E-Syt1, Trcb1, and a buried helical hairpin with known structure.
The secondary structure, as predicted for SYTs with various algorithms, is also displayed (Quik2D from the HHpred server).

References

    1. Adams PD, Afonine PV, Bunkóczi G, Chen VB, Davis IW, Echols N, Headd JJ, Hung LW, Kapral GJ, Grosse-Kunstleve RW, et al. (2010) PHENIX: A comprehensive python-based system for macromolecular structure solution. Acta Crystallogr D Biol Crystallogr 66: 213–221. 10.1107/S0907444909052925 - DOI - PMC - PubMed
    1. Ausili A, Corbalán-García S, Gómez-Fernández JC, Marsh D (2011) Membrane docking of the C2 domain from protein kinase Cα as seen by polarized ATR-IR. The role of PIP₂. Biochim Biophys Acta 1808: 684–695. 10.1016/j.bbamem.2010.11.035 - DOI - PubMed
    1. Bian X, Saheki Y, De Camilli P (2018) Ca2+ releases E-Syt1 autoinhibition to couple ER-plasma membrane tethering with lipid transport. EMBO J 37: 219–234. 10.15252/embj.201797359 - DOI - PMC - PubMed
    1. Biasini M, Bienert S, Waterhouse A, Arnold K, Studer G, Schmidt T, Kiefer F, Gallo Cassarino T, Bertoni M, Bordoli L, et al. (2014) Swiss-model: Modelling protein tertiary and quaternary structure using evolutionary information. Nucleic Acids Res 42: W252–W258. 10.1093/nar/gku340 - DOI - PMC - PubMed
    1. Cho W, Stahelin RV (2006) Membrane binding and subcellular targeting of c2 domains. Biochim Biophys Acta 1761: 838–849. 10.1016/j.bbalip.2006.06.014 - DOI - PubMed

Publication types

MeSH terms

LinkOut - more resources