. 2021 Sep 29;41(39):8210-8219.
doi: 10.1523/JNEUROSCI.1104-21.2021. Epub 2021 Aug 18.

Modality-Specific Modulation of Temperature Representations in the Spinal Cord after Injury

Affiliations

Modality-Specific Modulation of Temperature Representations in the Spinal Cord after Injury

Chen Ran et al. J Neurosci. .

Abstract

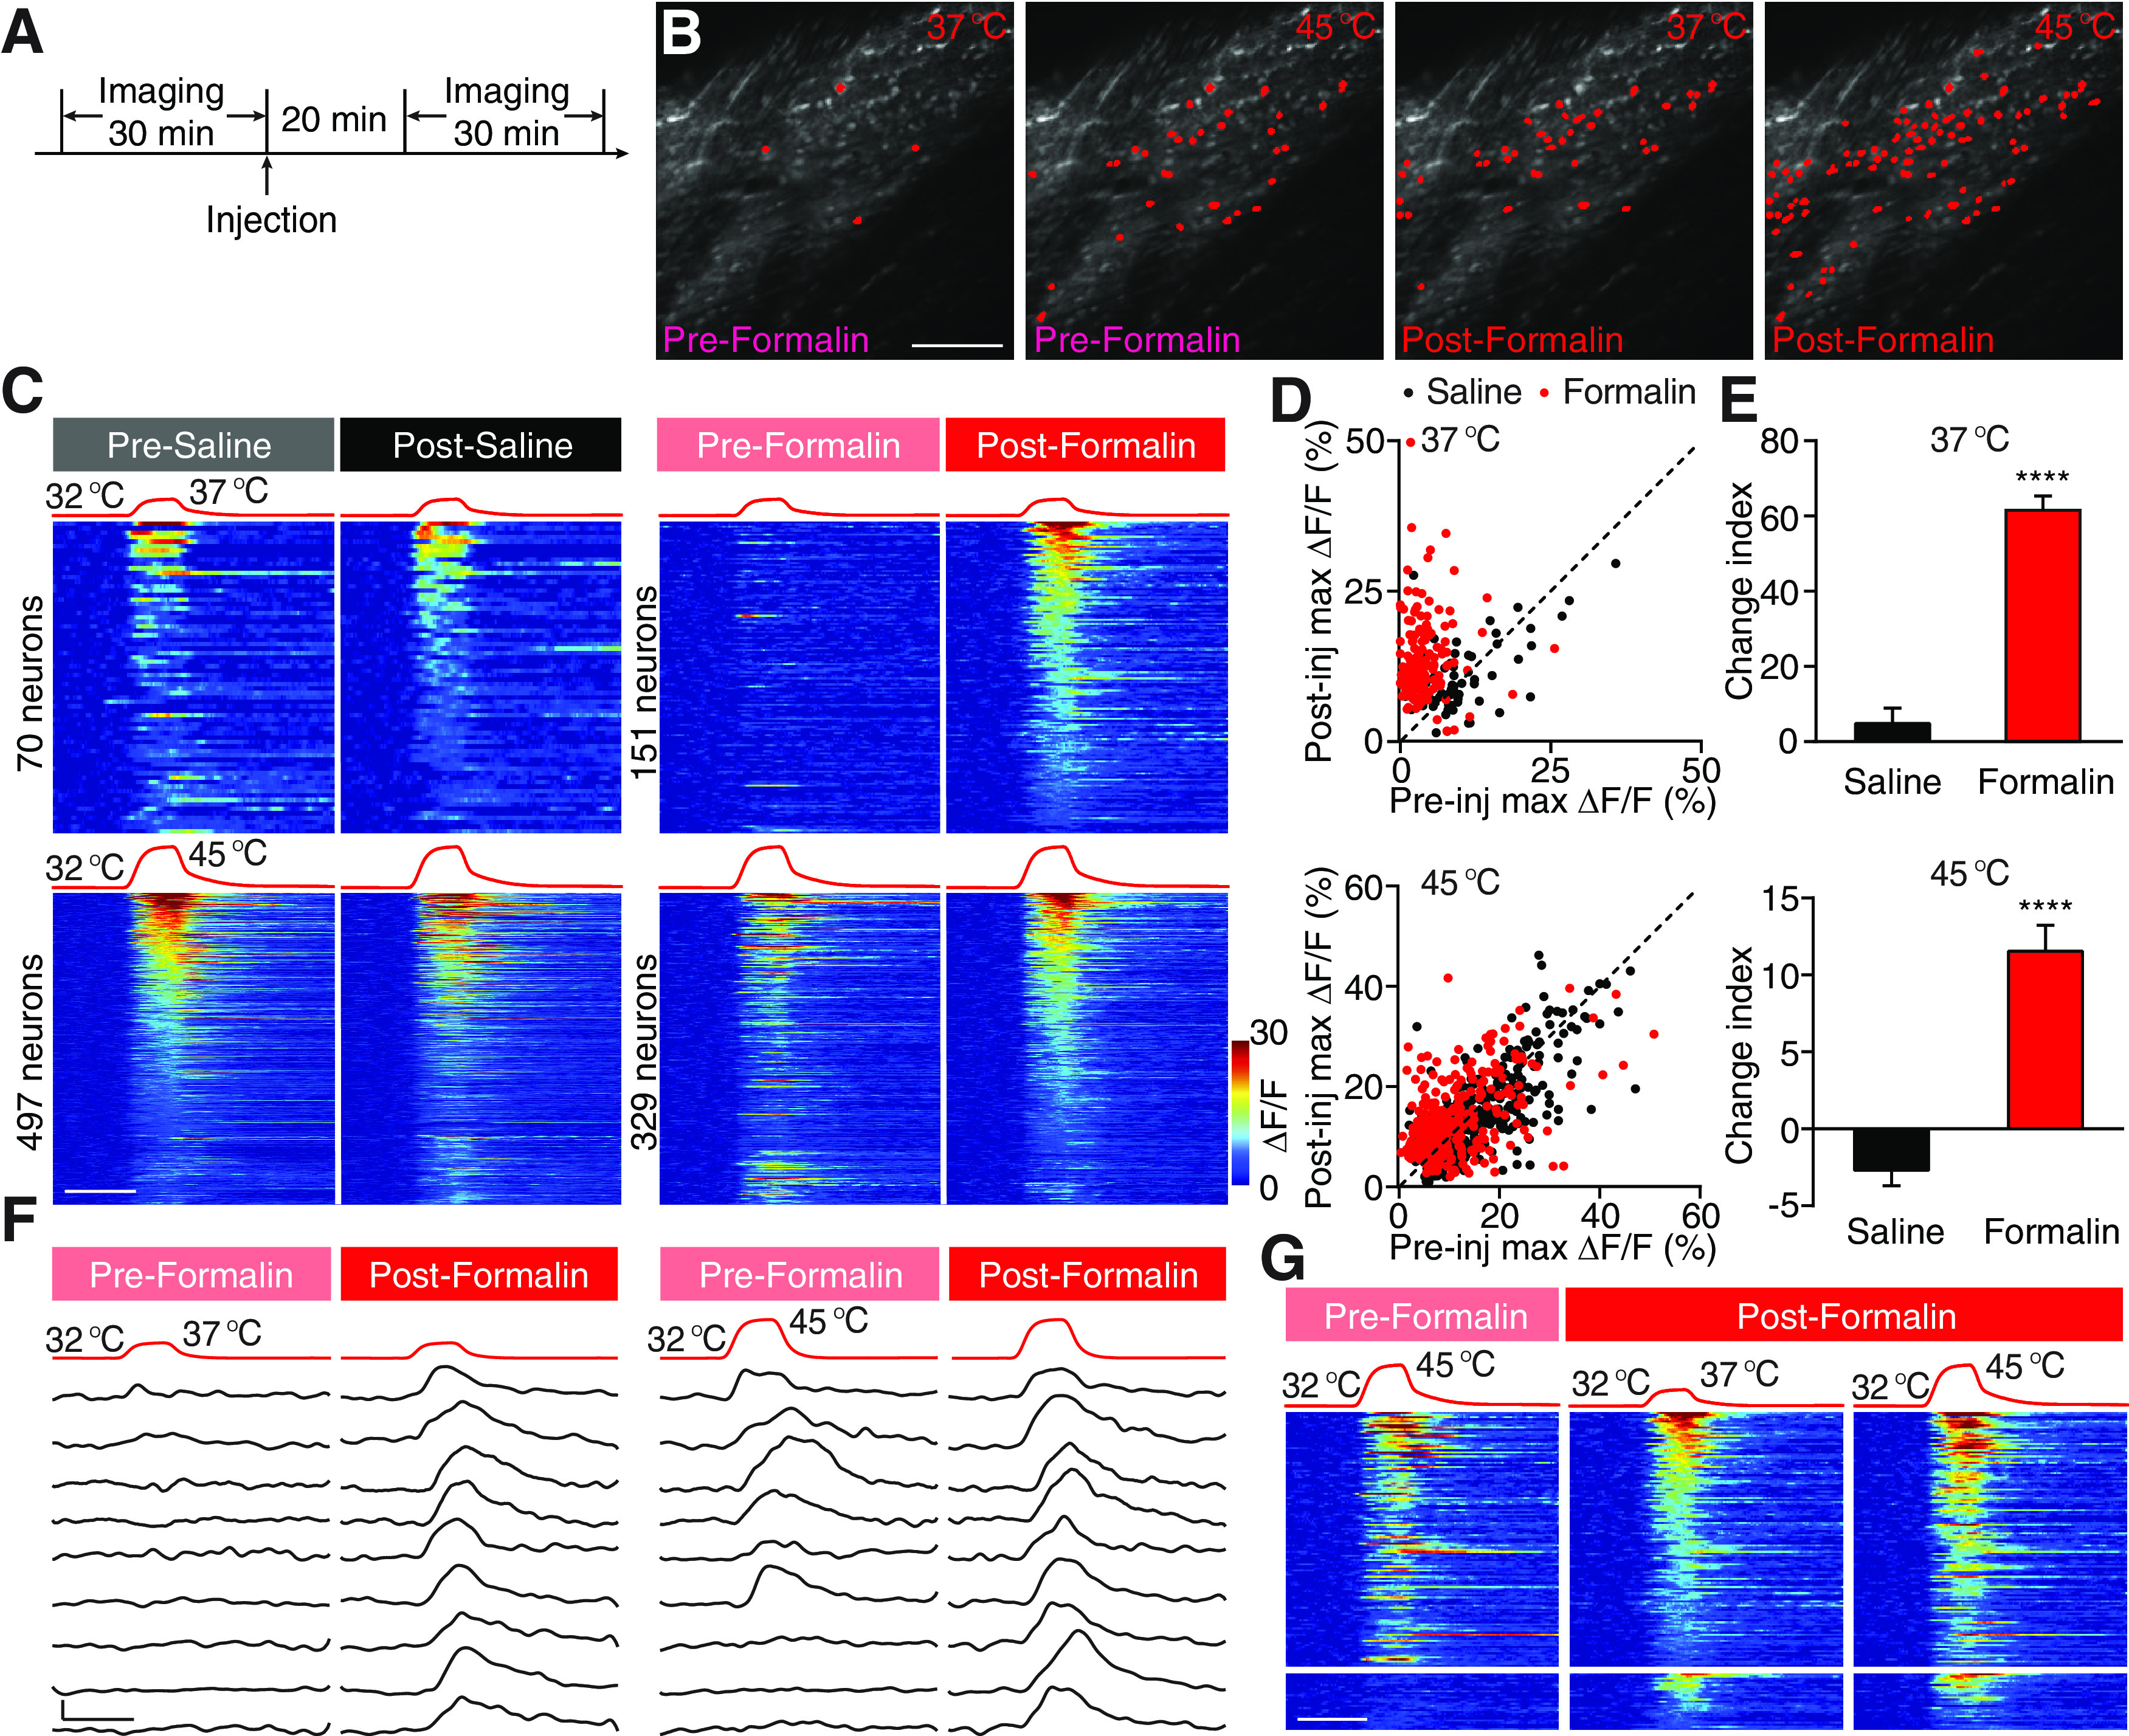
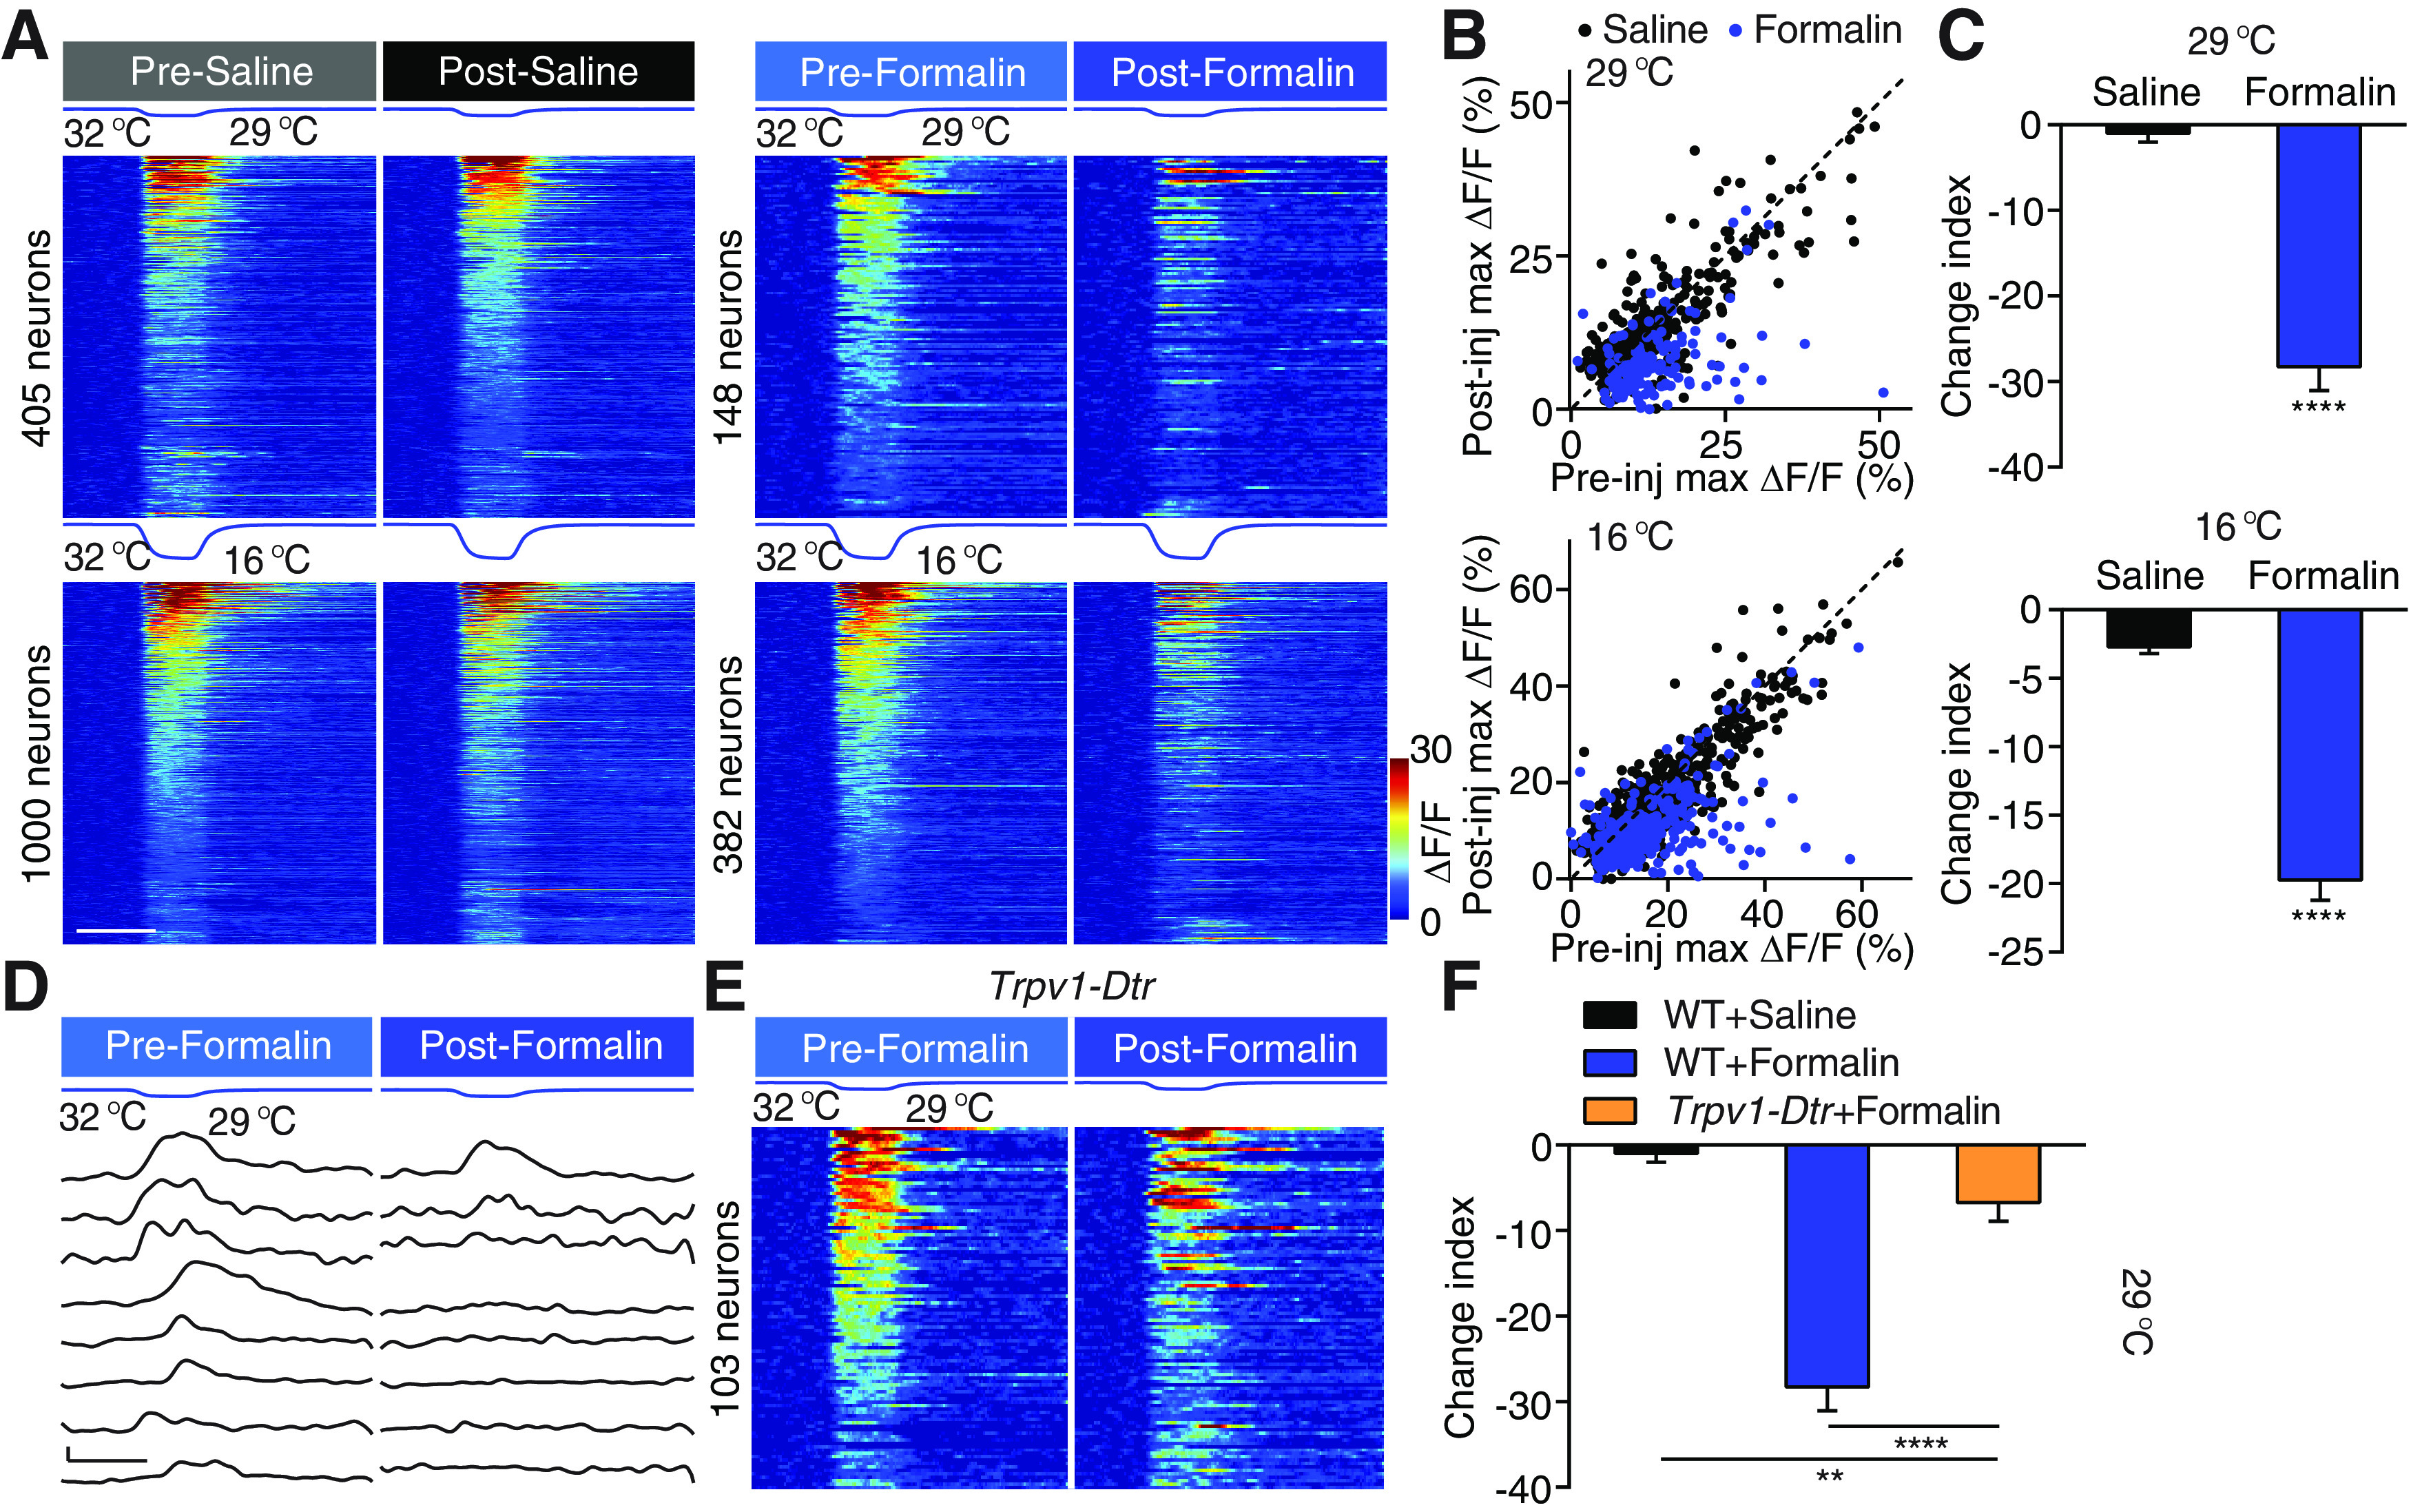
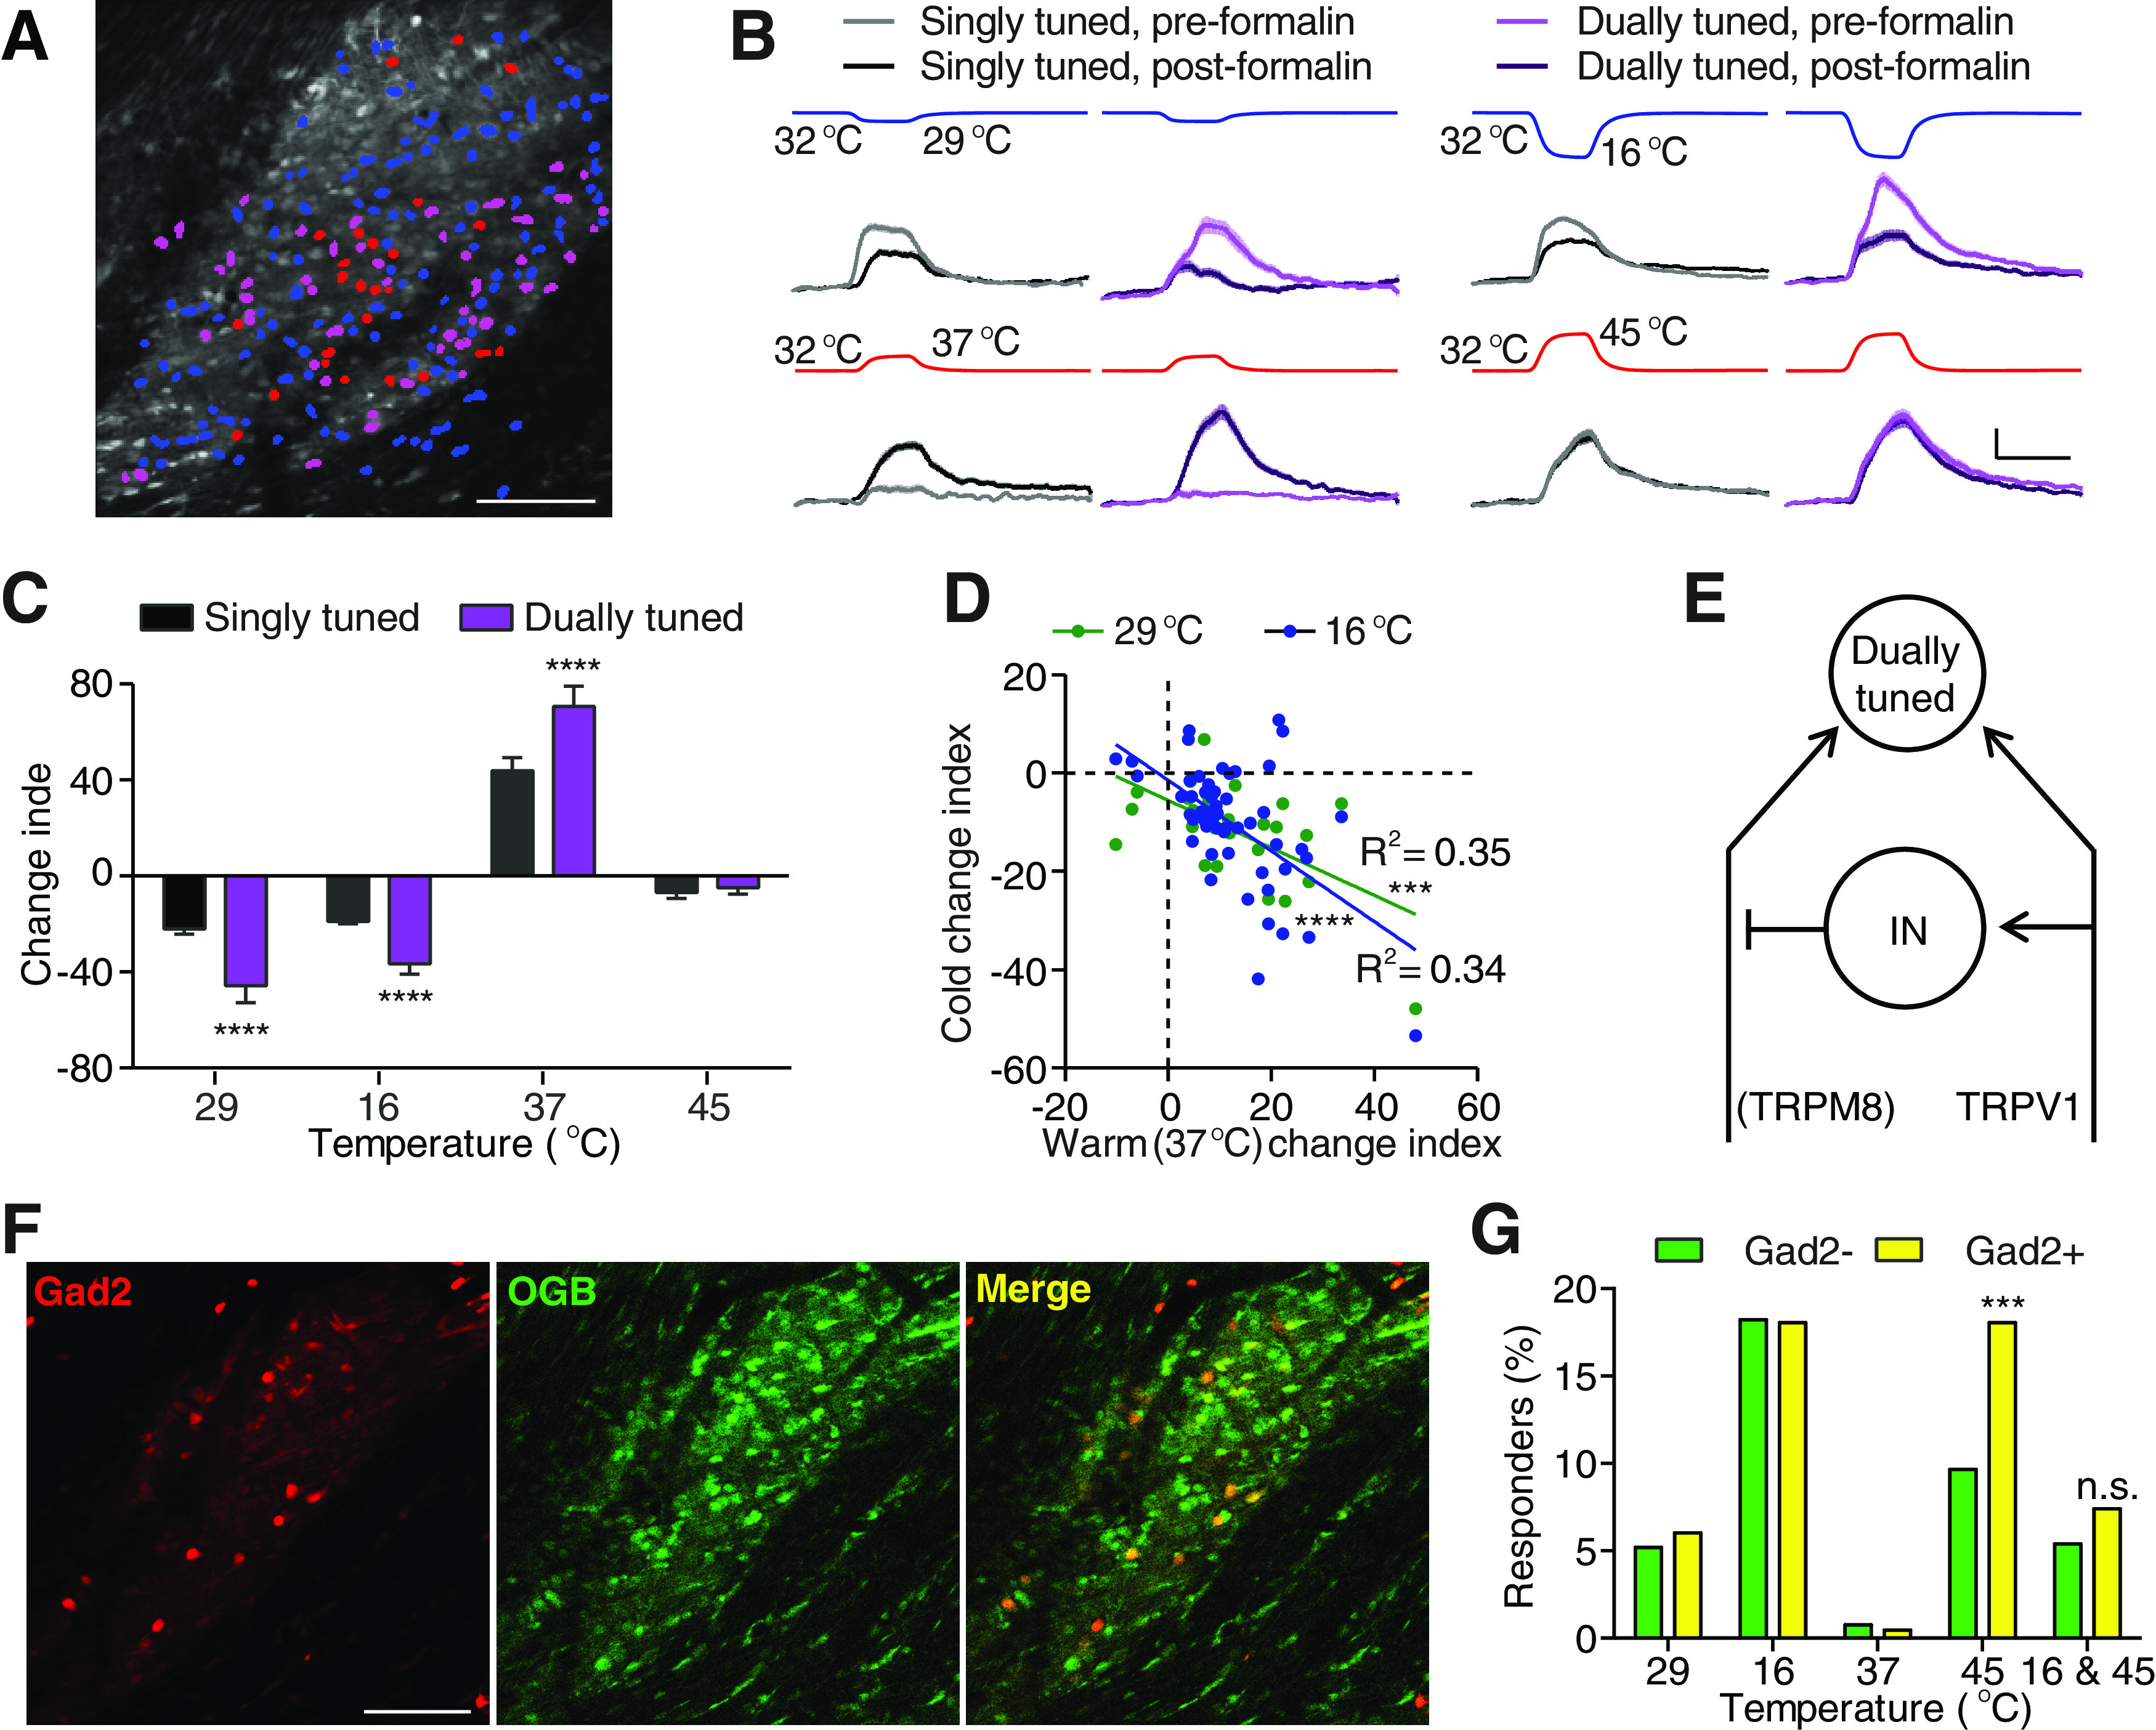
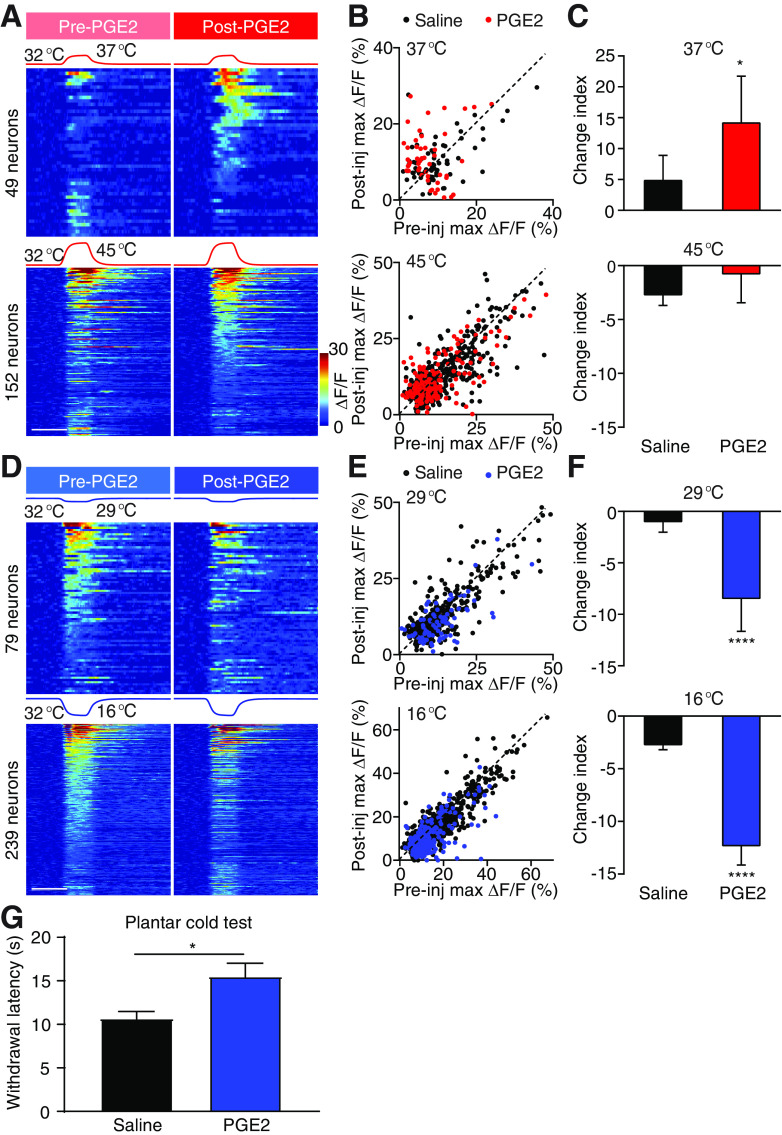
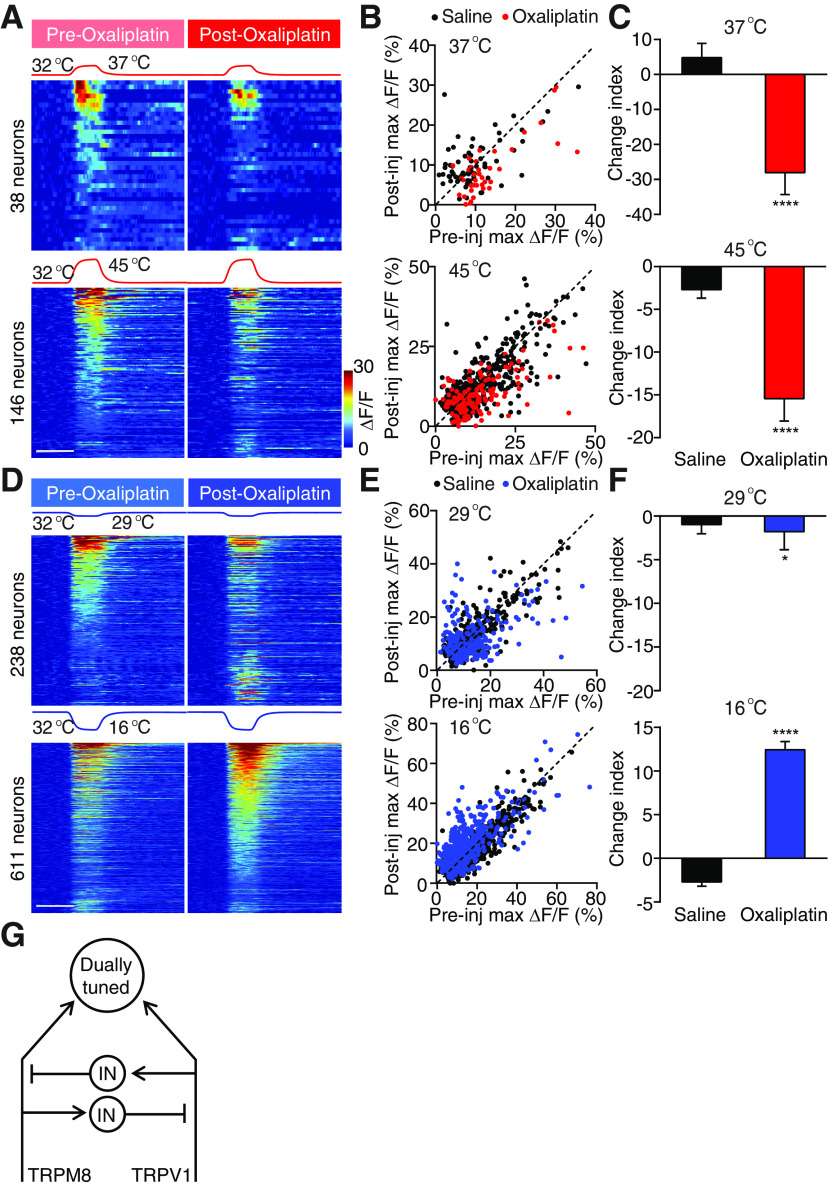
Different types of tissue injury, such as inflammatory and neuropathic conditions, cause modality-specific alternations on temperature perception. There are profound changes in peripheral sensory neurons after injury, but how patterned neuronal activities in the CNS encode injury-induced sensitization to temperature stimuli is largely unknown. Using in vivo calcium imaging and mouse genetics, we show that formalin- and prostaglandin E2-induced inflammation dramatically increase spinal responses to heating and decrease responses to cooling in male and female mice. The reduction of cold response is largely eliminated on ablation of TRPV1-expressing primary sensory neurons, indicating a crossover inhibition of cold response from the hyperactive heat inputs in the spinal cord. Interestingly, chemotherapy medication oxaliplatin can rapidly increase spinal responses to cooling and suppress responses to heating. Together, our results suggest a push-pull mechanism in processing cold and heat inputs and reveal a synergic mechanism to shift thermosensation after injury.SIGNIFICANCE STATEMENT In this paper, we combine our novel in vivo spinal cord two-photon calcium imaging, mouse genetics, and persistent pain models to study how tissue injury alters the sensation of temperature. We discover modality-specific changes of spinal temperature responses in different models of injury. Chemotherapy medication oxaliplatin leads to cold hypersensitivity and heat hyposensitivity. By contrast, inflammation increases heat sensitivity and decreases cold sensitivity. This decrease in cold sensitivity results from the stronger crossover inhibition from the hyperactive heat inputs. Our work reveals the bidirectional change of thermosensitivity by injury and suggests that the crossover inhibitory circuit underlies the shifted thermosensation, providing a mechanism to the biased perception toward a unique thermal modality that was observed clinically in chronic pain patients.

Keywords: crossover inhibition; in vivo calcium imaging; injury; spinal cord; thermosensation.


Figures

Figure 1.
Figure 1.
Formalin-induced heat hypersensitivity. A, Experimental schematic. B, Example fields of view (FOVs) showing neurons activated by two heat stimuli (to 37°C and 45°C) before and after formalin injection. Scale bar, 100 μm. C, Four sets of stimulation temperature traces and heat maps showing neuronal responses evoked by the corresponding stimuli. Left, Neuronal responses to 37°C (top) and 45°C (bottom) stimuli are pooled from 8 saline-injected mice. Right, Neuronal responses to the same two stimuli are pooled from 6 formalin-injected mice. In each set of heat maps, neurons in the heat map with more responders are rank-ordered by their maximum response amplitudes to heat stimuli, and each row represents responses from the same neuron to the same stimuli before and after injection. Any neuron that shows a positive response either before or after injection is included in the analysis. The averaged response amplitudes of responders to 37°C and 45°C stimuli do not differ between pre-formalin and pre-saline groups (Extended Data Figure 1-1). Scale bar, 20 s. D, Scatter plots comparing maximum ΔF/F of neurons in C in response to 37°C (top) and 45°C (bottom) stimuli before and after injection. Each dot represents maximum ΔF/F before (x axis, pre-injection) or after (y axis, post-injection) injections of saline (black) or formalin (red). Dashed line is diagonal, indicating no change after injection. E, Quantification of C. Data are mean ± SEM. The response change of each neuron by injection is depicted by a CI defined as CI = 100 × log10F/Fmax, post-injectionF/Fmax, pre-injection). ****p < 0.0001 (Mann–Whitney test). F, Stimulation temperature traces (top) and responses (bottom) of nine example neurons in response to 37°C and 45°C before (left) and after (right) formalin injection. Responses in each row are from the same neuron. The bottom three rows are example responses from silent nociceptive neurons that did not respond to 45°C (a heat stimulus) before formalin injection but responded to 37°C (a warm stimulus) after injection. Scale bar, 20 s, 10% ΔF/F. G, Left, Responses to 45°C before formalin injection. Middle, Responses to 37°C after formalin injection. Right, Responses to 45°C after formalin injection. Neurons are rank-ordered by their maximum response amplitudes to 37°C stimuli after formalin injection. Each row across the three heat maps represents responses from the same neuron. Responses from the bottom heat maps are from silent nociceptive neurons (n = 27 neurons from 6 mice). Scale bar, 20 s.
Figure 2.
Figure 2.
Formalin-induced cold hyposensitivity. A, Four sets of stimulation temperature traces and heat maps showing neuronal responses evoked by the corresponding stimuli. Left, Neuronal responses to 29°C (top) and 16°C (bottom) stimuli are pooled from 8 saline-injected mice. Right, Neuronal responses to the same two stimuli are pooled from 6 formalin-injected mice. In each set of heat maps, neurons in the heat map with more responders are rank-ordered by their maximum response amplitudes to cold stimuli, and each row represents responses from the same neuron to the same stimuli before and after injection. Any neuron that shows a positive response either before or after injection is included in the analysis. Scale bar, 20 s. B, Scatter plots comparing maximum ΔF/F of neurons in A in response to 29°C (top) and 16°C (bottom) stimuli before and after injection. Each dot represents maximum ΔF/F before (x axis) or after (y axis) injections of saline (black) or formalin (red). Dashed line is diagonal, indicating no change after injection. C, Quantification of A. Data are mean ± SEM. ****p < 0.0001 (Mann–Whitney test). D, Stimulation temperature traces and responses of eight example neurons in response to 29°C before and after formalin injection. Responses in each row are from the same neuron. Scale bar, 20 s, 10% ΔF/F. E, Temperature traces and heat maps showing neuronal responses evoked by cooling to 29°C before and after formalin injection in 3 Trpv1-Dtr mice. Neurons are rank-ordered by their maximum response amplitudes to the cold stimulus before formalin injection. Each row represents responses from the same neuron. Scale bar, 20 s. F, Quantification of E. WT saline and WT formalin data are the same as in Figure 2C. **p < 0.01, ****p < 0.0001; Dunn's multiple comparisons test.
Figure 3.
Figure 3.
Formalin-induced thermosensory changes largely occur in dually tuned neurons. A, An example FOV image showing neurons activated by cooling to 16°C (blue), heating to 45°C (red), or both (magenta). Scale bar, 100 μm. B, Responses averaged from all singly (black) and dually (purple) tuned neurons that showed positive response to the four corresponding stimuli (recorded temperature traces shown on top) before (light traces) and after (dark traces) formalin injection. nsingle, 29°C = 94 neurons, ndual, 29°C = 45 neurons, nsingle, 16°C = 267 neurons, ndual, 16°C = 87 neurons, nsingle, 37°C = 36 neurons, ndual, 37°C = 55 neurons, nsingle, 37°C = 95 neurons, ndual, 37°C = 87 neurons, N = 6 mice. Scale bar, 20 s, 5% ΔF/F. Shaded area represents SEM. C, Quantification of response changes of neurons in B. Data are mean ± SEM. ****p < 0.0001 (Holm–Sidak's multiple comparisons test). D, Correlations between each neuron's formalin-induced change of responses to warmth (37°C) and to two cold temperatures (green represents 29°C; blue represents 16°C). Neurons that show positively responded to cold before formalin injection and to warmth before or after formalin injection were included in this analysis (P29°C = 0.0008, P16°C < 0.0001). E, A schematic summary of the spinal circuit underlying formalin-induced change of responses to cold and heat. IN: interneuron. F, An example FOV showing the labeling of tdTomato and Oregon Green 488 BAPTA-1 AM (OGB) in a Gad2Cre/+ ROSA26CAG-loxP-STOP-loxP-tdTomato mouse. Left, tdTomato labeling, indicating the expression of GAD2. Middle, OGB labeling in the same mouse. Right, Colabeling of tdTomato and OGB. Scale bar, 100 μm. G, Quantification of the percentage of Gad (green) and Gad+ (yellow) neurons that show positive responses to one of the four temperature stimuli or to 16°C and 45°C (dually tuned) in 5 mice. ***p < 0.001 (χ2 test).
Figure 4.
Figure 4.
PGE2 sensitizes responses to warmth and desensitizes responses to cold. A, Stimulation temperature traces and heat maps showing neuronal responses evoked by the corresponding heat stimuli. Neuronal responses to 37°C (top) and 45°C (bottom) stimuli are pooled from 3 PGE2-injected mice. In each set of heat maps, neurons in the heat map with more responders are rank-ordered by their maximum response amplitudes to heat stimuli, and each row represents responses from the same neuron to the same stimuli before and after injection. Any neuron that shows a positive response either before or after injection is included in the analysis. Scale bar, 20 s. B, Scatter plots comparing maximum ΔF/F of neurons in A in response to 37°C (top) and 45°C (bottom) stimuli before and after injection. Each dot represents maximum ΔF/F before (x axis) or after (y axis) injections of saline (black) or PGE2 (red). Dashed line is diagonal, indicating no change after injection. C, Quantification of A. Data are mean ± SEM. *p < 0.05 (Mann–Whitney test). D, Stimulation temperature traces and heat maps showing neuronal responses evoked by the corresponding cold stimuli. Neuronal responses to 29°C (top) and 16°C (bottom) stimuli are pooled from 3 PGE2-injected mice. In each set of heat maps, neurons in the heat map with more responders are rank-ordered by their maximum response amplitudes to cold stimuli, and each row represents responses from the same neuron to the same stimuli before and after injection. Any neuron that shows a positive response either before or after injection is included in the analysis. Scale bar, 20 s. E, Scatter plots comparing maximum ΔF/F of neurons in D in response to 29°C (top) and 16°C (bottom) stimuli before and after injection. Each dot represents maximum ΔF/F before (x axis) or after (y axis) injections of saline (black) or formalin (blue). Dashed line is diagonal, indicating no change after injection. F, Quantification of D. Data are mean ± SEM. ****p < 0.0001 (Mann–Whitney test). G, Paw withdrawal latency in the cold plantar assay measured after intraplantar injection of saline or PGE2 (7 mice per group, mean ± SEM). *p < 0.05 (t test).
Figure 5.
Figure 5.
Oxaliplatin sensitizes responses to strong cold and desensitizes responses to warmth and heat. A, Stimulation temperature traces and heat maps showing neuronal responses evoked by the corresponding cold stimuli. Neuronal responses to 29°C (top) and 16°C (bottom) stimuli are pooled from 5 oxaliplatin-injected mice. In each set of heat maps, neurons in the heat map with more responders are rank-ordered by their maximum response amplitudes to cold stimuli, and each row represents responses from the same neuron to the same stimuli before and after injection. Any neuron that shows a positive response either before or after injection is included in the analysis. Scale bar, 20 s. B, Scatter plots comparing maximum ΔF/F of neurons in A in response to 29°C (top) and 16°C (bottom) stimuli before and after injection. Each dot represents maximum ΔF/F before (x axis) or after (y axis) injections of saline (black) or oxaliplatin (red). Dashed line is diagonal, indicating no change after injection. C, Quantification of B. Data are mean ± SEM. *p < 0.05, ****p < 0.0001; Mann–Whitney test. D, Stimulation temperature traces and heat maps showing neuronal responses evoked by the corresponding heat stimuli. Neuronal responses to 37°C (top) and 45°C (bottom) stimuli are pooled from 5 oxaliplatin-injected mice. In each set of heat maps, neurons in the heat map with more responders are rank-ordered by their maximum response amplitudes to heat stimuli, and each row represents responses from the same neuron to the same stimuli before and after injection. Any neuron that shows a positive response either before or after injection is included in the analysis. Scale bar, 20 s. E, Scatter plots comparing maximum ΔF/F of neurons in D in response to 37°C (top) and 45°C (bottom) stimuli before and after injection. Each dot represents maximum ΔF/F before (x axis) or after (y axis) injections of saline (black) or oxaliplatin (blue). Dashed line is diagonal, indicating no change after injection. F, Quantification of E. Data are mean ± SEM. ****p < 0.0001 (Mann–Whitney test). G, A schematic summary of the spinal circuit showing the reciprocal crossover inhibition between the heat and cold pathways. IN: interneuron.

Similar articles

Cited by

References

    1. Abd-Elsayed AA, Ikeda R, Jia Z, Ling J, Zuo X, Li M, Gu JG (2015) KCNQ channels in nociceptive cold-sensing trigeminal ganglion neurons as therapeutic targets for treating orofacial cold hyperalgesia. Mol Pain 11:45. 10.1186/s12990-015-0048-8 - DOI - PMC - PubMed
    1. Abraira VE, Kuehn ED, Chirila AM, Springel MW, Toliver AA, Zimmerman AL, Orefice LL, Boyle KA, Bai L, Song BJ, Bashista KA, O'Neill TG, Zhuo J, Tsan C, Hoynoski J, Rutlin M, Kus L, Niederkofler V, Watanabe M, Dymecki SM, et al. . (2017) The cellular and synaptic architecture of the mechanosensory dorsal horn. Cell 168:295–310.e219. 10.1016/j.cell.2016.12.010 - DOI - PMC - PubMed
    1. Attal N, Bouhassira D, Gautron M, Vaillant JN, Mitry E, Lepere C, Rougier P, Guirimand F (2009) Thermal hyperalgesia as a marker of oxaliplatin neurotoxicity: a prospective quantified sensory assessment study. Pain 144:245–252. 10.1016/j.pain.2009.03.024 - DOI - PubMed
    1. Alpert MH, Frank DD, Kaspi E, Flourakis M, Zaharieva EE, Allada R, Para A, Gallio M (2020) A circuit encoding absolute cold temperature in drosophila. Curr Biol 30:2275–2288 e2275. - PMC - PubMed
    1. Bagnis R, Kuberski T, Laugier S (1979) Clinical observations on 3,009 cases of ciguatera (fish poisoning) in the South Pacific. Am J Trop Med Hyg 28:1067–1073. 10.4269/ajtmh.1979.28.1067 - DOI - PubMed

Publication types