. 2021 Aug 18;7(1):76.
doi: 10.1038/s41531-021-00210-w.

α-Synuclein-induced dysregulation of neuronal activity contributes to murine dopamine neuron vulnerability

Affiliations

α-Synuclein-induced dysregulation of neuronal activity contributes to murine dopamine neuron vulnerability

Abeer Dagra et al. NPJ Parkinsons Dis. .

Abstract

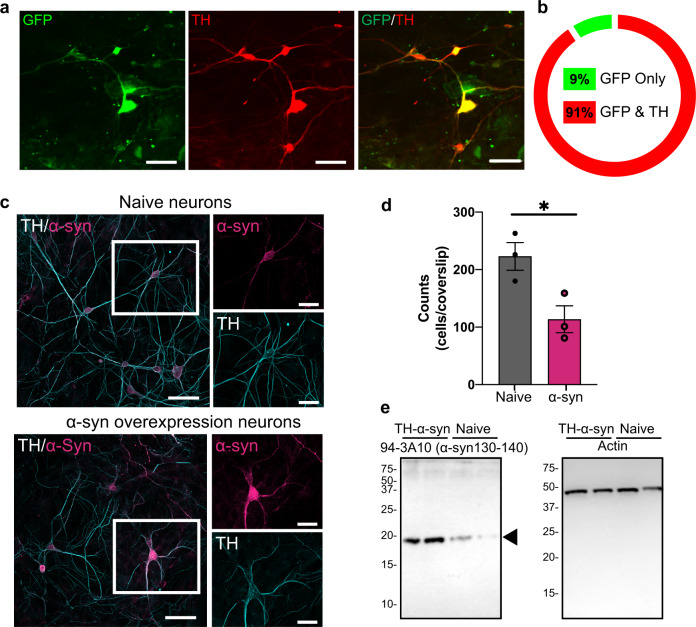
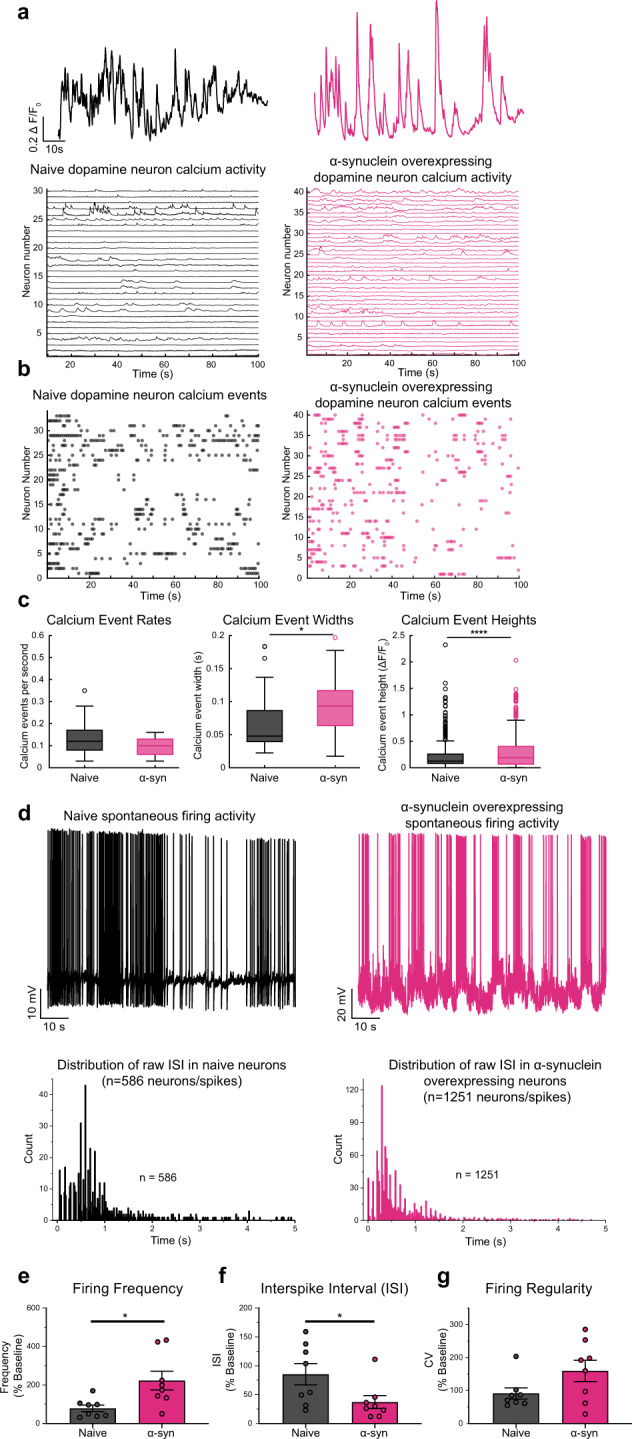
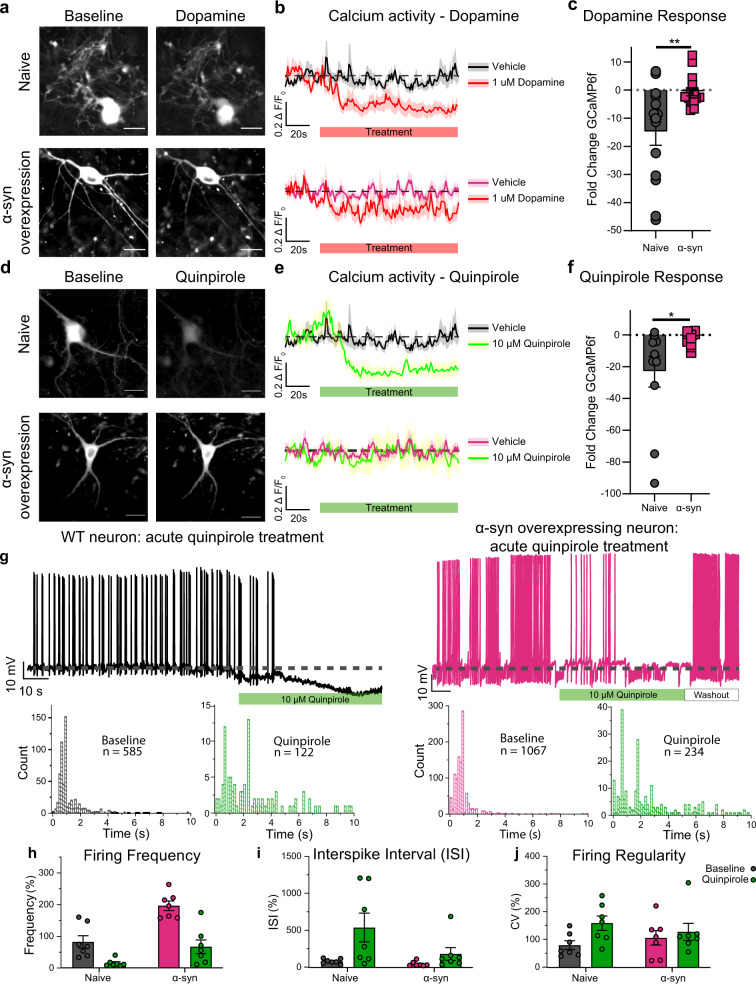
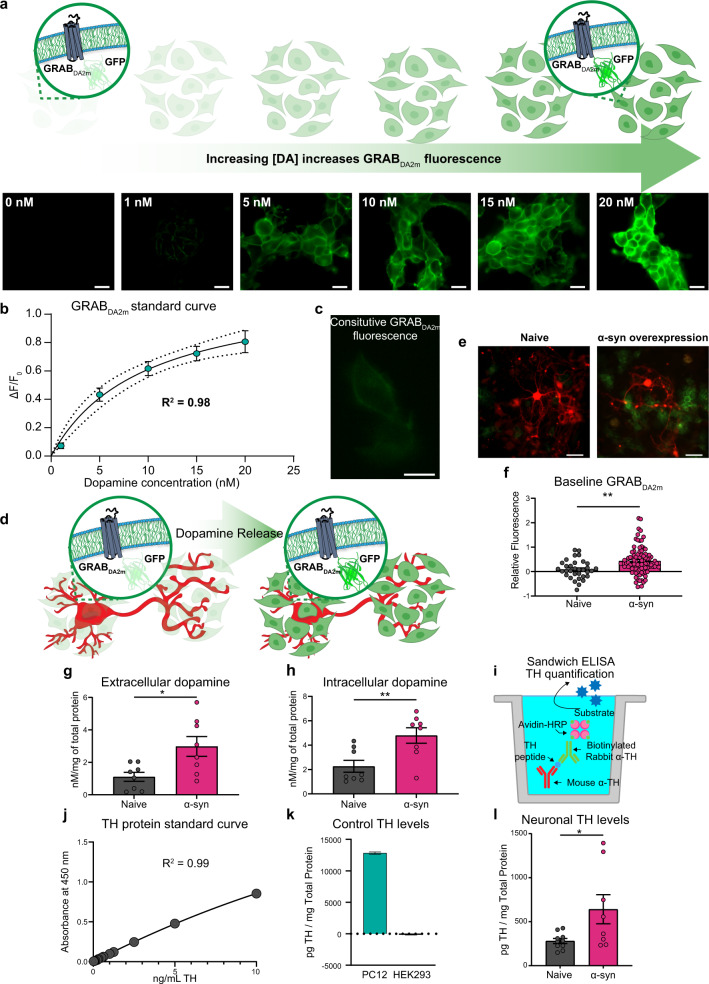
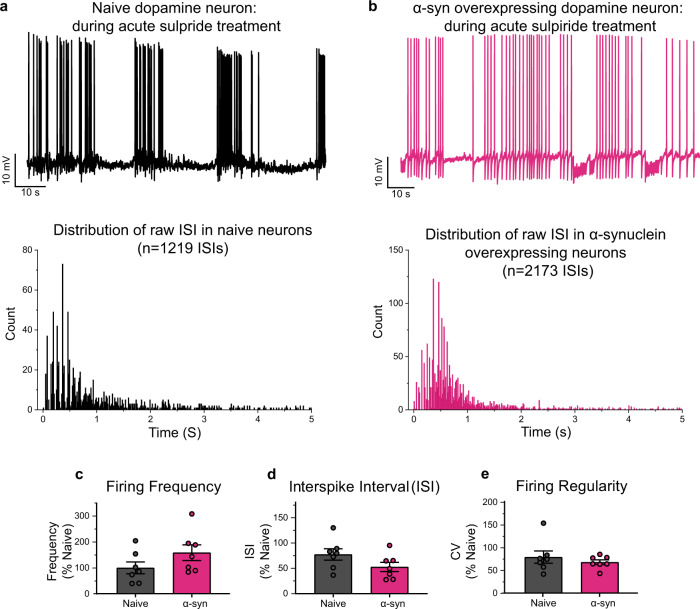
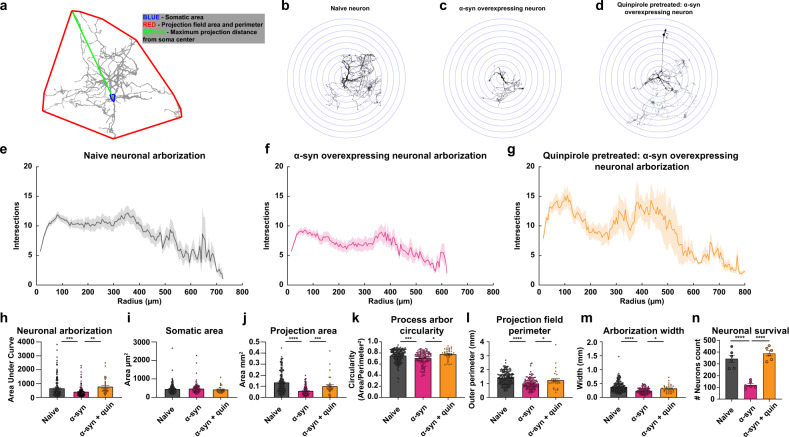
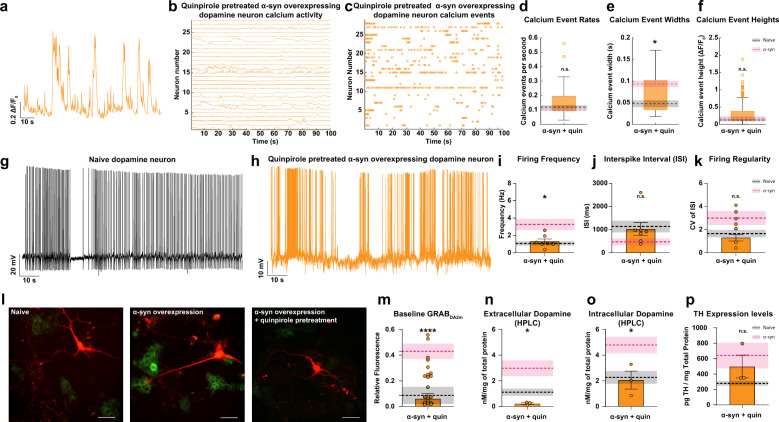
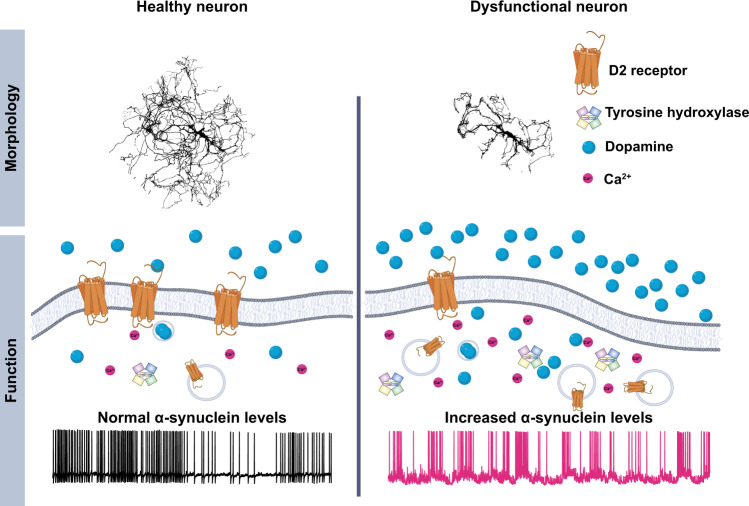
Pathophysiological damages and loss of function of dopamine neurons precede their demise and contribute to the early phases of Parkinson's disease. The presence of aberrant intracellular pathological inclusions of the protein α-synuclein within ventral midbrain dopaminergic neurons is one of the cardinal features of Parkinson's disease. We employed molecular biology, electrophysiology, and live-cell imaging to investigate how excessive α-synuclein expression alters multiple characteristics of dopaminergic neuronal dynamics and dopamine transmission in cultured dopamine neurons conditionally expressing GCaMP6f. We found that overexpression of α-synuclein in mouse (male and female) dopaminergic neurons altered neuronal firing properties, calcium dynamics, dopamine release, protein expression, and morphology. Moreover, prolonged exposure to the D2 receptor agonist, quinpirole, rescues many of the alterations induced by α-synuclein overexpression. These studies demonstrate that α-synuclein dysregulation of neuronal activity contributes to the vulnerability of dopaminergic neurons and that modulation of D2 receptor activity can ameliorate the pathophysiology. These findings provide mechanistic insights into the insidious changes in dopaminergic neuronal activity and neuronal loss that characterize Parkinson's disease progression with significant therapeutic implications.


Conflict of interest statement

The authors declare no competing interests.

Figures

Fig. 1
Fig. 1. Tyrosine hydroxylase (TH) promoter-driven adeno-associated virus (AAV) efficiently transduces human α-synuclein or the control construct (TH-GFP) in midbrain dopamine neurons.
a, b Immunolabeling of TH confirmed 91 ± 3% of TH-positive neurons co-express GFP, suggesting a high fidelity for pAAV1-TH-GFP viral transduction in the TH-positive neurons (n = 3 independent experiments). c, e The transduction specificity was confirmed via immunocytochemistry analysis and western blot (n = 3 independent experiments). Scale bars: 50 μm. d Dopaminergic neuron counts revealed that α-syn overexpression decreases neuronal survival (naive = 223 ± 33.52, α-syn = 113.7 ± 33.52, two-tailed unpaired t test, naive vs. α-syn, p = 0.03), *p < 0.05.
Fig. 2
Fig. 2. Overexpression of α-synuclein disrupts calcium dynamics and firing activity of dopaminergic neurons.
a (Top) Representative spontaneous calcium activity in naive dopaminergic neurons (left, black) and dopaminergic neurons overexpressing α-syn (right, pink) exemplify the alteration in calcium dynamics due to increased levels of α-syn. (Bottom) Spontaneous calcium activity encompassing all neurons recorded in each experimental group (n = 33 wild-type neurons, n = 40 α-syn-overexpressing neurons, form eight biological replicates). b Calcium events in all neurons. c Spontaneous calcium event rate, width, and amplitude. Overexpression of α-syn does not alter calcium event rate (two-tailed unpaired t test, WT vs. α-syn, p = 0.1775, n = 33 wild-type neurons, n = 40 α-syn-overexpressing neurons), α-syn burden broaden calcium events (p = 0.0152, two-tailed unpaired t test, WT vs. α-syn, n = 33 wild-type neurons, n = 40 α-syn-overexpressing neurons) and increases in amplitude (p = 0.0000198, two-tailed unpaired t test, WT vs. α-syn, n = 33 wild-type neurons, n = 40 α-syn-overexpressing neurons). d Representative whole-cell current-clamp recordings of spontaneously active naive (top left, black) compared with overexpressing α-syn dopaminergic neurons (top right, pink). Distribution of raw interspike intervals (ISIs) in naive (bottom left) and α-syn-overexpressing neuron (bottom right) (raw ISI distribution, Kolmogorov–Smirnov test, D = 0.26529, p < 0.001). e Naive compared with α-syn-overexpressing dopaminergic neurons (firing frequency: from eight independent experiments, 100 ± 21.21 for naive neurons vs. 281.7 ± 61.30 for α-syn-overexpressing neurons, two-tailed unpaired t test, p = 0.0142; f interspike interval (ISI): 100 ± 21.63 for naive neurons compared to 43.55 ± 13.28 for α-syn-overexpressing neurons, two-tailed unpaired t test, p = 0.0431) and g firing regularity trend in bursts with intermediated periods of quiescence (CV of ISI—100 ± 18.59 for naive neurons vs. 174.9 ± 35.20 for α-syn-overexpressing neurons, two-tailed unpaired t test, p = 0.0808). Empty circles in panel c represent statistical outliers included in the analyses. Bar graphs ± SEM are overlaid with individually filled data points. *p < 0.05; ****p < 0.0001.
Fig. 3
Fig. 3. α-Synuclein overexpression reduces D2 receptor autoinhibition.
a Representative images of naive dopaminergic neurons (top) and α-syn-overexpressing dopaminergic neurons (bottom); before (left) and during dopamine (1 μM) administration (right). b (Top) In naive neurons, dopamine reduced the ∆F/FGCaMP6f (n = 14–21, two-way ANOVA, p = 0.0003, from five independent replicates). (Bottom) In α-syn-overexpressing neurons, dopamine produced a smaller reduction in ∆F/FGCaMP6f (n = 17–26, two-way ANOVA, p = 0.0088, from five independent replicates). c The fold change in ∆F/FGCaMP6f before and after (n = 11–17, two-tailed t test, p = 0.0031, from five independent replicates). d Representative images of naive dopaminergic neurons (top) and α-syn-overexpressing neurons (bottom), before (left) and after quinpirole (10 μM) (right). e In naive neurons, quinpirole reduced the ∆F/FGCaMP6f (top panel) (n = 11–21, two-way ANOVA, p = 0.0007, from five independent biological replicates). In α-syn-overexpressing neurons, quinpirole produced a smaller reduction in ∆F/FGCaMP6f (bottom panel) (n = 13–26, two-way ANOVA, p = 0.7259, from five independent replicates). f Fold change in ∆F/FGCaMP6f before and after drug (n = 11–13, two-tailed t test, p = 0.0217, from five independent replicates). g (Top left) A representative recording of the spontaneous firing activity of naive dopaminergic neurons before and during quinpirole (10 μM) (n = 6, from three independent biological replicates). (Top right) A representative recording of the spontaneous firing activity of α-syn-overexpressing neurons before and during quinpirole (10 μM) (n = 8, from three independent experiments). (Bottom) Acute quinpirole treatment significantly increases raw interspike interval distributions of naive and α-syn-overexpressing dopaminergic neurons (Kolmogorov–Smirnov test, naive—D = 0.50642, p < 0.001, α-syn overexpressing—D = 0.47776, p < 0.001). h Comparison of the firing frequency of naive (black) and α-syn-overexpressing neurons (pink bar) during quinpirole administration (green) (n = 7 from independent experiments, two-way ANOVA, p = <0.0001). i Interspike interval—n = 7 from independent experiments, two-way ANOVA, p = 0.0136; j firing regularity (CV of ISI)—n = 7 from independent experiments, two-way ANOVA, p = 0.0200). The data are presented as mean ± SEM. h, i are presented as %change from untreated naive. Scale bar = 50 μm. *p < 0.05, **p < 0.01.
Fig. 4
Fig. 4. Overexpression of α-synuclein increases intracellular and extracellular dopamine levels with concurrent increased tyrosine hydroxylase expression.
a Schematic and representative baseline-subtracted images of GRABDA2M-HEK cells exposed to increasing concentration of dopamine. Scale bar = 20 μm. b A standard curve of GRABDA2M-HEK cells against known extracellular dopamine concentrations (R2 = 0.98). c Constitutive GRABDA2M-HEK cell fluorescence signal in the absence of dopamine neurons (in culture). Scale bar = 10 μm. d Schematic of GRABDA2M-HEK cells seeded into dopaminergic cultures. In the presence of dopamine, GRABDA2M-HEK cells rapidly increase in fluorescence intensity. e Baseline fluorescence levels denote unstimulated and spontaneous dopamine release from the neurons. The average ratio of the fluorescence signal of the cells adjacent to neuron soma and neuronal processes to the average ratio of GRABDA2M-HEK cells (only) were calculated (relative fluorescence = (FGRABDA2M-HEK cells grown with neurons − Fc)/Fc). GRABDA2M-HEK cells cocultured with naive and α-syn-overexpressing neurons. Scale bar = 50 μm. f GRABDA2M-HEK cells cocultured with α-syn-overexpressing neurons show higher basal fluorescence, indicating higher baseline dopamine release (relative fluorescence) compared to naive neurons (n = 10 from three independent replicates; the data are means ± SEM, two-tailed t test, p = 0.0013). g, h HPLC analysis complements the GRABDA2M-HEK results. Extracellular milieu (g) and cell lysate intracellular milieu (h) revealed increased intracellular and extracellular dopamine levels in α-syn-overexpressing neurons compared to naive neurons (n = 8 each, from eight independent replicates, two-tailed t test; intracellular: p = 0.0071; extracellular: p = 0.0139). i Schematic diagram of quantitative ELISA experimental design for TH in dopaminergic neurons. j Standard curve for TH sandwich ELISA shows average absorbance values for each purified TH protein concentration from multiple consecutive experiments (R2 = 0.99). k TH protein levels were detected and quantified in positive control groups, PC12 cells, whereas no protein was detected in the negative control group, HEK293 cells. l α-Syn-overexpressing neurons exhibited increased levels of TH compared to naive (n = 8–10, two-tailed t test, p = 0.0289). These experiments were performed through a double-blinded experimental design. *p < 0.05, **p < 0.01.
Fig. 5
Fig. 5. D2 receptor antagonism in dopaminergic neurons mimics burst firing pattern with a significantly higher firing frequency observed in α-synuclein-overexpressing dopamine neurons that presents with lower membrane/cytoplasmic D2 ratio.
a, b Representative whole-cell current-clamp recordings of spontaneously active naive (a, top, black) and α-syn-overexpressing (b, top pink) dopaminergic neurons during sulpiride (D2 antagonist, 5 μM) bath application. a, b (Bottom) Distribution of raw ISIs in naive (a, bottom) and α-syn-overexpressing (b, bottom) dopaminergic neurons (Kolmogorov–Smirnov test, D = 0.13114, p < 0.001). ce The bar graph shows firing frequency (c), interspike interval (ISI) (d), and firing regularity (e) during bath application of sulpiride (5 μM), revealing D2 antagonism in naive dopaminergic neurons promotes firing rates, interspike intervals, and regularity comparable to neurons overexpressing α-syn (n = 8 from three independent biological replicates, two-tailed unpaired t test, firing frequency: 100 ± 22.94 naive vs. 158.8 ± 30.37 α-syn-overexpressing neurons, p = 0.148; ISI: 100 ± 14.51 naive vs. 68.15 ± 11.84 α-syn-overexpressing neurons, p = 0.1147; CV of ISI: 100 ± 17.02 naive vs. 85.94 ± 6.599 α-syn-overexpressing neurons, p = 0.456).
Fig. 6
Fig. 6. α-Synuclein overexpression reduces arborization of dopaminergic neurons and treatment with a D2 receptor agonist partially rescues the detrimental impact of α-synuclein.
Experiments conducted in at least three independent biological replicates. a Schematic representation of morphological analysis. bd Representative binarized images of naive (b), α-syn-overexpressing (c), and quinpirole-pretreated α-syn-overexpressing neurons (d). Sholl intersection profiles of untreated naive (e), untreated α-syn-overexpressing (f), and quinpirole-pretreated α-syn-overexpressing neuron (g) measurement of area under curve (h) (one-way ANOVA, naive n = 190, α-syn, n = 114, naive vs. α-syn, p = 0.0009). Sholl analyses revealed that 48 h quinpirole (0.5 μM) pretreatment partially restores arborization complexity compared to untreated α-syn-overexpressing neurons (one-way ANOVA, naive n = 190, α-syn n = 114, and α-syn + quinpirole n = 32, naive vs. α-syn p = 0.0009, naive vs. α-syn + quinpirole p = 0.5131, and α-syn vs. α-syn + quinpirole p = 0.0041). i Somatic areas were comparable between experimental groups (one-way ANOVA, naive n = 190, α-syn n = 114, naive vs. α-syn p = 0.67). j α-Syn-overexpressing neurons project over smaller area than naive neurons (one-way ANOVA, naive n = 190, α-syn n = 114, naive vs. α-syn p = 0.0001). km Detrimental morphological changes in α-syn-overexpressing neurons (one-way ANOVA, naive n = 190, α-syn n = 114, circularity: naive vs. α-syn p = 0.0021, outer perimeter: naive vs. α-syn p = 0.0001; width: naive vs. α-syn p = 0.0001). D2 receptor agonist partially rescues the detrimental impact of α-synuclein. Quinpirole treatment of α-syn-overexpressing neurons rescued changes in (j) projection area (one-way ANOVA, naive n = 190, α-syn n = 114, and α-syn + quinpirole n = 32, naive vs. α-syn p = 0.0001, naive vs. α-syn + quinpirole p = 0.1136, and α-syn vs. α-syn treated with quinpirole p = 0.0486), (k) neuronal circularity, (l) projection field perimeter, and (m) arborization width (one-way ANOVA, naive n = 190, α-syn n = 114, and α-syn + quinpirole n = 32, circularity: naive vs. α-syn p = 0.0021, naive vs. α-syn + quinpirole p = 0.4452, and α-syn vs. α-syn + quinpirole p = 0.0046; outer perimeter: naive vs. α-syn p = 0.0001, naive vs. α-syn + quinpirole p = 0.2250, and α-syn vs. α-syn + quinpirole p = 0.0312; width: naive vs. α-syn p = 0.0001, naive vs. α-syn + quinpirole p = 0.1419, and α-syn vs. α-syn + quinpirole p = 0.0187). n Dopaminergic neuron counts revealed that α-syn overexpression decreases neuronal survival, which is rescued when pretreated with quinpirole (0.5 μM for 48 h) (one-way ANOVA, naive vs. α-syn p = 0.0008, naive vs. α-syn + quinpirole p = 0.1364, and α-syn vs. α-syn + quinpirole p = 0.0021). *p < 0.05, **p < 0.01, ***p < 0.001, ****p < 0.0001.
Fig. 7
Fig. 7. Pretreatment with D2 receptor stimulation partially restores neuronal activity in α-synuclein-overexpressing dopamine neurons.
Previous data are overlaid with the dotted line representing averages for untreated naive neurons (black) and untreated α-syn-overexpressing neurons (pink). Shading indicates SEM. a, b Representative ∆F/FGCaMP6f trace (a), calcium activity (b), and event (c) of α-syn-overexpressing neuron pretreated with quinpirole (0.5 μM, 48 h) exhibiting calcium dynamics similar to untreated naive neurons. df Event rate, width, and amplitude after quinpirole pretreatment, respectively (n = 28 quinpirole-treated α-syn-overexpressing neurons, two-tailed unpaired t test, α-syn vs. α-syn + quinpirole p = 0.2024 event rate, p = 0.0277 event widths, p = 0.6204 event height, untreated α-syn data presented in Fig. 2). Box plot whiskers represent the 95% confidence interval, the upper and lower bounds of the box represent the 75th and 25th percentiles, respectively; the middle line indicates the median value of the sample. Representative firing activity of an untreated naive (g) and quinpirole-pretreated α-syn-overexpressing neuron (h). ik Firing frequency (i), interspike interval (j), and firing regularity (k) in quinpirole-pretreated α-syn-overexpressing neuron (n = 7, 1.325 ± 0.2735 Hz for quinpirole-treated α-syn-overexpressing neurons, two-tailed unpaired t test, α-syn vs. α-syn + quinpirole p = 0.0342 for firing frequency, p = 0.1053 for ISI, p = 0.4778 for CV of ISI, untreated α-syn data are presented in Fig. 2). l GRABDA2M-HEKs seeded with untreated naive (left), untreated α-syn-overexpressing (middle), and quinpirole-pretreated α-syn-overexpressing neurons (right). m Quinpirole rescued extracellular dopamine level in α-syn-overexpressing neurons (n = 6, one-way ANOVA, naive vs. α-syn + quinpirole p = 0.9948, α-syn vs. α-syn + quinpirole p = 0.0003, untreated α-syn and naive data presented in Fig. 4). n, o HPLC quantification of dopamine confirm that quinpirole pretreatment of α-syn-overexpressing neurons reduces extracellular (n) and intracellular (o) dopamine levels vs. untreated α-syn-overexpressing neurons (n = 3 each, one-way ANOVA, intracellular: α-syn vs. α-syn + quinpirole p = 0.0325 and naive vs. α-syn + quinpirole p = 0.9959; extracellular: α-syn vs. α-syn + quinpirole p = 0.0449 and naive vs. α-syn + quinpirole p = 0.6197, untreated α-syn and naive data presented in Fig. 4). p Quantitative TH ELISA (n = 3, one-way ANOVA, naive vs. α-syn + quinpirole p = 0.4288 and α-syn vs. α-syn + quinpirole p = 0.6809, untreated α-syn and naive data are presented in Fig. 4). Data are presented as mean ± SEM, from at least three independent biological replicates. n.s. not significant. *p < 0.05, ****p < 0.0001.
Fig. 8
Fig. 8. Graphical summary.
α-Syn-mediated pathophysiological damages and loss of function of dopamine neurons precede neuronal demise.

References

    1. Cenci MA. Dopamine dysregulation of movement control in l-DOPA-induced dyskinesia. Trends Neurosci. 2007;30:236–243. doi: 10.1016/j.tins.2007.03.005. - DOI - PubMed
    1. Panigrahi B, et al. Dopamine is required for the neural representation and control of movement vigor. Cell. 2015;162:1418–1430. doi: 10.1016/j.cell.2015.08.014. - DOI - PubMed
    1. Braak H, Braak E. Pathoanatomy of Parkinson’s disease. J. Neurol. Suppl. 2000;247:3–10. doi: 10.1007/s004150050002. - DOI - PubMed
    1. Burke RE, Dauer WT, Vonsattel JPG. A critical evaluation of the Braak staging scheme for Parkinson’s disease. Ann. Neurol. 2008;64:485–491. doi: 10.1002/ana.21541. - DOI - PMC - PubMed
    1. Goedert M, Spillantini MG, Del Tredici K, Braak H. 100 years of Lewy pathology. Nat. Rev. Neurol. 2013;9:13–24. doi: 10.1038/nrneurol.2012.242. - DOI - PubMed