. 2021 Aug 18;11(1):16796.
doi: 10.1038/s41598-021-96171-4.

Longitudinal analysis of antibody decay in convalescent COVID-19 patients

Affiliations

Longitudinal analysis of antibody decay in convalescent COVID-19 patients

Weiming Xia et al. Sci Rep. .

Abstract

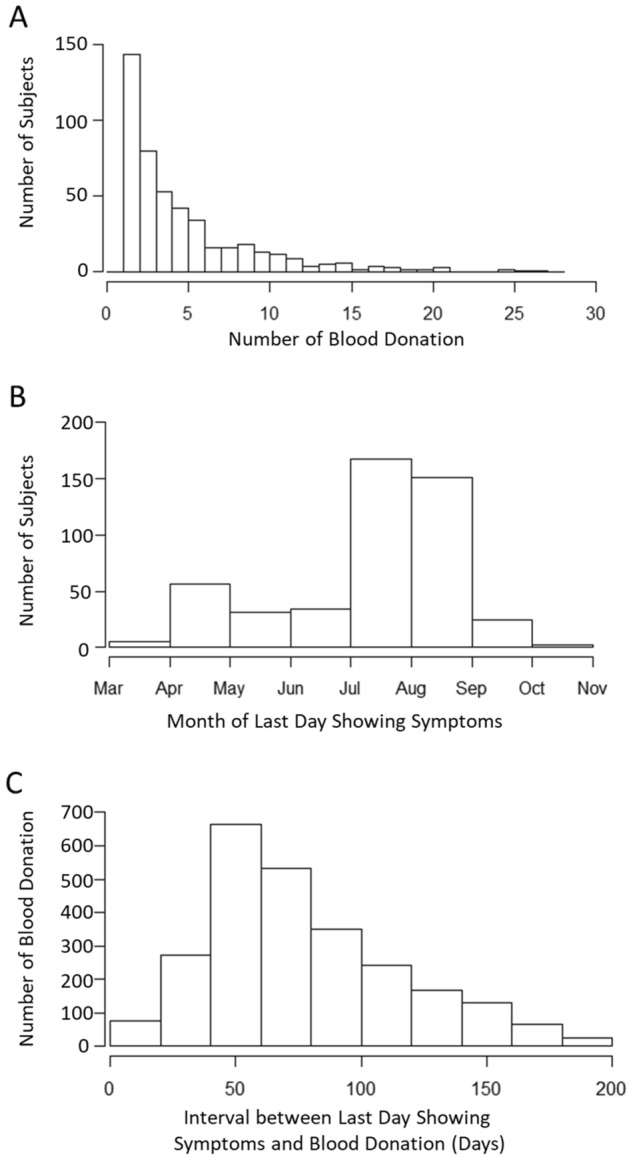
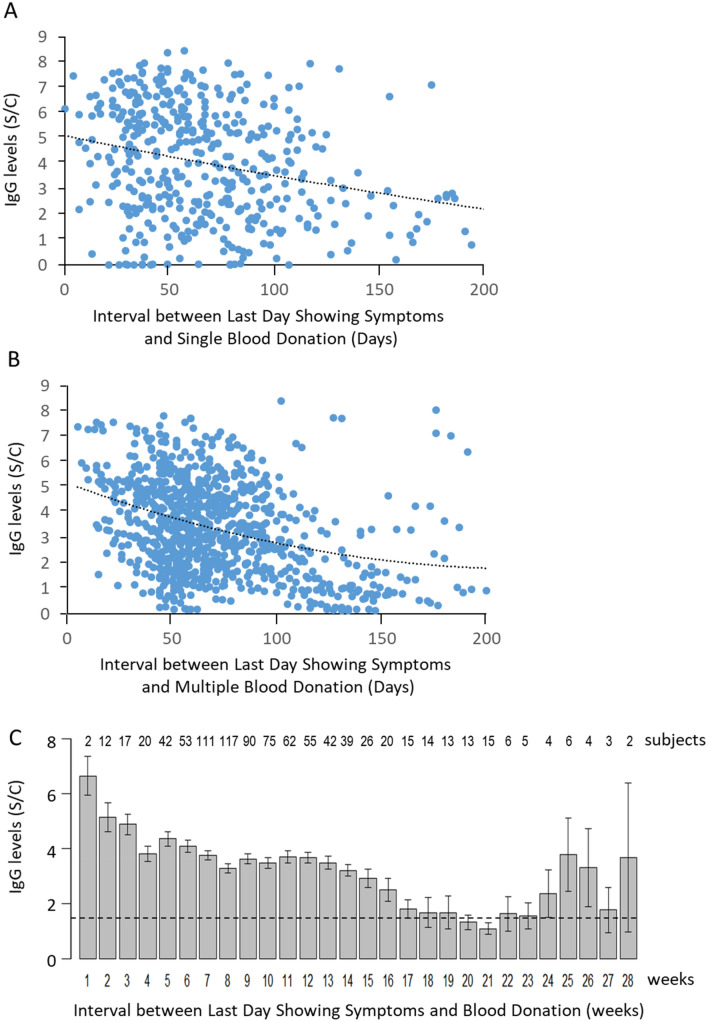
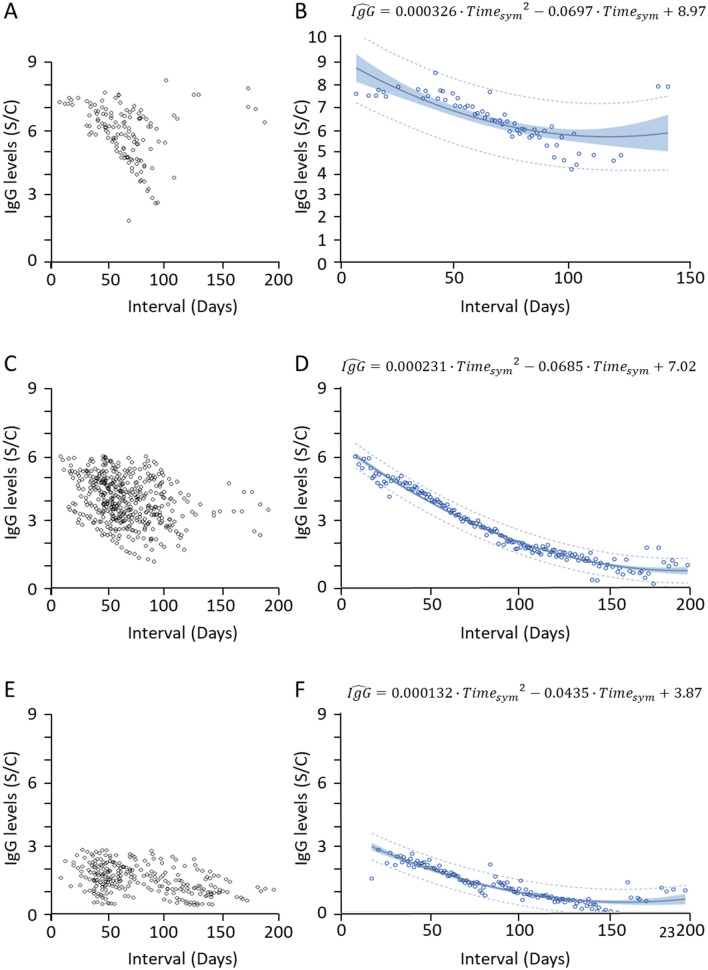
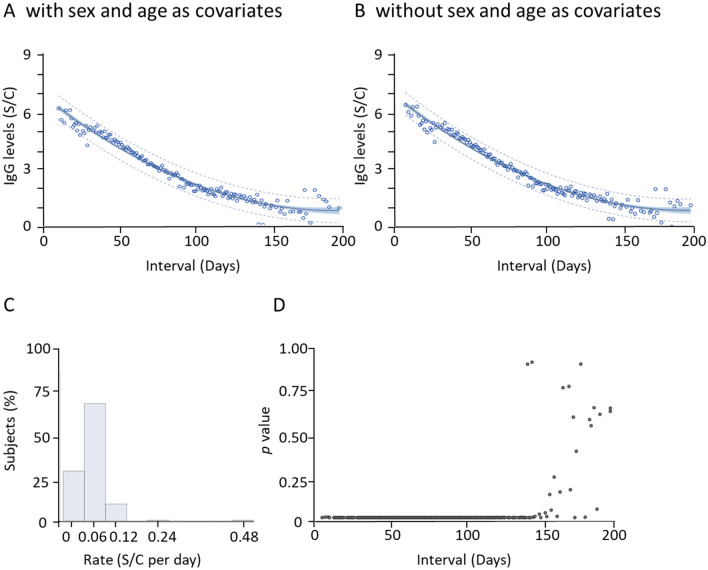
Determining the sustainability of antibodies targeting severe acute respiratory syndrome coronavirus 2 (SARS-CoV-2) is essential for predicting immune response against the Coronavirus disease 2019 (COVID-19). To quantify the antibody decay rates among the varying levels of anti-nucleocapsid (anti-N) Immunoglobulin G (IgG) in convalescent COVID-19 patients and estimate the length of time they maintained SARS-CoV-2 specific antibodies, we have collected longitudinal blood samples from 943 patients over the course of seven months after their initial detection of SARS-CoV-2 virus by RT-PCR. Anti-N IgG levels were then quantified in these blood samples. The primary study outcome was the comparison of antibody decay rates from convalescent patients with high or low initial levels of antibodies using a mixed linear model. Additional measures include the length of time that patients maintain sustainable levels of anti-N IgG. Antibody quantification of blood samples donated by the same subject multiple times shows a gradual decrease of IgG levels to the cutoff index level of 1.4 signal/cut-off (S/C) on the Abbott Architect SARS-CoV-2 IgG test. In addition, this study shows that antibody reduction rate is dependent on initial IgG levels, and patients with initial IgG levels above 3 S/C show a significant 1.68-fold faster reduction rate compared to those with initial IgG levels below 3 S/C. For a majority of the donors naturally occurring anti-N antibodies were detected above the threshold for only four months after infection with SARS-CoV-2. This study is clinically important for the prediction of immune response capacity in COVID-19 patients.


Conflict of interest statement

GRC is an employee of MRN Diagnostics and associates with Mayo Clinic Expanded Access Program (EAP) for collection of convalescent plasma through their nonprofit blood bank Innovative Transfusion Medicine. Other authors have declared that no competing interests exist.

Figures

Figure 1
Figure 1
Distribution of COVID-19 patients with multiple blood donation. (A) Distribution of the number of blood donations from COVID-19 patients. (B) Distribution of patients with their last days showing COVID-19 symptoms. (C) Distribution of the time interval between the last day showing symptoms and the latest day of blood donation.
Figure 2
Figure 2
Reduction of average anti-N IgG levels in blood donated by COVID-19 positive subjects. (A) Anti-N IgG levels from subjects who donated blood once within 200 days after the last day showing symptoms illustrated a time-dependent decay. (B) All records of anti-N IgG levels in subjects who donated blood two or more times within 200 days after the last day showing symptoms are illustrated. Dotted lines represent the second order polynomial fitting curve. (C) The average anti-N IgG levels from blood samples donated within each week after the last day showing symptoms were calculated. The IgG levels were above 6 S/C at the first week and dropped to ~ 1.4 S/C at the 17th weeks. The dotted line represents the Abbott Architect positive/negative antibody threshold level at 1.4 S/C. Bars represent the standard error of means.
Figure 3
Figure 3
Antibody decay rates in subjects with variable anti-N IgG levels. (A) Distribution of anti-N IgG levels from subjects whose first donation of blood carried high levels of IgG (above 6 S/C). (B) Estimated mean anti-N IgG levels at each time point from the mixed model estimation. (C) Distribution of anti-N IgG levels from subjects whose first donation of blood carried medium levels of IgG (between 3 and 6 S/C). (D) Estimated mean anti-N IgG levels at each time point from the mixed model estimation. (E) Distribution of anti-N IgG levels from subjects whose first donation of blood carried low levels of IgG (below 3 S/C). (F) Estimated mean anti-N IgG levels at each time point from the mixed model estimation. Each dot represents the estimated IgG level at that time point. In (B, D, F) the solid curve line is the estimated fitting model. The blue shaded band shows the 95% confidence interval for the IgG level, and the dashed band shows the 95% prediction interval for the IgG level with this model.
Figure 4
Figure 4
Antibody decay for 4 months after last day showing symptoms. (A) Mean anti-N IgG levels were calculated at each time point from the mixed model estimation with sex and age as covariates. Each dot represents the estimated IgG level at that time point. The solid curve line is the estimated fitting model. The blue shaded band shows the 95% confidence interval for the IgG level, and the dashed band shows the 95% prediction interval for the IgG level with this model. (B) Mean anti-N IgG levels were calculated at each time point from the mixed model estimation without sex and age as covariates. (C) Distribution of overall decline rates from all patients. The rate was defined as the difference between the first- and last-day anti-N IgG levels divided by the time interval. (D) The variation of anti-N IgG levels at individual time points from day five to day 200 since the last day showing symptoms was calculated. Due to the multiple simultaneous comparisons, Bonferroni adjustment was used to plot the p values against time intervals, and high variation of IgG levels was observed after 120 days.

References

    1. Nie X, et al. Multi-organ proteomic landscape of COVID-19 autopsies. Cell. 2021 doi: 10.1016/j.cell.2021.01.004. - DOI - PMC - PubMed
    1. Xiang F, et al. Antibody detection and dynamic characteristics in patients with coronavirus disease 2019. Clin. Infect. Dis. 2020;71:1930–1934. doi: 10.1093/cid/ciaa461. - DOI - PMC - PubMed
    1. Long Q-X, et al. Antibody responses to SARS-CoV-2 in patients with COVID-19. Nat. Med. 2020;26:845–848. doi: 10.1038/s41591-020-0897-1. - DOI - PubMed
    1. Padoan A, et al. IgA-Ab response to spike glycoprotein of SARS-CoV-2 in patients with COVID-19: A longitudinal study. Clin. Chim. Acta. 2020;507:164–166. doi: 10.1016/j.cca.2020.04.026. - DOI - PMC - PubMed
    1. Chen Y, et al. Quick COVID-19 healers sustain anti-SARS-CoV-2 antibody production. Cell. 2020;183:1496–1507.e1416. doi: 10.1016/j.cell.2020.10.051. - DOI - PMC - PubMed

Publication types