. 2021 Aug 18;4(1):979.
doi: 10.1038/s42003-021-02509-z.

Species diversity and food web structure jointly shape natural biological control in agricultural landscapes

Affiliations

Species diversity and food web structure jointly shape natural biological control in agricultural landscapes

Fan Yang et al. Commun Biol. .

Abstract

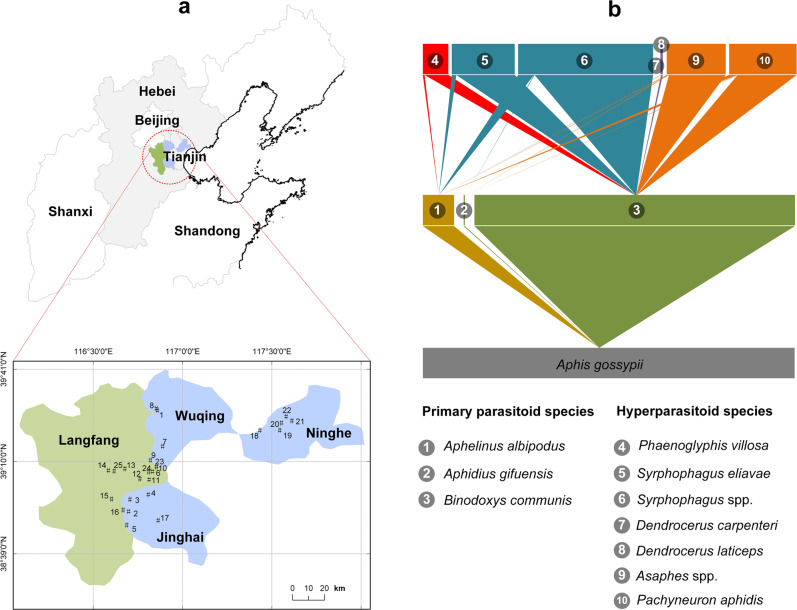
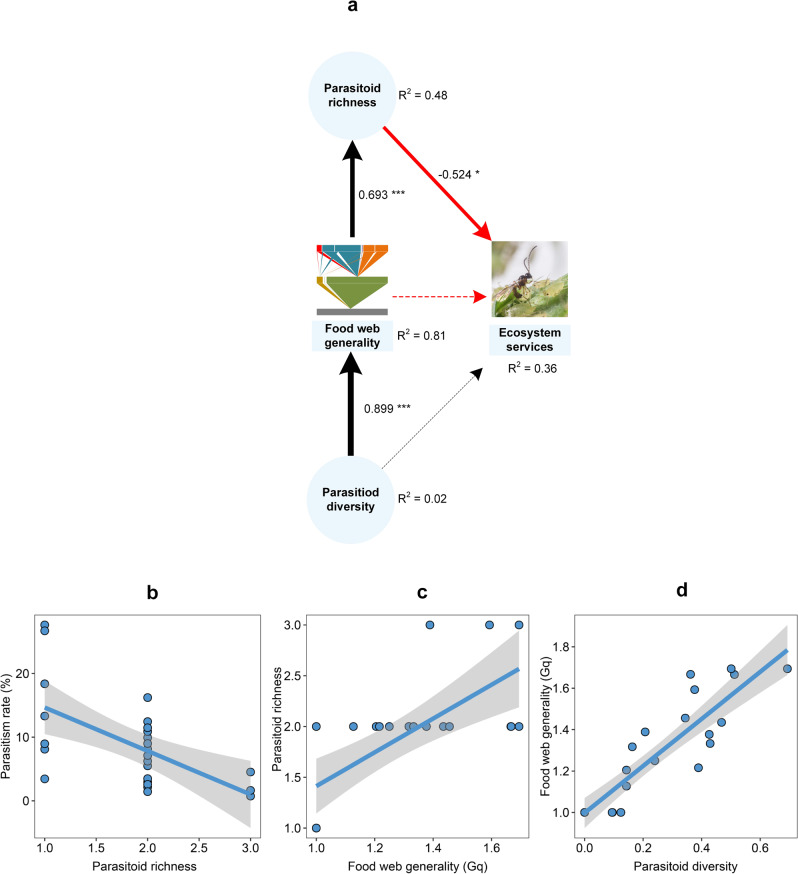
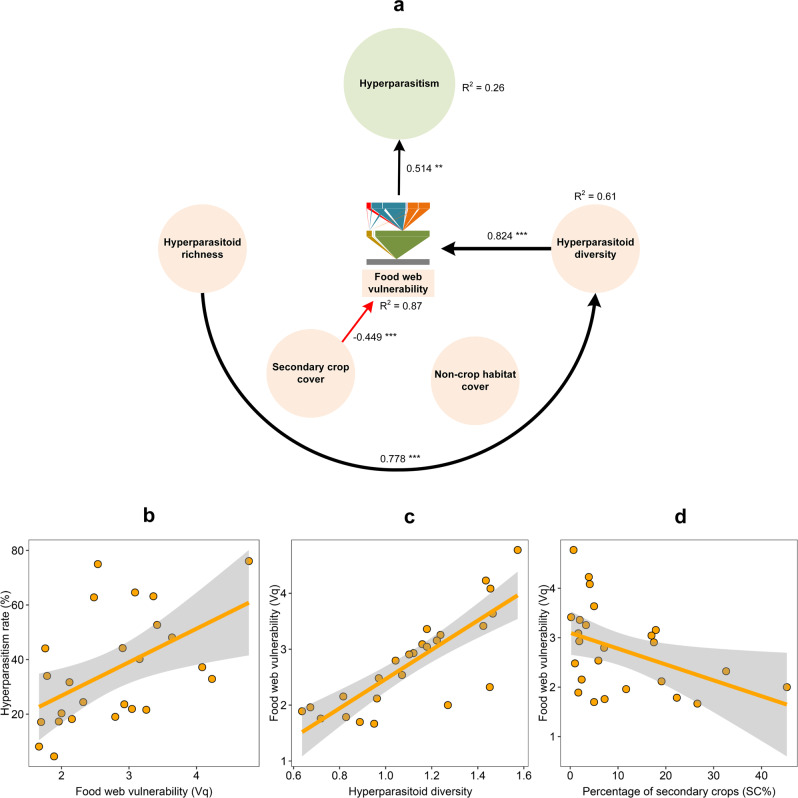
Land-use change and agricultural intensification concurrently impact natural enemy (e.g., parasitoid) communities and their associated ecosystem services (ESs), i.e., biological pest control. However, the extent to which (on-farm) parasitoid diversity and food webs mediate landscape-level influences on biological control remains poorly understood. Here, drawing upon a 3-year study of quantitative parasitoid-hyperparasitoid trophic networks from 25 different agro-landscapes, we assess the cascading effects of landscape composition, species diversity and trophic network structure on ecosystem functionality (i.e., parasitism, hyperparasitism). Path analysis further reveals cascaded effects leading to biological control of a resident crop pest, i.e., Aphis gossypii. Functionality is dictated by (hyper)parasitoid diversity, with its effects modulated by food web generality and vulnerability. Non-crop habitat cover directly benefits biological control, whereas secondary crop cover indirectly lowers hyperparasitism. Our work underscores a need to simultaneously account for on-farm biodiversity and trophic interactions when investigating ESs within dynamic agro-landscapes.


Conflict of interest statement

The authors declare no competing interests.

Figures

Fig. 1
Fig. 1. Geographic distribution of study sites in northern China and aphid-primary-hyperparasitoid tri-trophic food web.
From 2014 to 2016, a total of 25 sites were identified across four geographic regions in northern China (a). b Diagrams the overall quantitative food webs including three trophic levels, with the lowest level (gray bar) comprising herbivorous hosts, i.e., the cotton aphid Aphis gossypii. Species numbered 1–3 are the primary parasitoids (middle trophic level): Aphelinus albipodus, Aphidius gifuensis and Binodoxys communis; and 4–10 are the hyperparasitoid species (upper trophic level): Phaenoglyphis villosa, Syrphophagus eliavae, Syrphophagus spp., Dendrocerus carpenteri, Dendrocerus laticeps, Asaphes spp., Pachyneuron aphidis. Species that are marked with the same color belong to the same family. The width of a given triangle reflects the relative proportion of linkage effects.
Fig. 2
Fig. 2. Causal paths between the ecosystem service (ES) of biological control and different predictors.
In the SEM analysis, ES is the ultimate response variable, while parasitoid richness, parasitoid diversity and food web generality (Gq) are both predictors and response variables. The paths reveal both direct and indirect relationships between individual predictors and response variables. a Shows the paths after removing non-crop habitat (NCH). Standardized coefficients are shown for each path and scaled as line width. Black and red lines indicate either positive or negative relationships, with solid lines representing statistically significant effects and dotted lines showing nonsignificant effects (*P < 0.05; **P < 0.01; ***P < 0.001). R2 shows the explanatory proportion of the total variance for each response variable in the model (Supplementary Table 11). bd Show significant relationships based on SEM analysis, with solid lines and shaded zones indicative of the regression lines and 95% confidence intervals (n = 25), respectively.
Fig. 3
Fig. 3. Causal paths between the ecosystem disservice (EDS) of hyperparasitism and different predictors.
In the SEM analysis, EDS is the ultimate response variable, while hyperparasitoid richness and diversity and food web vulnerability (Vq) are both predictors and response variables. Non-crop habitat (NCH) and secondary crop cover (SC) are exogenous variables. The paths reveal both direct and indirect cascading relationships between predictors and response variables. a Shows the paths after removing all nonsignificant paths. Standardized coefficients are shown for each path and scaled as line width. Black and red lines indicate either positive or negative relationships, with solid lines representing significant effects and dotted lines showing nonsignificant effects (*P < 0.05; **P < 0.01; ***P < 0.001). R2 shows the explanatory proportion of the total variance for each response variable in the model (Supplementary Table 12). bd Show the significant relationships based on SEM analysis, with solid lines and shaded zones indicative of regression lines and 95% confidence intervals (n = 25), respectively.

References

    1. van der Plas F. Biodiversity and ecosystem functioning in naturally assembled communities. Biol. Rev. 2019;94:1220–1245. - PubMed
    1. Lefcheck JS, et al. Biodiversity enhances ecosystem multifunctionality across trophic levels and habitats. Nat. Commun. 2015;6:6936. doi: 10.1038/ncomms7936. - DOI - PMC - PubMed
    1. Fanin N, et al. Consistent effects of biodiversity loss on multifunctionality across contrasting ecosystems. Nat. Ecol. Evol. 2018;2:269–278. doi: 10.1038/s41559-017-0415-0. - DOI - PubMed
    1. Isbell F, et al. Linking the influence and dependence of people on biodiversity across scales. Nature. 2017;546:65–72. doi: 10.1038/nature22899. - DOI - PMC - PubMed
    1. Sánchez-Bayo F, Wyckhuys KAG. Worldwide decline of the entomofauna: A review of its drivers. Biol. Conserv. 2019;232:8–27. doi: 10.1016/j.biocon.2019.01.020. - DOI

Publication types