. 2021 Aug 18;4(1):981.
doi: 10.1038/s42003-021-02512-4.

The endosomal Q-SNARE, Syntaxin 7, defines a rapidly replenishing synaptic vesicle recycling pool in hippocampal neurons

Affiliations

The endosomal Q-SNARE, Syntaxin 7, defines a rapidly replenishing synaptic vesicle recycling pool in hippocampal neurons

Yasunori Mori et al. Commun Biol. .

Abstract

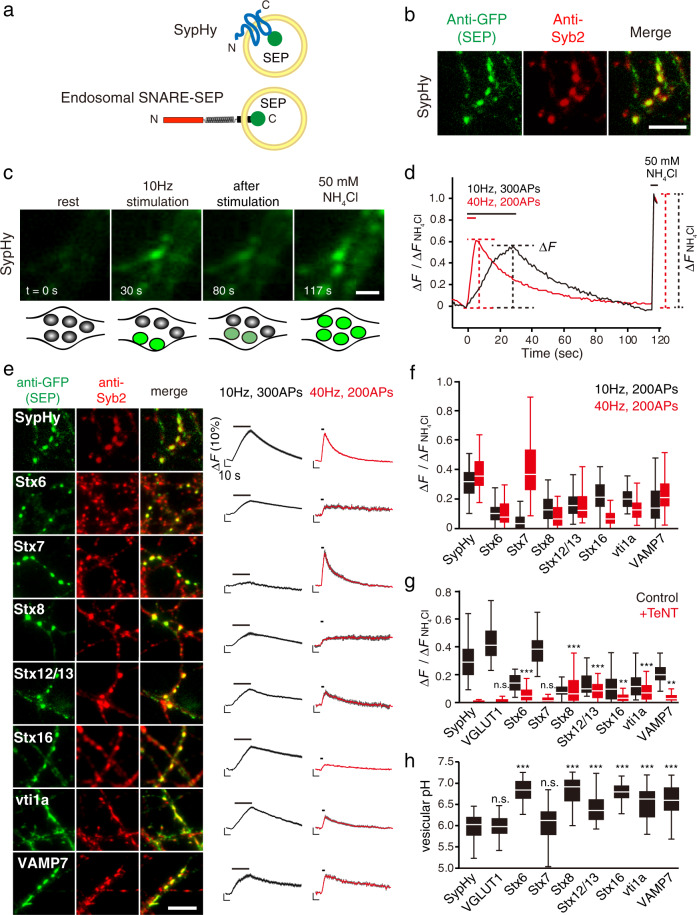
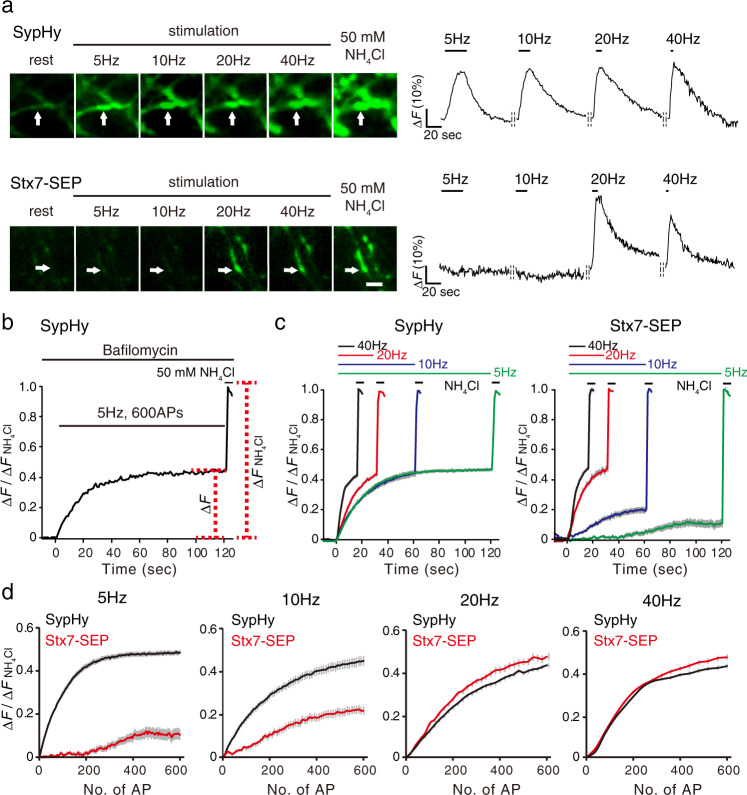
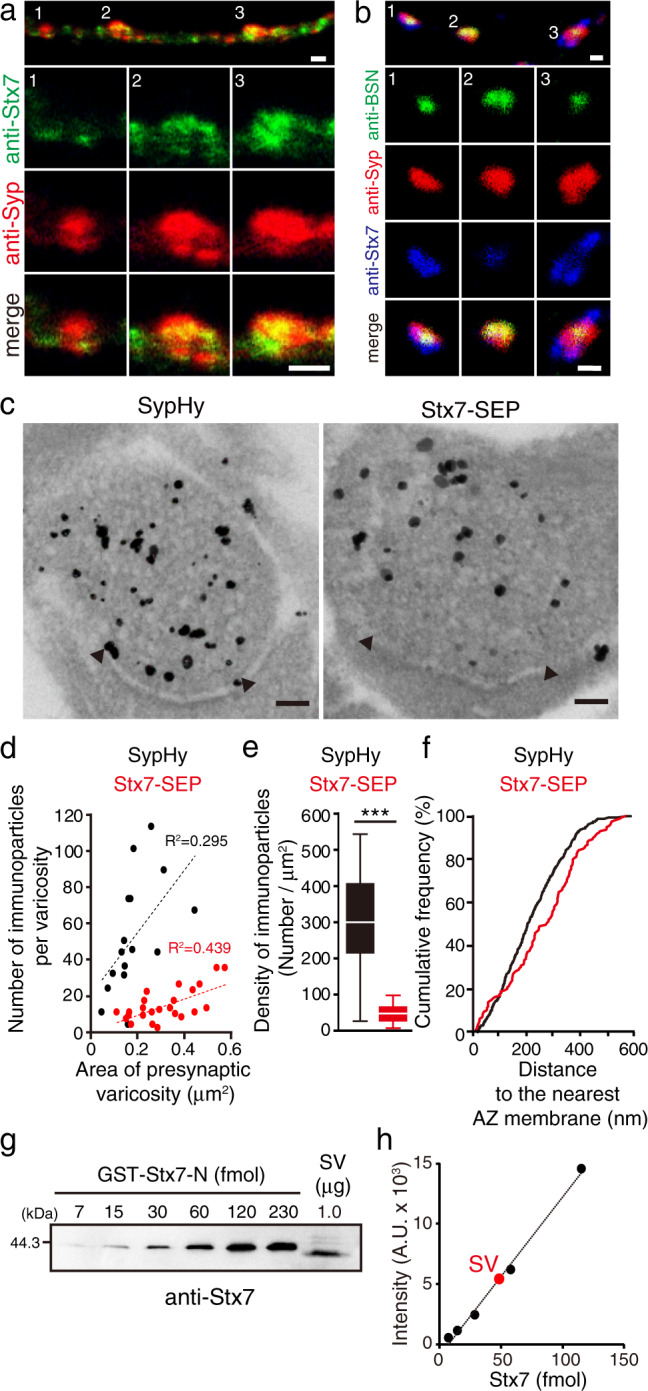
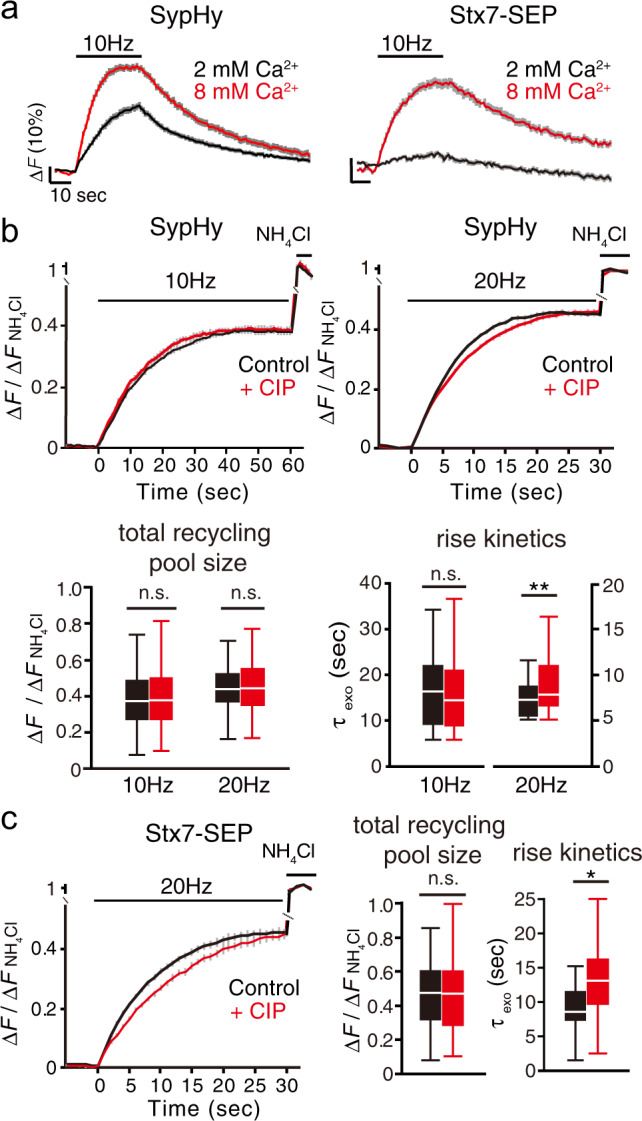
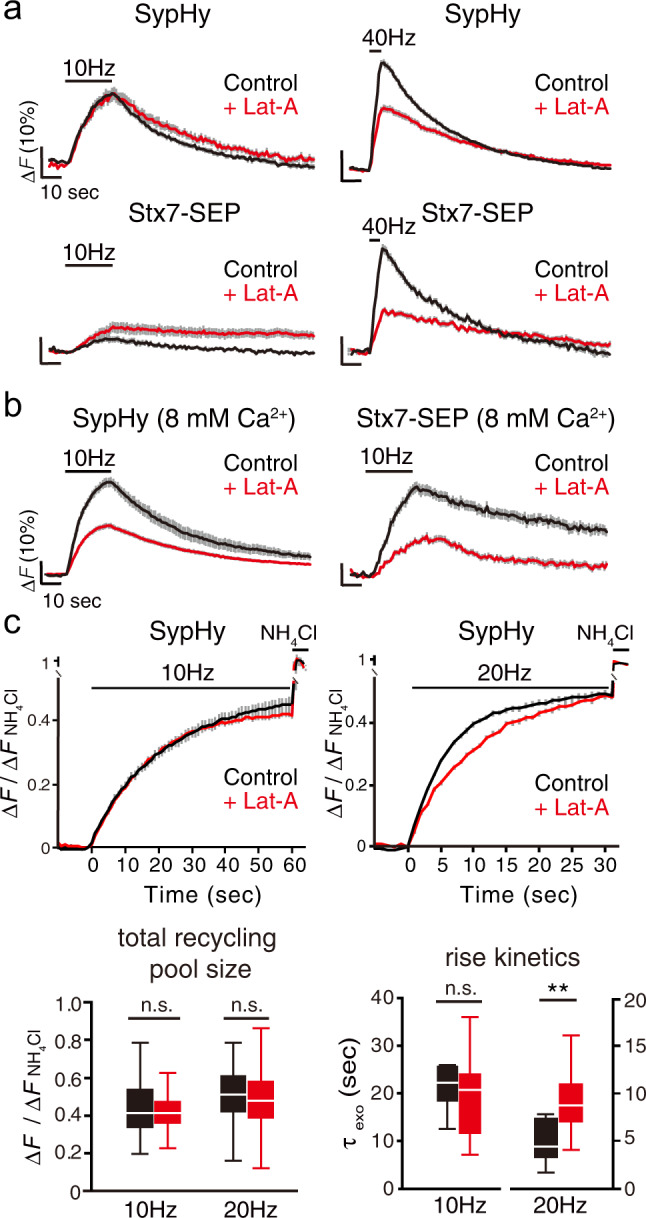
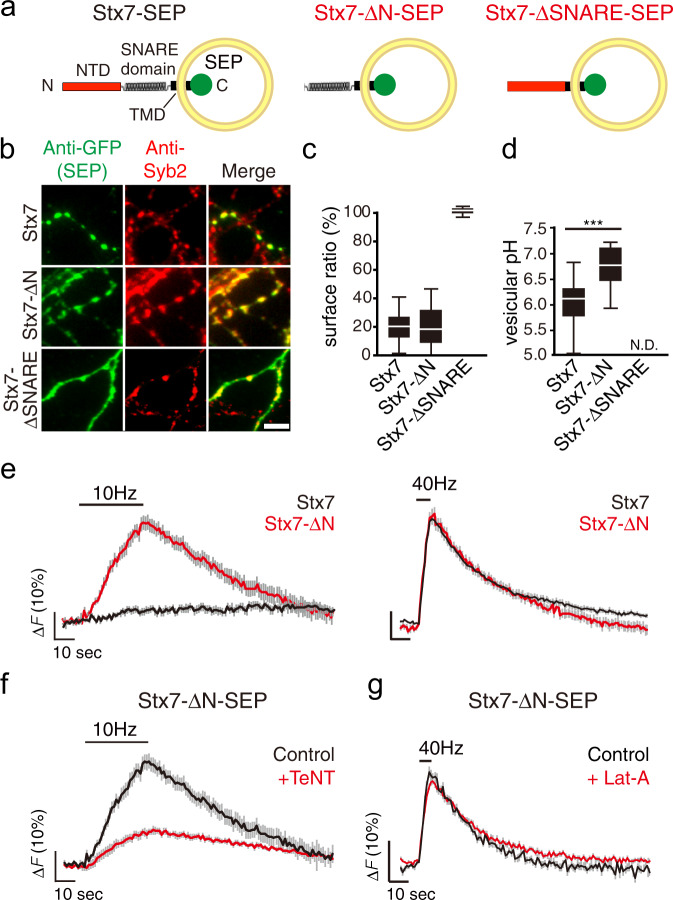
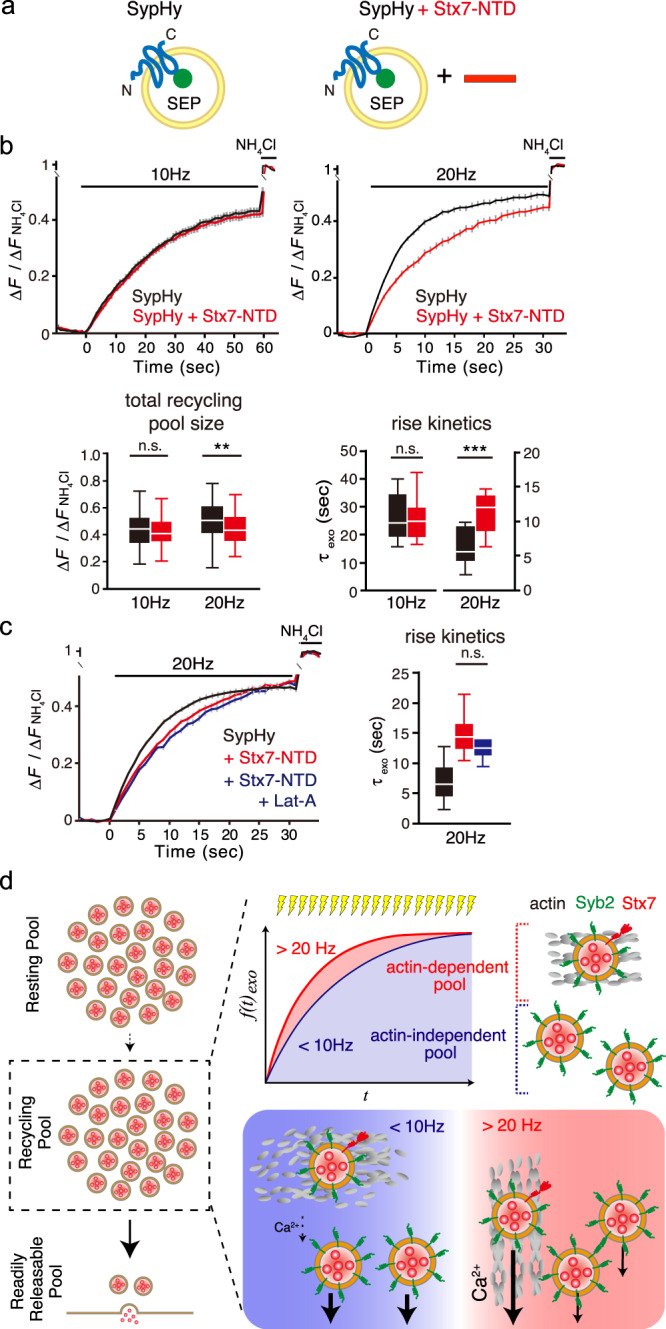
Upon the arrival of repetitive stimulation at the presynaptic terminals of neurons, replenishment of readily releasable synaptic vesicles (SVs) with vesicles in the recycling pool is important for sustained neurotransmitter release. Kinetics of replenishment and the available pool size define synaptic performance. However, whether all SVs in the recycling pool are recruited for release with equal probability and speed is unknown. Here, based on comprehensive optical imaging of various presynaptic endosomal SNARE proteins in cultured hippocampal neurons, all of which are implicated in organellar membrane fusion in non-neuronal cells, we show that part of the recycling pool bearing the endosomal Q-SNARE, syntaxin 7 (Stx7), is preferentially mobilized for release during high-frequency repetitive stimulation. Recruitment of the SV pool marked with an Stx7-reporter requires actin polymerization, as well as activation of the Ca2+/calmodulin signaling pathway, reminiscent of rapidly replenishing SVs characterized previously in calyx of Held synapses. Furthermore, disruption of Stx7 function by overexpressing its N-terminal domain selectively abolished this pool. Thus, our data indicate that endosomal membrane fusion involving Stx7 forms rapidly replenishing vesicles essential for synaptic responses to high-frequency repetitive stimulation, and also highlight functional diversities of endosomal SNAREs in generating distinct exocytic vesicles in the presynaptic terminals.


Conflict of interest statement

The authors declare no competing interests.

Figures

Fig. 1
Fig. 1. Comprehensive monitoring of presynaptic endosomal SNARE-SEPs reveals their characteristic recycling behavior.
a Cartoon representation of SypHy (Synaptophysin-SEP) and an endosomal-SNARE-SEP. b-d Strategies for comprehensive characterization of presynaptic SNARE-SEPs. After SEP constructs were lentivirally transduced in cultured hippocampal neurons, distributions of SEP-fused proteins and their responses to repetitive electrical stimulation were analyzed by immunocytochemistry (b) and fluorescence live imaging (c, d). Representative results obtained for SypHy are shown. The SEP was visualized with anti-GFP antibody, whereas locations of presynaptic boutons were identified with anti-synaptobrevin 2 (Syb2) antibody. To estimate fractional responses of each SEP construct, 50 mM NH4Cl (pH7.4) was applied at the end of recordings, which revealed the total expression of SEP-fused proteins at individual boutons. Scale bars indicate 5 µm in (b) and 2 µm in (c). e Synaptic localization and stimulus-dependent recycling of endosomal SNARE-SEPs upon 10 Hz or 40 Hz stimulation. Left images are representative images of each SEP-fused protein, co-stained with anti-Syb2 antibody. Scale bar indicates 5 μm. Right traces show average fluorescence of individual SEP-fused proteins upon 10 Hz (300 APs; black) and 40 Hz (200 APs; red) stimulation. Fluorescence was normalized to those during NH4Cl application. Data are averages of 50−200 boutons. f A box-whisker plot showing the peak fluorescence of the respective SEP probes at 200APs of 10 Hz (black) and 40 Hz stimulation (red). The boxes, the white lines in the boxes, and the whiskers in this plot and hereafter indicate the first and third quartiles, the medians, and the minimum and maximum values, respectively. g A box-whisker plot showing the effect of TeNT pretreatment on recycling of SEP probes in comparison to SypHy at 40 Hz stimulation (200 APs) (see also Supplementary Fig. 2). Data were obtained from 35−100 boutons. P-values indicate n.s p > 0.05, ** p < 0.01, and *** p < 0.001 in comparison to SypHy after TeNT treatment (Student’s t-test). h A box-whisker plot showing luminal pHs of vesicle compartments carrying the respective SEP probes calculated from experiments in Supplementary Fig. 3. *** p < 0.001 indicates p-values in comparison to vesicular pH of SypHy (Student’s t-test).
Fig. 2
Fig. 2. Stx7-SEP-vesicles recycle preferentially upon HFS.
a Stimulus-frequency-dependent responses of Stx7-SEP in comparison to SypHy. Neurons expressing respective SEP fusion constructs were subjected to sequential stimulation ranging from 5 to 40 Hz (200 APs) at 5 min intervals. Left images are representative images of SypHy (top), Stx7-SEP (bottom) at rest, at the end of stimulation at 5, 10, 20, and 40 Hz, and upon application of NH4Cl at the end of recordings. Right traces show representative traces of each SEP-fluorescence change in boutons, indicated by arrows. Data were normalized to fluorescence signals upon application of NH4Cl at the end of recordings. b Experimental scheme to estimate the kinetics of exocytosis, as well as sizes of total recycling SV pools. Neurons were pretreated with 2 µM bafilomycin A1 for 60 s and then stimulated with 600 APs at different stimulation frequencies. After cessation of stimulation, 50 mM NH4Cl was applied and fluorescence during NH4Cl application was used to normalized fluorescence signals at individual boutons. c Recycling pool of SypHy and Stx7-SEP. Cells expressing SypHy (left) and Stx7-SEP (right) were stimulated with 600 APs at different frequencies (5, 10, 20, and 40 Hz). d Replots of SypHy (black) and Stx7-SEP (red) responses of the results in (c) as a function of stimulus numbers (No. of AP).
Fig. 3
Fig. 3. Stx7 localizes to a subpopulation of SVs at presynaptic terminals.
a Double immunostaining of Stx7 and Syp in cultured hippocampal neurons at 14 DIV. An upper panel shows representative axonal localization of Stx7 (green) and Syp (red). Magnified images of numbered areas (1−3) are shown individually below. The specificity of the Stx7 antibody was confirmed in independent experiments where Stx7 expression level was reduced by specific shRNA (Supplementary Fig. 14b). Scale bars indicate 2 µm. b Triple-immunofluorescence for Stx7 (blue), Syp (red), and an active zone maker Bassoon (BSN, green). An upper panel shows representative images. Magnified images of the numbered areas (1−3) are shown below. Scale bars indicate 1 µm. c Immunoelectron micrographs of SypHy (left) and Stx7-SEP (right) at presynaptic terminals. Immunogold labeling was intensified by silver enhancement. Arrowheads indicate both edges of the active zone deduced from postsynaptic density structures. Scale bars indicate 100 nm. d Number of immunoparticles as a function of the area of presynaptic varicosity. Sixteen varicosities for SypHy (black) and 24 varicosities for Stx7-SEP (red) were analyzed. e A box-whisker plot showing densities of SypHy immunoparticles (black) and Stx7-SEP immunoparticles (red) calculated from (d). p < 0.0001 with unpaired t-test with Welch’s correction. f A cumulative plot of distances of immunoparticles to the nearest AZ membrane. Note that vertical lines from the edges of AZs were drawn manually, and only immunoparticles inside the enclosed areas were measured for the analysis (Supplementary Fig. 9). Statistical significance was evaluated with Kolmogorov−Smirnov test (p = 0.0003). g A representative quantification of Stx7 in native SVs purified from rat brains. Various amounts of recombinant GST-Stx7-N-terminal domain (GST-Stx7-N) and a fixed amount of purified SV fraction (vesicle concentration, 26.7 nM; protein concentration, 99.7 ng/μL) were subjected to quantitative western blot analysis (see also Supplementary Fig. 10 for complete datasets and control experiments for Syb2). h Signal intensities of bands were quantified and plotted as a function of moles of GST-Stx7-N. A red circle indicates the signal intensity measured for 1.0 µg SV shown in (g).
Fig. 4
Fig. 4. Fast recruitment of Stx7-vesicles is mediated by activation of the Ca2+/calmodulin pathway.
a Responses of Stx7-SEP (right) in the presence of normal (2 mM, black) and high (8 mM, red) external Ca2+. For comparison, responses of SypHy under identical conditions are shown in the left panel. b Effects of CIP (red) on exocytosis of total recycling pool monitored by SypHy. Responses at 10 Hz, 600APs (left) and 20 Hz, 600APs (right) with bafilomycin treatment are shown. Control experiments without CIP in respective conditions are shown in black. Bottom box-whisker plots show quantitative comparisons of total recycling pool sizes and rise kinetics. Normalized fluorescence peaks (left) or the time constants of rise time (τexo) (right) during 10 Hz or 20 Hz stimulation are compared. c Effects of CIP (red) on exocytosis of the total recycling pool monitored by Stx7-SEP. Responses at 20 Hz, 600APs (left) with bafilomycin treatment are shown. Control experiments without CIP in the respective conditions are shown in black. Right box-whisker plots show quantitative comparisons of total recycling pool sizes and rise kinetics. Normalized fluorescence peaks (left) or the time constants of rise time (τexo) (right) during 20 Hz stimulation are compared. All traces are average traces from >150 boutons.
Fig. 5
Fig. 5. Recruitment of Stx7-vesicles requires actin polymerization.
a Effects of latrunculin A (Lat-A, 5 µM; red) on responses of SypHy (upper traces) and of Stx7-SEP (lower traces) elicited by 10 Hz (left) and 40 Hz (right) stimulation. Control experiments without Lat-A in the respective conditions are shown in black. b Effects of Lat-A (red traces) on recycling of SypHy and Stx7-SEP in the presence of 8 mM external Ca2+. Control experiments without Lat-A in the respective conditions are shown in black. c Effects of Lat-A (red) on exocytosis of total recycling pool monitored by SypHy. Responses at 10 Hz, 600APs (left) and 20 Hz, 600APs (right) with bafilomycin treatment are shown. Control experiments without Lat-A in the respective conditions are shown in black. Bottom box-whisker plots show quantitative comparisons of total recycling pool sizes and rise kinetics. Normalized fluorescence peaks (left) or the time constants of rise time (τexo) (right) during the 10 Hz or 20 Hz stimulation are compared. All traces are average traces from 50 to 150 boutons.
Fig. 6
Fig. 6. The N-terminal domain of Stx7 is responsible for proper sorting of Stx7 to a subset of recycling SVs.
a Schematic diagram of full length Stx7-SEP, Stx7-SEP lacking the N-terminal domain (Stx7-ΔN-SEP), and Stx7-SEP lacking SNARE motif (Stx7-ΔSNARE-SEP). b Distribution of Stx7-SEP, Stx7-ΔN-SEP, and Stx7-Δ-SNARE-SEP in transfected neurons. Box-whisker plots showing the surface fraction of Stx7-SEP and truncated mutants (c) and vesicular pHs of vesicles carrying respective SEPs (d). Note that vesicular pH of Stx7-ΔSNARE-SEP could not be calculated, since it was exclusively expressed at the cell surface (N.D. indicates ‘not determined’). e Responses of Stx7-SEP (black traces) and Stx7-ΔN-SEP (red traces) upon 10 Hz (left panels) and 40 Hz stimulation (right panels). f Responses of Stx7-ΔN-SEP upon 10-Hz stimulation in control (black) and after TeNT treatment (red). g Responses of Stx7-ΔN-SEP upon 40 Hz stimulation in control (black) and after Lat-A treatment (red).
Fig. 7
Fig. 7. Overexpression of Stx7-NTD slowed SypHy responses only during HFS.
a Schematic diagram of SypHy and SypHy co-expressed with Stx7-NTD. Stx7-NTD was placed after a P2A sequence so that all SypHy-positive cells co-expressed Stx7-NTD. b The total recycling pool monitored by SypHy responses in the absence (black) and presence (red) of Stx7-NTD at 10 Hz, 600APs (left) and 20 Hz, 600APs (right) after bafilomycin treatment. Bottom box-whisker plots show quantification of total recycling pool sizes (left) and time constants of rise time (right, τexo). c Pretreatment with Lat-A did not further reduce release kinetics upon Stx7-NTD overexpression. Responses of SypHy with Stx7-NTD in the presence of Lat-A (blue) were compared with control (SypHy only, black) and SypHy with Stx7-NTD (red) in response to at 20 Hz, 600APs. A box-whisker plot shows time constants of the rise time (τexo). SypHy responses with Stx7-NTD (red) and Stx7-NTD + Lat-A (blue) did not differ significantly (p > 0.05). d Schematic summary of this study, depicting that Stx7 is preferentially present in the rapidly replenishing SV pool during intense, repetitive stimulation.

Similar articles

Cited by

References

    1. Südhof TC. The synaptic vesicle cycle. Annu. Rev. Neurosci. 2004;27:509–547. doi: 10.1146/annurev.neuro.26.041002.131412. - DOI - PubMed
    1. Alabi AA, Tsien RW. Synaptic vesicle pools and dynamics. Cold Spring Harb. Perspect. Biol. 2012;4:a013680. doi: 10.1101/cshperspect.a013680. - DOI - PMC - PubMed
    1. Rizzoli SO, Betz WJ. Synaptic vesicle pools. Nat. Rev. Neurosci. 2005;6:57–69. doi: 10.1038/nrn1583. - DOI - PubMed
    1. Ikeda K, Bekkers JM. Counting the number of releasable synaptic vesicles in a presynaptic terminal. Proc. Natl Acad. Sci. USA. 2009;106:2945–2950. doi: 10.1073/pnas.0811017106. - DOI - PMC - PubMed
    1. Jahn R, Scheller RH. SNAREs-engines for membrane fusion. Nat. Rev. Mol. Cell Biol. 2006;7:631–643. doi: 10.1038/nrm2002. - DOI - PubMed

Publication types

Substances

LinkOut - more resources