. 2021 Sep;597(7876):410-414.
doi: 10.1038/s41586-021-03830-7. Epub 2021 Aug 18.

Neuro-mesenchymal units control ILC2 and obesity via a brain-adipose circuit

Affiliations

Neuro-mesenchymal units control ILC2 and obesity via a brain-adipose circuit

Filipa Cardoso et al. Nature. 2021 Sep.

Abstract

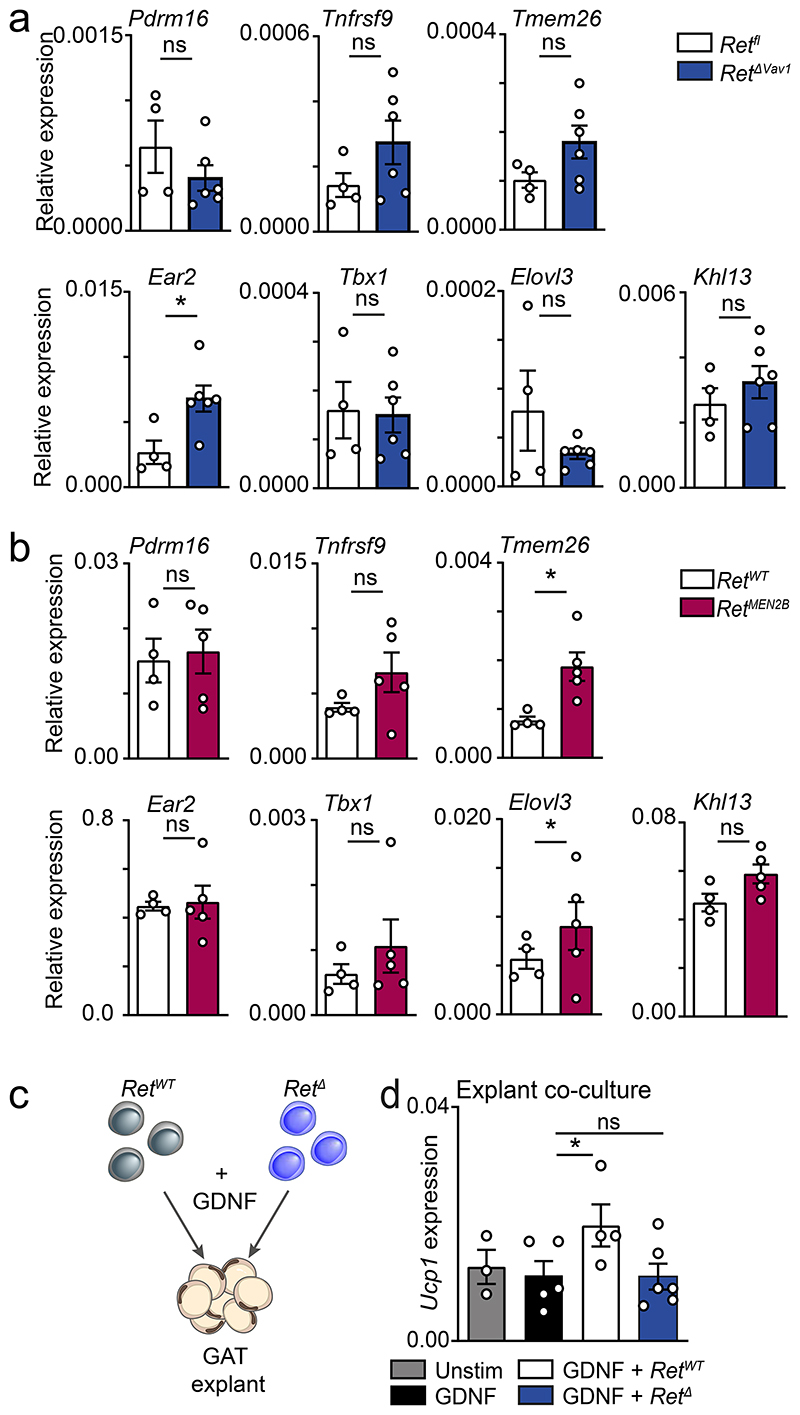
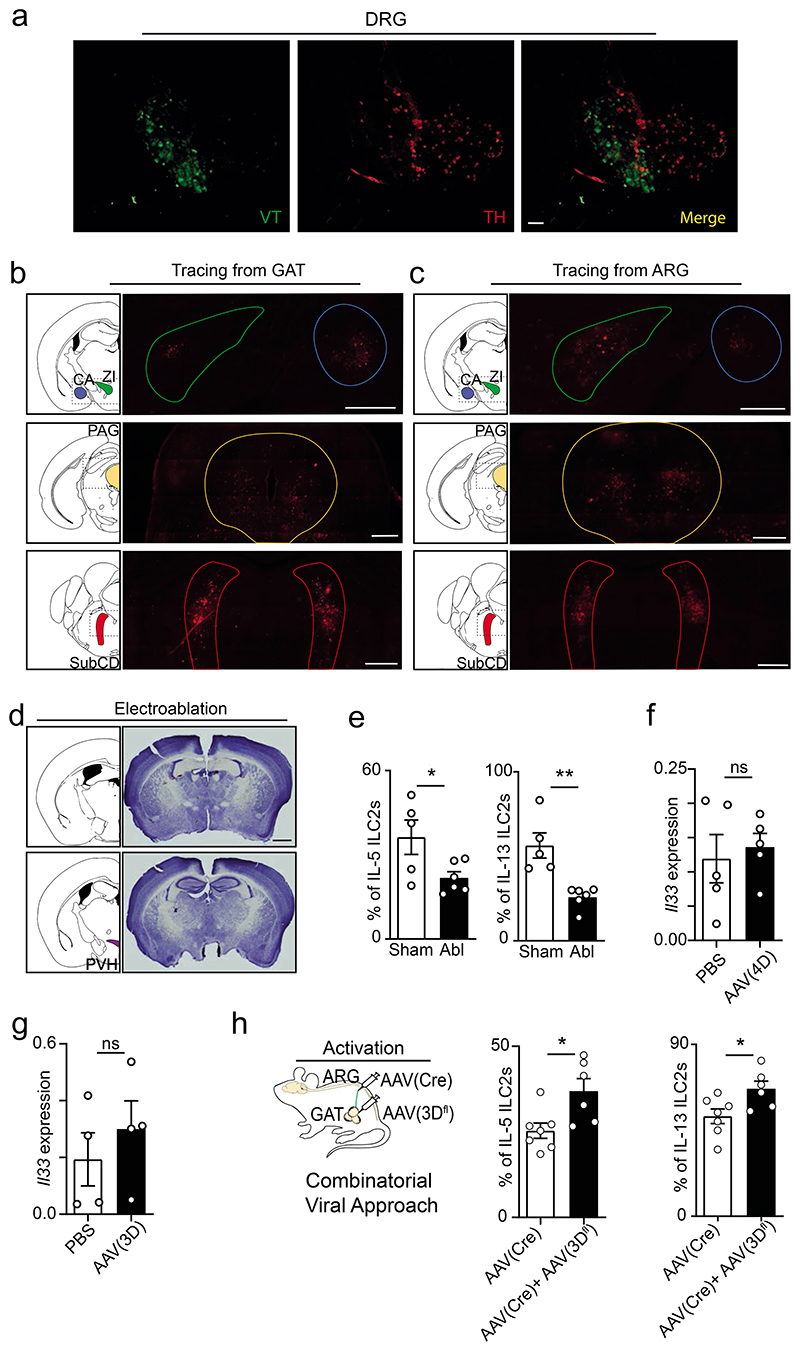
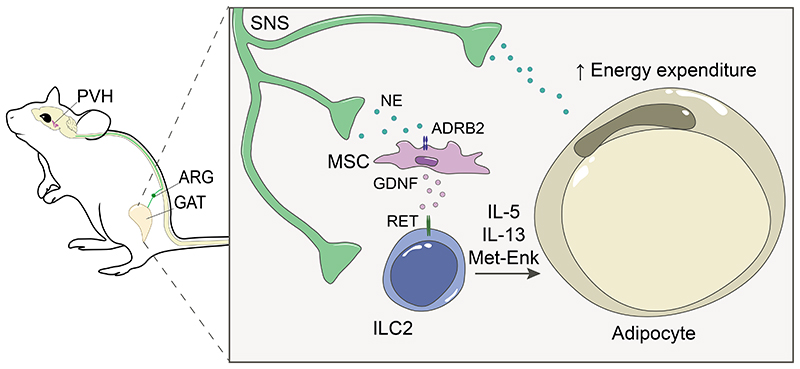
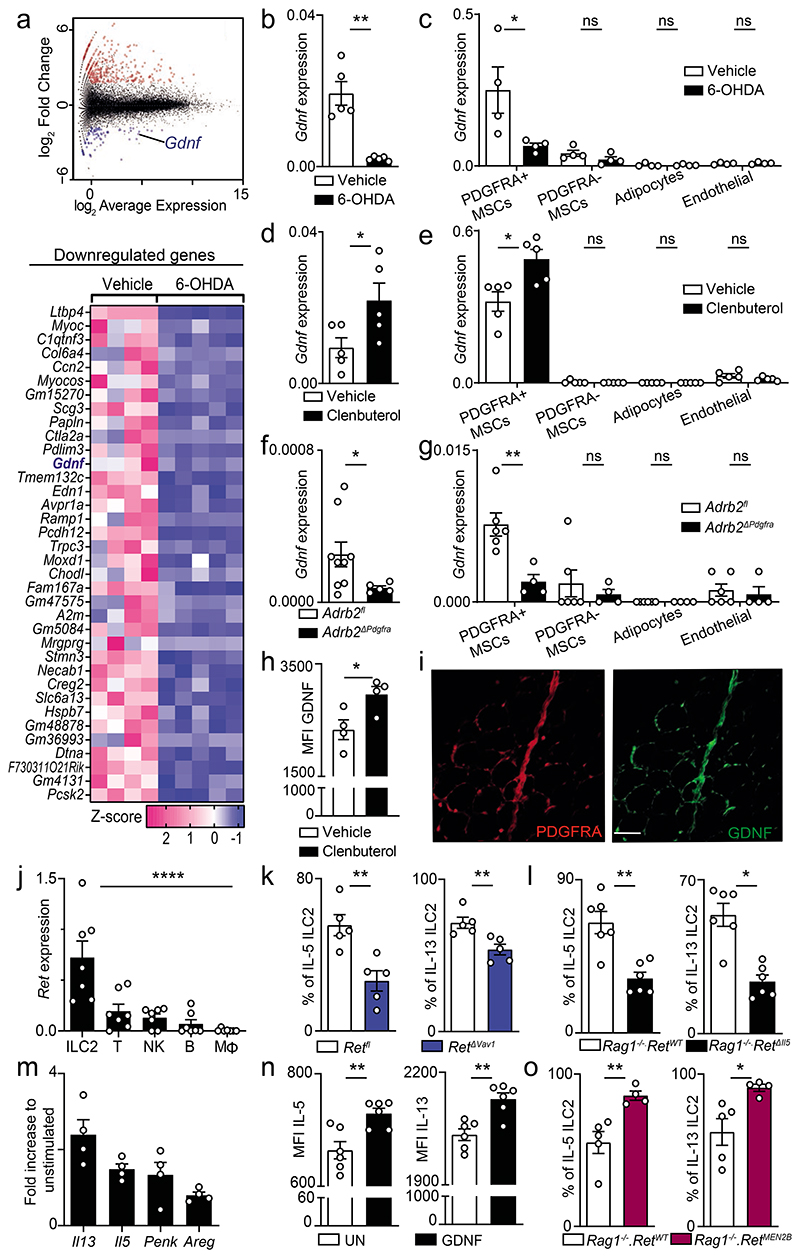
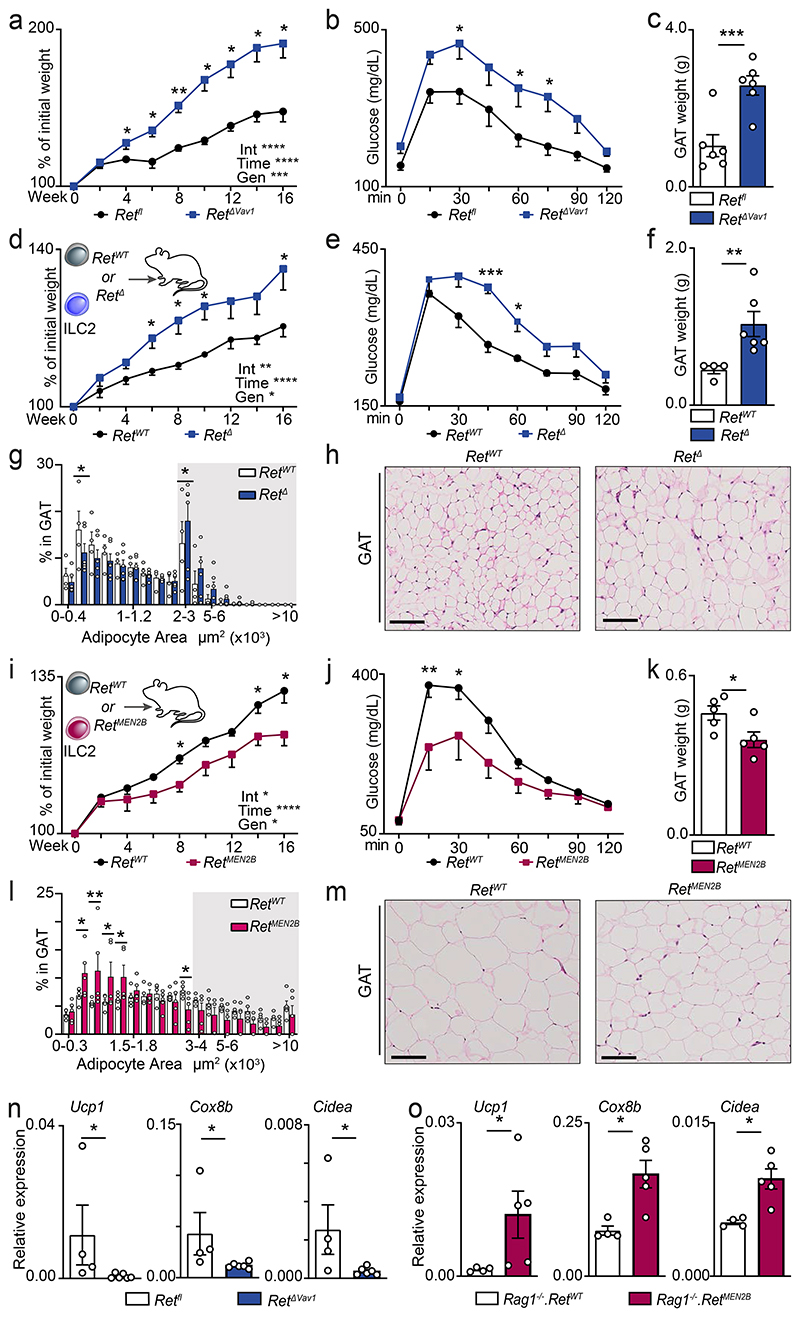
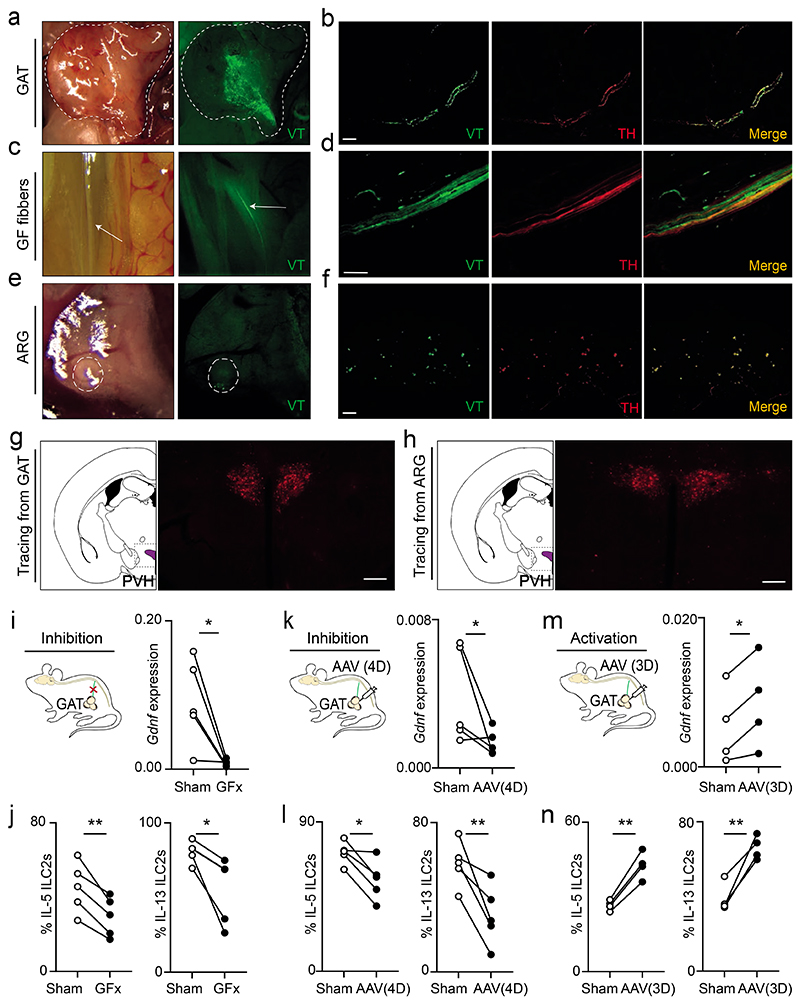
Signals from sympathetic neurons and immune cells regulate adipocytes and thereby contribute to fat tissue biology. Interactions between the nervous and immune systems have recently emerged as important regulators of host defence and inflammation1-4. Nevertheless, it is unclear whether neuronal and immune cells co-operate in brain-body axes to orchestrate metabolism and obesity. Here we describe a neuro-mesenchymal unit that controls group 2 innate lymphoid cells (ILC2s), adipose tissue physiology, metabolism and obesity via a brain-adipose circuit. We found that sympathetic nerve terminals act on neighbouring adipose mesenchymal cells via the β2-adrenergic receptor to control the expression of glial-derived neurotrophic factor (GDNF) and the activity of ILC2s in gonadal fat. Accordingly, ILC2-autonomous manipulation of the GDNF receptor machinery led to alterations in ILC2 function, energy expenditure, insulin resistance and propensity to obesity. Retrograde tracing and chemical, surgical and chemogenetic manipulations identified a sympathetic aorticorenal circuit that modulates ILC2s in gonadal fat and connects to higher-order brain areas, including the paraventricular nucleus of the hypothalamus. Our results identify a neuro-mesenchymal unit that translates cues from long-range neuronal circuitry into adipose-resident ILC2 function, thereby shaping host metabolism and obesity.


Conflict of interest statement

Author information.

Reprints and permissions information is available at http://www.nature.com/ reprints. The authors declare no competing financial interests.

Figures

Extended Data Figure 1
Extended Data Figure 1. Gating strategy for ILC2 and MSC.
a, ILC2s were defined as: live CD45+Lin-Thy1.2+Sca-1+KLRG1+, lineage was composed by CD3ε, CD8α, TCRβ, TCRyδ, CD19, Gr1, CD11c, CD11b and TER119. b, Stroma cells were defined as: live PDGFRA+ MSCs: CD45-CD31-PDGFRA+gp38+SCa-1+, PDGFRA- MSCs: CD45- CD31-PDGFRA-gp38+, and endothelial cells: CD45-CD31+.
Extended Data Figure 2
Extended Data Figure 2. Sympathetic nervous system in the GAT and ILC2 function.
a, GAT. Red: sympathetic nerve fibres (TH). Green: endothelial cells (CD31). Scale bar: 300μm. b, GAT ILC2-derived Met-Enk after 6-OHDA administration. n=5. c, CD4 T cells and TH positive CD4 T cells after 6-OHDA administration. n=4. d,e, Distance covered by mice in the open field test n=3. Scale bar=10cm. f, GAT ILC2-derived Met-Enk after Clenbuterol administration. n=5. g, Heatmap of Adrb1, Adrb2, and Adrb3, read counts (FPKM) on ILC2s, n=4. h, GAT ILC2 after CNO administration. R26/3Dfl n=4, R26Th n=4, and R26/3DTh n=5. i, Heatmap of Adrb1, Adrb2, and Adrb3, read counts (TPM) on MSCs, n=4. j, Gdnf expression after in vitro stimulation of MSCs, n=3. Data are representative of 3 independent experiments. n represents biologically independent animals. Data are presented as mean values and error bars: SEM. Two-tailed unpaired Welch's t-test. *P<0.05; ***P<0.005.
Extended Data Figure 3
Extended Data Figure 3. Sympathetic regulation of GAT MSC.
a, heatmap of upregulated genes in MSC upon 6-OHDA administration. Vehicle n=4, 6-OHDA n=5. b, GAT Il33 expression after 6-OHDA treatment. n=5. c, GAT Il33 expression after Clenbuterol administration. n=5. d, MSC-derived Il33 after 6-OHDA and Clenbuterol administration. n=6. e, MSC-derived Il25 after 6-OHDA and Clenbuterol administration. n=6. f, GDNF on MSCs. Adrb2fl n=6, Adrb2ΔPdgfra n=4. Data are representative of 3 independent experiments. n represents biologically independent animals. Data are presented as mean values and error bars: SEM. Two-tailed unpaired Welch's t-test. ns not significant.
Extended Data Figure 4
Extended Data Figure 4. RET signals do not impact ILC2 differentiation and activation genes.
Heatmap Log(CPM) of ILC2-related genes in ILC2s from a, Retfl n=4 and RetΔVav1 n=5; and b, Rag1-/-.RetWT n=3, Rag1-/-.RetMEN2B n=3.
Extended Data Figure 5
Extended Data Figure 5. ILC2-autonomous RET signals control type 2 innate cytokines in the GAT.
GAT ILC2 function (a-c). a, Gfra1-/- foetal liver chimaeras. n=5; b, Gfra2+/+, n=10; Gfra2-/- n=5. c, Gfra+/+ n=8; Gfra3-/-. n=8. d, RetΔIl5 mixed BM chimaeras scheme. e, GAT ILC2 from RetΔIl5 mixed BM chimaeras. Retfl n=6; RetΔIl5 n=7. f, ILC2 from Rag1-/-.RetWT n=6, Rag1-/-.RetΔIl5 n=6. g, ILC2 from RetWT n=10, RetΔIl5 n=8. h, RetΔI15 mixed BM chimaeras scheme. i, GAT ILC2 from RetΔI15 mixed BM chimaeras. RetWTn=4; RetΔI15 n=4. j, GAT ILC2 in Rag1-/-.RetMEN2B BM chimaeras. Rag1-/-.RetWT n=5, Rag1-/-.RetMEN2B n=6. k, RetMEN2B mixed BM chimaeras scheme. l, Mixed BM chimaeras. Rag1-/-.RetWT n=6, Rag1-/-.RetMEN2B n=7. Data are representative of 3 independent experiments. n represents biologically independent animals. Data are presented as mean values and error bars: SEM. Two-tailed unpaired Welch's t-test. *P<0.05; **P<0.01; ***P<0.005; ns not significant.
Extended Data Figure 6
Extended Data Figure 6. ILC2-intrinsic RET signalling is sufficient to control adipocyte physiology and obesity.
a, GAT ILC2 after 6-OHDA administration. RetWT n=8 and RetΔIl5 n=7. b, Weight gain during 16 weeks of HFD regimen. Rag1-/-.RetWT n=4, Rag1-/-.RetΔIl5 n=5. c, Intestinal lamina propria ILC3s. Rag1-/-.RetWT n=5; Rag1-/-.RetΔIl5 n=5. d, Weight gain during 16 weeks of HFD regimen. RetWT n=5, RetΔIl5 n=5. e, Frequency of ILC2 and ILC3 in Thy+ Lin- lymphocytes from ILC2-chimaeric mice after HFD. Each bar represents one individual mouse. n=4. f, Total GAT RNA expression of Ucp1, Cox8b and Cidea. n=5. Data are presented as mean values and error bars: SEM. Two-tailed: unpaired Welch's t-test (a, c, e); repeated measures ANOVA corrected for multiple comparisons with the Benjamini, Krieger and Yekutieli procedure (b,d); and Mann Whitney test (f). *P<0.05; **P<0.01; ns not significant.
Extended Data Figure 7
Extended Data Figure 7. RET signals control adipose tissue energy expenditure.
Total GAT RNA expression of adipose tissue related genes. a, Retfl n=4; RetΔVav1 n=6. b, Rag1-/-.RetWT n=4; Rag1-/-.RetMEN2B n=5. c, GAT co-cultures scheme. d, GAT co-cultures with ILC2 and GDNF. Data are presented as mean values and error bars: SEM. Two-sided Mann Whitney test. *P<0.05; ns not significant.
Extended Data Figure 8
Extended Data Figure 8. An aorticorenal-adipose circuit connects to the brain.
a, DRG T13. Green: Viral tracing (VT). Red: TH. Scale bar: 100μm. b, Left: Brain atlas scheme of coronal section. Right: Polysynaptic tracing from the GAT corresponding to the highlighted area on the left. c, Left: Brain atlas scheme of coronal section. Right: Polysynaptic tracing from the Aorticorenal ganglion (ARG) corresponding to the highlighted area on the left. (b,c) Central amigdala (CA), Zona Incerta (ZI), Periaquedutal Gray (PAG) and Subcoeruleus Nucleus (SubCD). Scale bar 200μm. d, Electrolytic lesion of the PVH. Scale bar 500μm. e, GAT ILC2 in PVH ablated mice. Sham n=5; PVH ablated n=6. f, GAT Il33 expression in AAV (4D) compared to contralateral control after CNO administration. n=5. g, GAT Il33 expression in AAV (3D) compared to contralateral control after CNO administration. n=4. h, Scheme of combinatorial viral approach. The aorticorenal ganglion was injected with an adeno-associated virus carrying a Cre construct (AAV-Cre). Next, the GAT was injected with a Cre-inducible AAV(3Dfl). AAV(Cre) n=7 and AAV(Cre)+AAV(3Dfl) n=6. Data are representative of 3 independent experiments. n represents biologically independent animals. Data are presented as mean values and error bars: SEM. Two-tailed unpaired t-test (e). Two-tailed Mann Whitney test (f, g). Two-tailed: unpaired Welch's t-test (h). *P<0.05; **P<0.01; ns not significant.
Extended Data Figure 9
Extended Data Figure 9. A sympathetic aorticorenal-adipose circuit connects to the brain and regulates ILC2.
GAT neuro-mesenchyme units translate sympathetic cues into neurotrophic factor expression. In turn, neurotrophic factors control adipose ILC2 function via the neuroregulatory receptor RET, shaping the host metabolism, energy expenditure and obesity. PVH-Paraventricular nucleus of the hypothalamus; SNS- Sympathetic nervous system; ARG- Aorticorenal ganglion.
Figure 1
Figure 1. Sympathetic-mesenchyme interactions control ILC2 in the GAT.
a, GAT. Red: sympathetic nerve fibres (TH). Green: endothelial cells (CD31). Scale bar: 300μm. b, ILC2 function after 6-OHDA administration. n=5. c, ILC2 cytokines after PegDT-treatment. n=4. d, ILC2 function after Clenbuterol administration. n=5. e, ILC2 cytokines after CNO administration. R26/3Dfl n=5, R26/3DΔTh n=4. f, GAT ILC2. Adrb2WT n=7, Adrb2ΔIl7ra n=8. g, ILC2 function after 6-OHDA administration. Adrb2WT n=13, Adrb2ΔII7ra n=15. h, GAT cell populations. n=6. i, Green: sympathetic nerve fibres (TH). Red: glial cells (GFAP). Blue: cell nuclei (DAPI). Scale bar: 50μm. j. Green: sympathetic nerve fibres (TH). Red: MSCs (PDGFRA). Scale bar: 20μm. k, GAT ILC2. Adrb2fl n=6, Adrb2ΔGfap n=8. l, GAT ILC2. Adrb2fl n=10, Adrb2ΔPdgfra n=8. Data are representative of 3 independent experiments. n represents biologically independent animals. Data are presented as mean values and error bars: SEM. Two-tailed unpaired Welch's t-test (b-g, k, l). Ordinary one-way ANOVA with Dunnett's multiple comparisons test (h). *P<0.05; **P<0.01; ***P<0.005; ****p<0.001; ns not significant.
Figure 2
Figure 2. Sympathetic cues orchestrate mesenchyme-derived GDNF and innate type 2 cytokines.
6-OHDA treatment (a-c). a, RNAseq of PDGFRA+ MSC. Top: Mean-difference plot of vehicle versus 6-OHDA. Bottom: heatmap of downregulated genes. Vehicle n=4, 6-OHDA n=5. b, Total GAT RNA. n=5. c, GAT cell populations. n=4. (d,e) Clenbuterol administration. d, Total GAT RNA. n=5. e, GAT cell populations. n=5. f, Total GAT RNA. Adrb2fl n=9, Adrb2ΔPdgfra n=5. g, GAT cell populations. Adrb2fl n=6, Adrb2ΔPdgfra n=4. h, GDNF Median Flourescence Intensity (MFI) in MSC. n=4. i, GAT. Green: GDNF. Red: PDGFRA. Scale bar: 50μm. j, ILC2, T cells (T), natural killer cells (NK), B cells (B), macrophages (Mφ). n=7. k, GAT ILC2. n=5. l, GAT ILC2. n=6. (m, n) In vitro stimulation with GDNF. m, GAT ILC2. n=4. n, MFI innate type 2 cytokines. n=6. o, ILC2 from BM chimaeras. Rag1-/-.RetWT n=5, Rag1-/-.RetMEN2B n=4. Data are representative of 3 independent experiments. n represents biologically independent animals. Data are presented as mean values and error bars: SEM. Two-tailed unpaired Welch's t-test (b-h, k-o). One-way ANOVA (j). *P<0.05; **P<0.01; ***P<0.005; ns not significant.
Figure 3
Figure 3. ILC2-intrinsic RET cues control adipose tissue physiology and obesity.
16 weeks of HFD regimen (a-m). a, Weight gain. n=6. b, Glucose tolerance test. n=6. c, GAT weight. n=6. ILC2 chimaeras: (d-h) ILC2 RetWT or RetΔ transplants; (i-m) ILC2 RetWT or RetMEN2B transplants. d, Weight gain. RetWT n=5, RetΔ n=6. e, Glucose tolerance test. RetWT n=4, RetΔ n=6. f, GAT weight. RetWT n=4, RetΔ n=6. g, Adipocyte area. Background: white 200μm2 range intervals; grey 1000μm2 range intervals. RetWT n=4, RetΔ n=6. h, GAT. Scale bar: 100μm. i, GAT weight. n=5. j, Glucose tolerance test. n=5. k, GAT weight. n=5. l, Adipocyte area. Background: white 300μm2 range intervals; grey 1000μm2 range intervals. n=5. m, GAT. Scale bar: 100μm. n, GAT. Retfl n=4, RetΔVav1 n=6. o, GAT. Rag1-/-.RetMEN2B BM chimaeras. Rag1-/-.RetWT n=4, Rag1-/-.RetMEN2B n=5. Data are representative of 3 independent experiments. n represents biologically independent animals. Data are presented as mean values and error bars: SEM. Two-sided two-way repeated measures ANOVA (a,b,d,e,i,j), corrected for multiple comparisons Benjamini, Krieger and Yekutieli procedure with tests for interaction (Int), time and genotype (Gen) reported (a,d,i), and corrected for multiple comparisons with Sidak's multiple comparisons test (b,e,j). Two-tailed unpaired Welch's t-test (c,f,k). Twotailed unpaired Student t-test, one per range interval (g,l). Two-sided Mann-Whitney test (n, o). *P<0.05; **P<0.01; ***P<0.005; ****p<0.001; ns not significant.
Figure 4
Figure 4. An aorticorenal-adipose circuit connects to the brain and regulates ILC2.
(a-f) Green: Viral tracing (VT). Red: TH. Scale bar: 50μm. a, GAT. b, GAT sympathetic (TH) fibres. c, Genitofemoral nerve (arrows). d, TH positive fibres of the genitofemoral nerve. e, Aorticorenal ganglion (circled). f, TH positive neuronal cell bodies in the aorticorenal ganglion. g, Left: Brain atlas scheme of coronal section. Right: PRV-RFP viral tracing from the GAT corresponding to the highlighted area on the left. h, Left: Brain atlas scheme of coronal section. Right: PRV-RFP viral tracing from the aorticorenal ganglion (ARG) corresponding to the highlighted area on the left. Scale bar 200μm (g,h). i, Left: surgical GF ablation scheme. Right: GAT Gdnf. n=5. j, GAT ILC2. n=5. k, Left: chemogenetic inhibition scheme. Right: GAT Gdnf. n=5. l, GAT ILC2. n=5. m, Left: chemogenetic activation scheme. Right: GAT Gdnf. n=4. n, GAT ILC2. n=4. Data are representative of 3 independent experiments. n represents biologically independent animals. Data are presented as mean values and error bars: SEM. Two-tailed paired Student t-test. *P<0.05; **P<0.01; ***P<0.005; ns not significant.

Comment in

References

    1. Godinho-Silva C, Cardoso F, Veiga-Fernandes H. Neuro-Immune Cell Units: A New Paradigm in Physiology. Annu Rev Immunol. 2019;37:19–46. - PubMed
    1. Huh JR, Veiga-Fernandes H. Neuroimmune circuits in inter-organ communication. Nat Rev Immunol. 2020;20:217–228. - PubMed
    1. Veiga-Fernandes H, Artis D. Neuronal-immune system cross-talk in homeostasis. Science. 2018;359:1465–1466. - PubMed
    1. Chu C, Artis D, Chiu IM. Neuro-immune Interactions in the Tissues. Immunity. 2020;52:464–474. - PMC - PubMed
    1. Bartness TJ, Vaughan CH, Song CK. Sympathetic and sensory innervation of brown adipose tissue. Int J Obes (Lond) 2010;34(Suppl 1):S36-42. - PMC - PubMed

Publication types

MeSH terms

Substances