. 2021 Sep;597(7875):263-267.
doi: 10.1038/s41586-021-03827-2. Epub 2021 Aug 18.

Dietary fructose improves intestinal cell survival and nutrient absorption

Affiliations

Dietary fructose improves intestinal cell survival and nutrient absorption

Samuel R Taylor et al. Nature. 2021 Sep.

Abstract

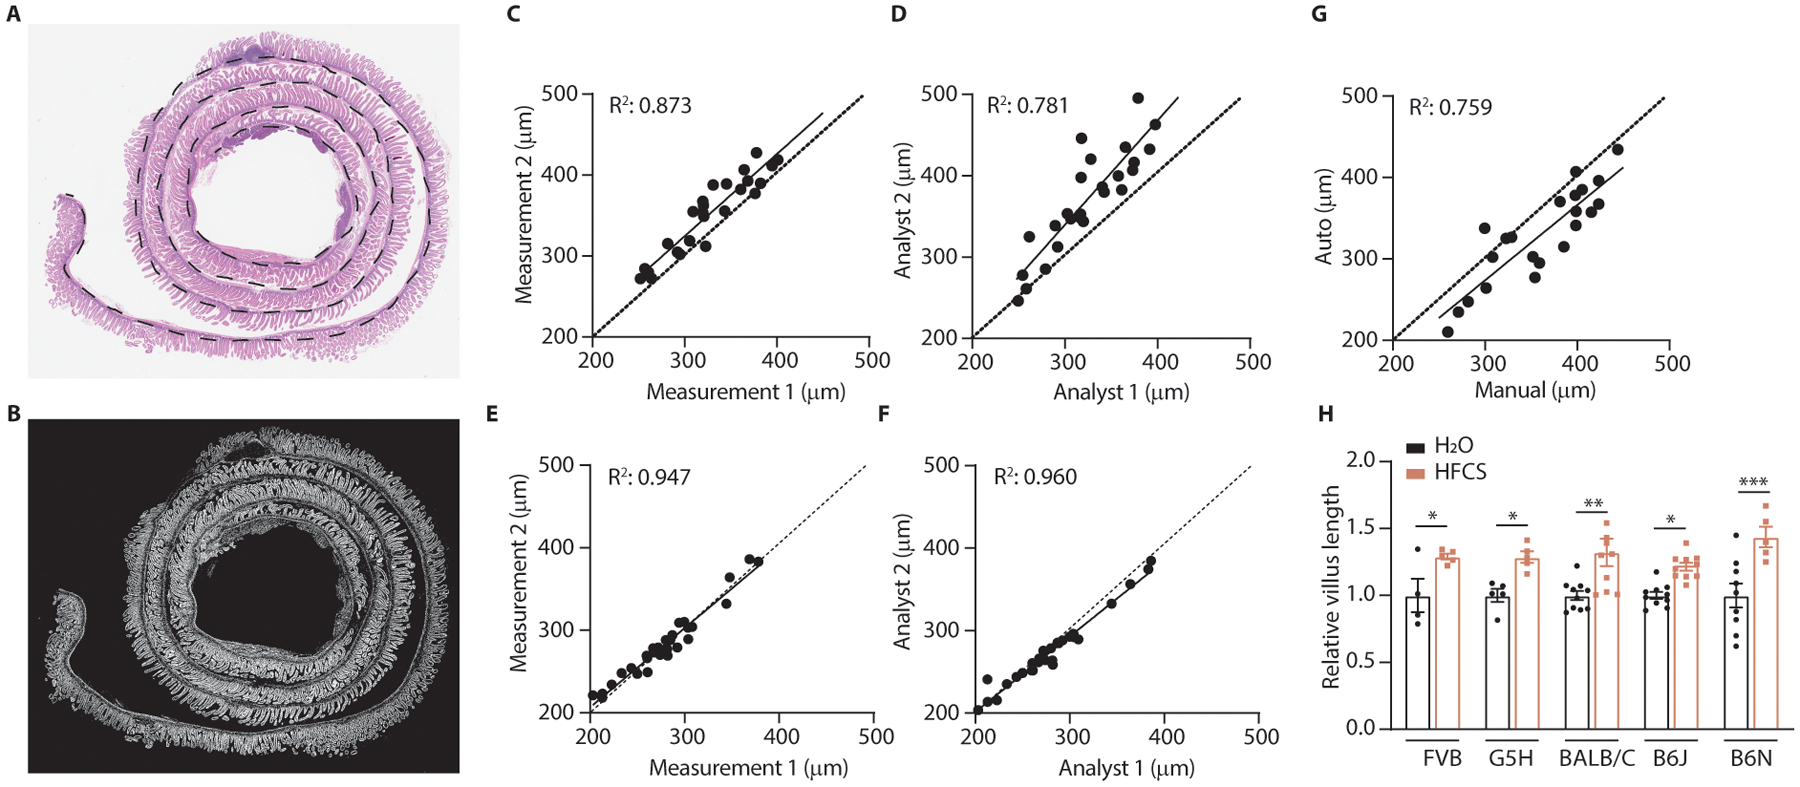
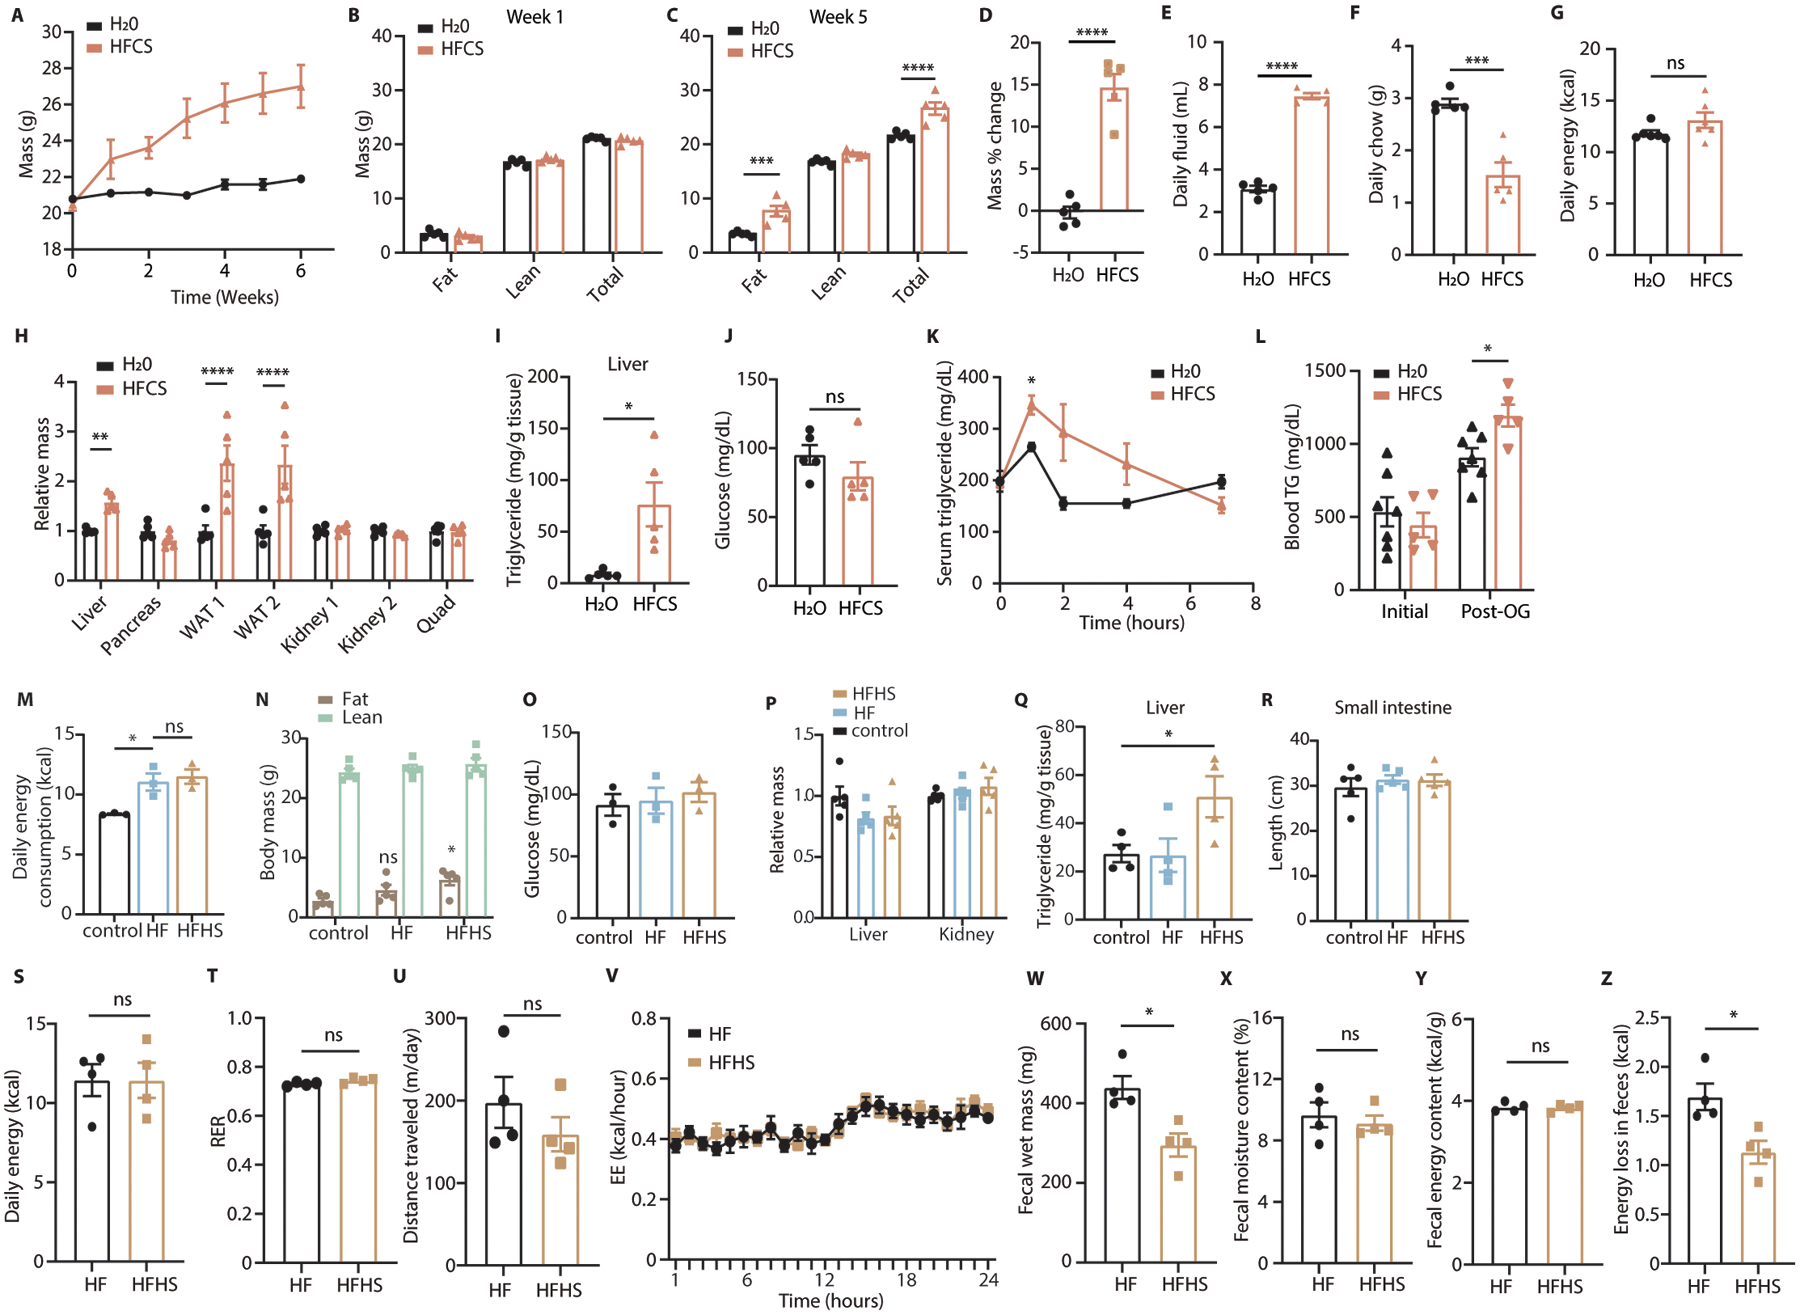
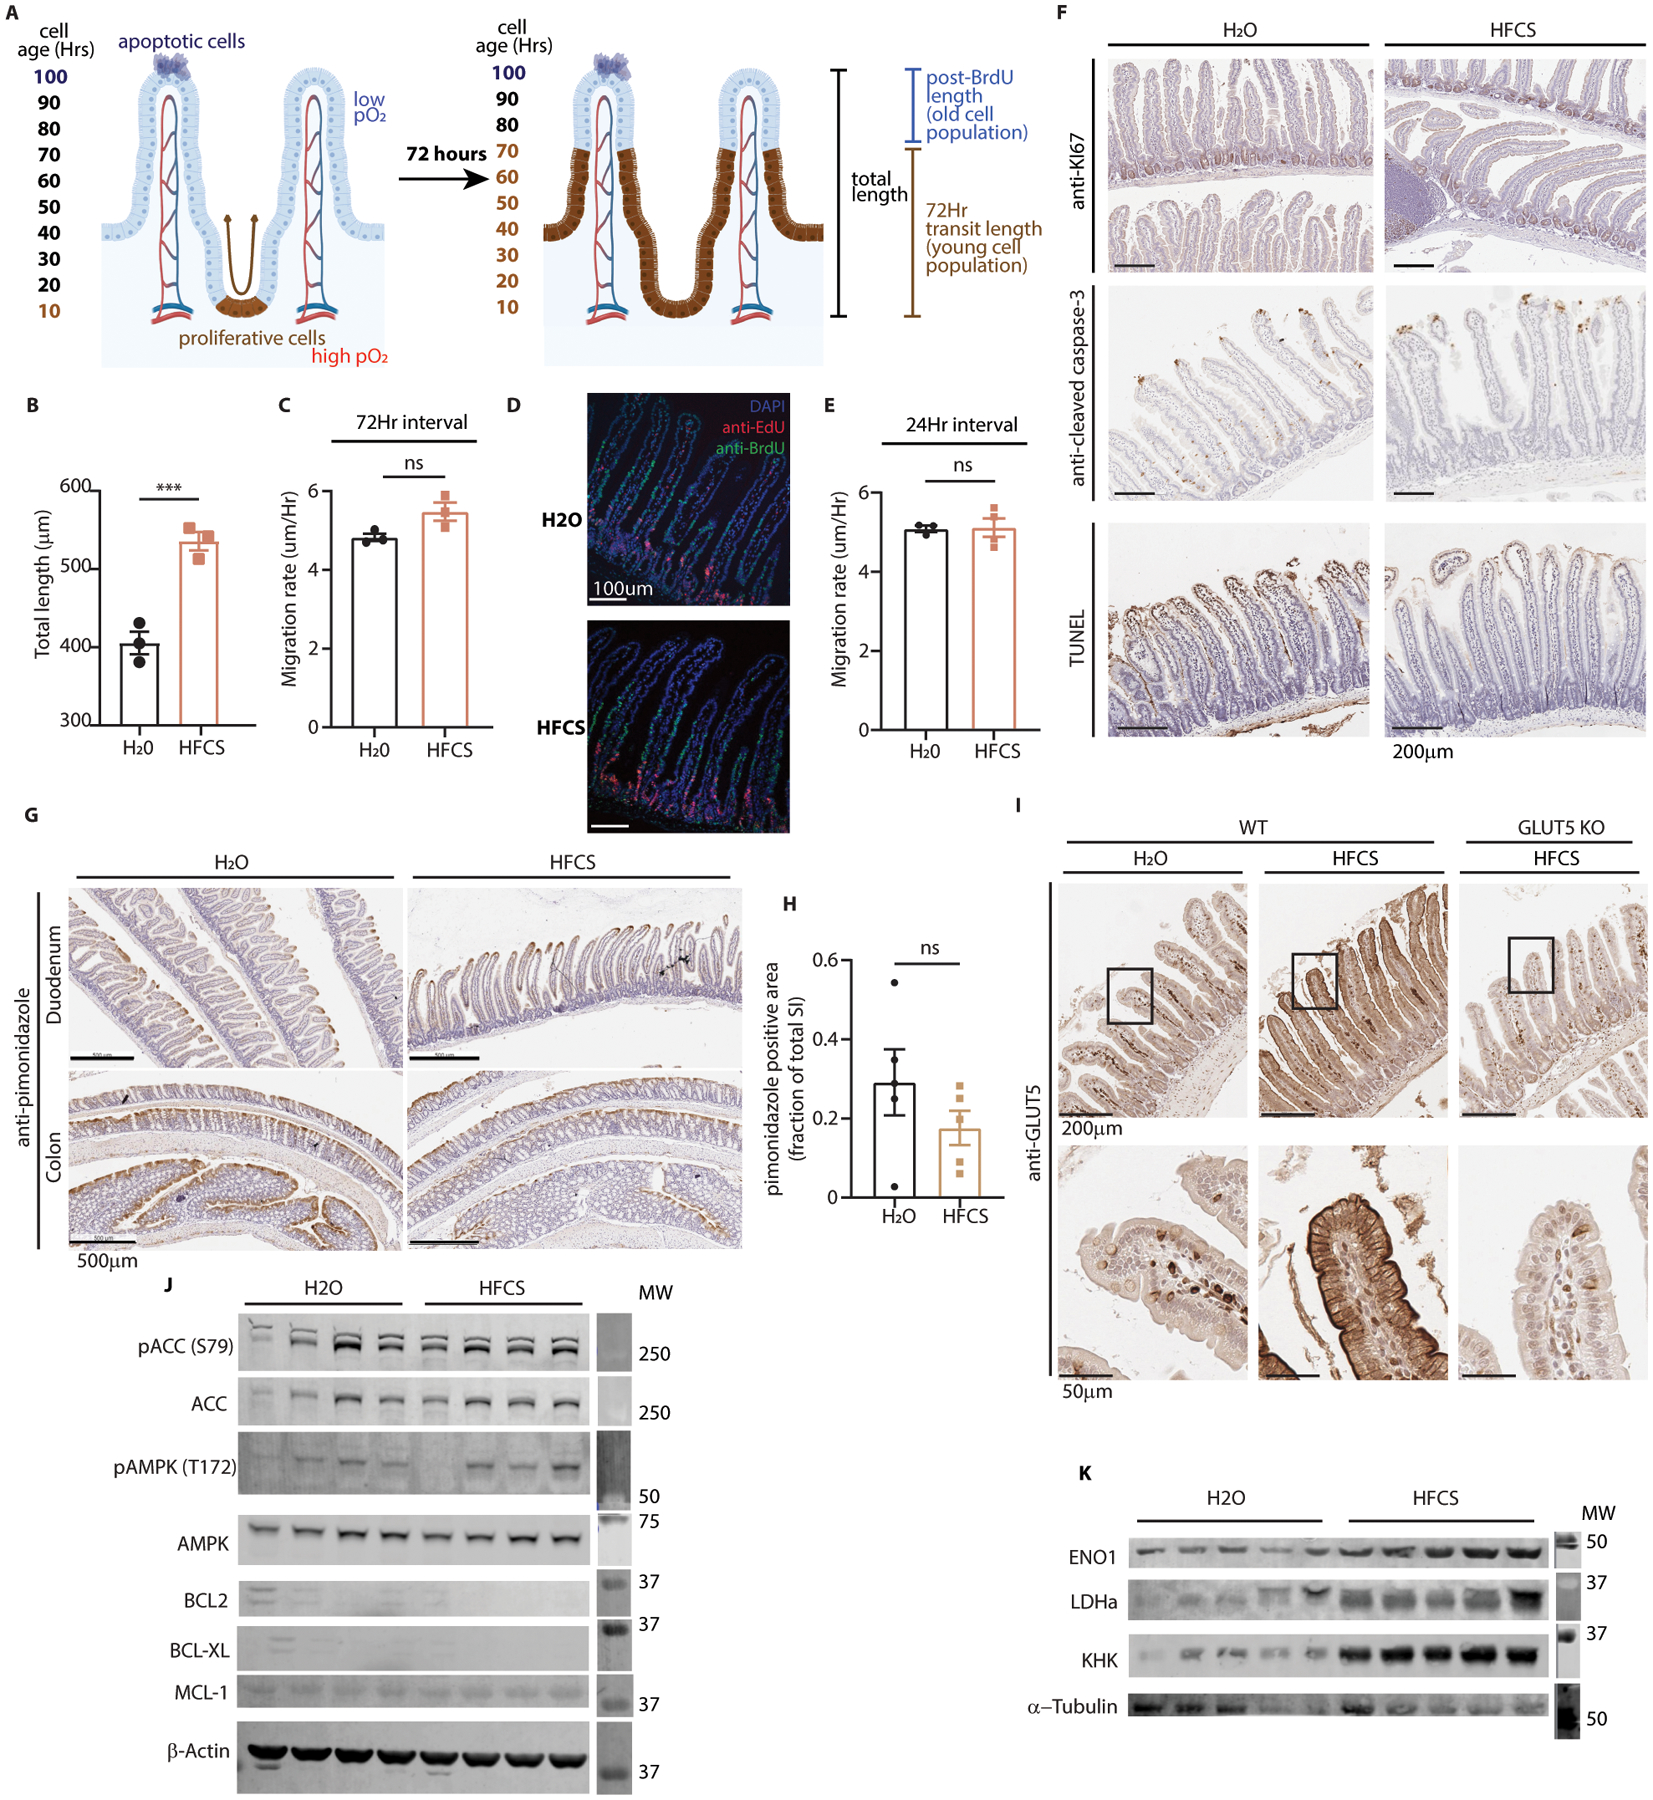
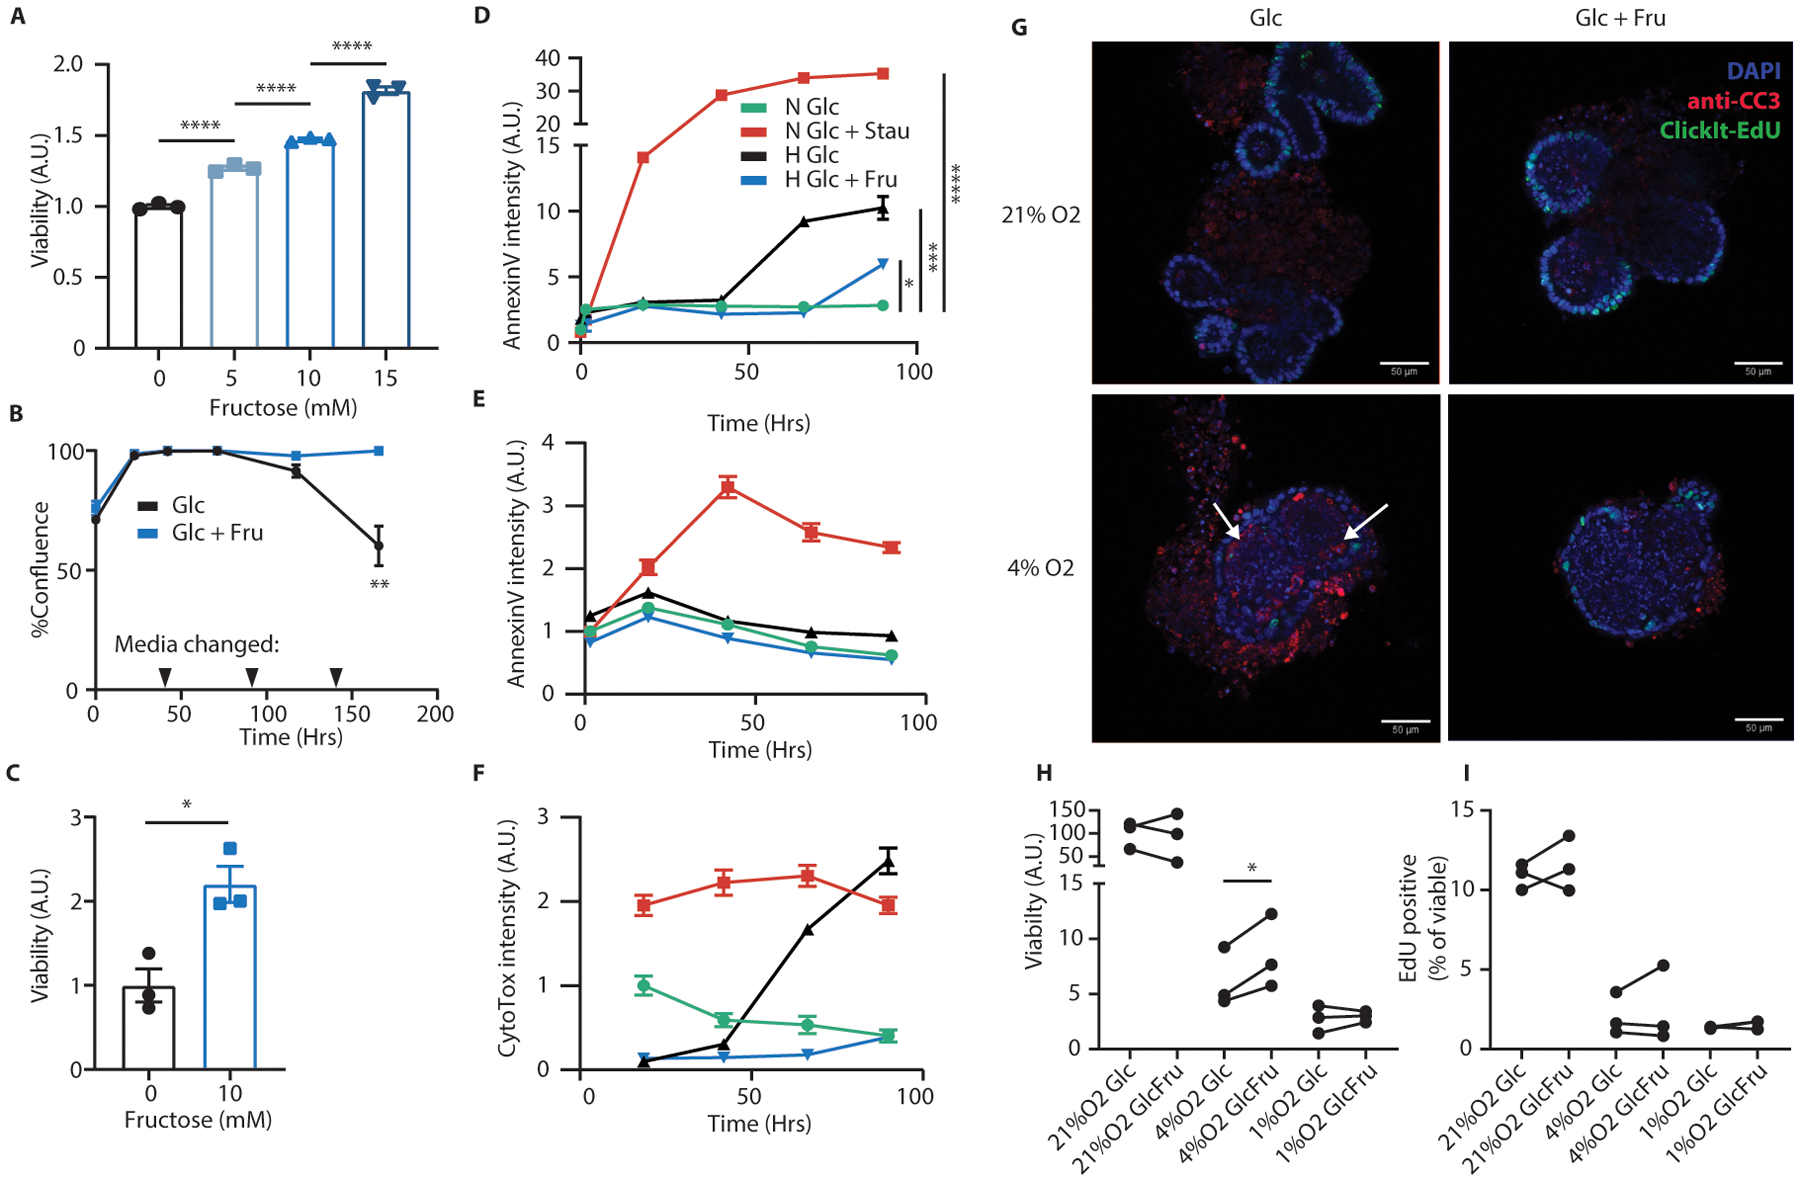
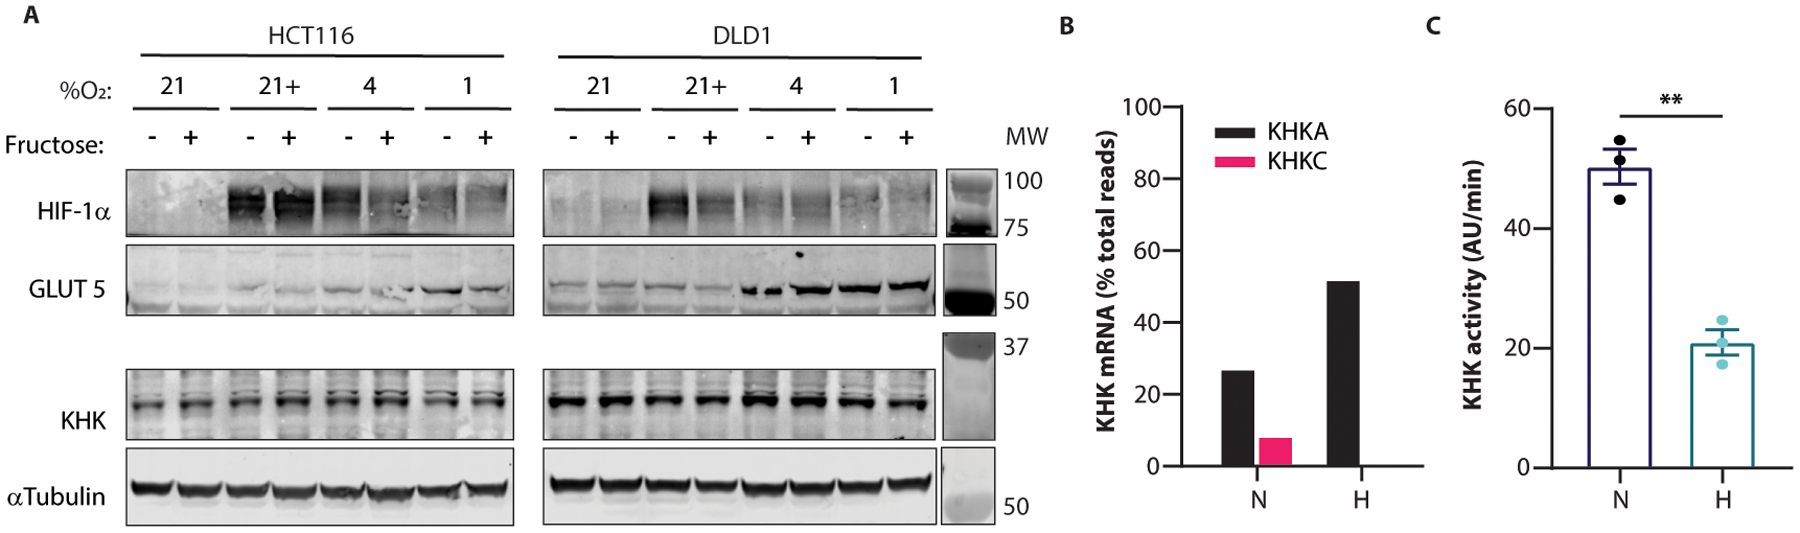
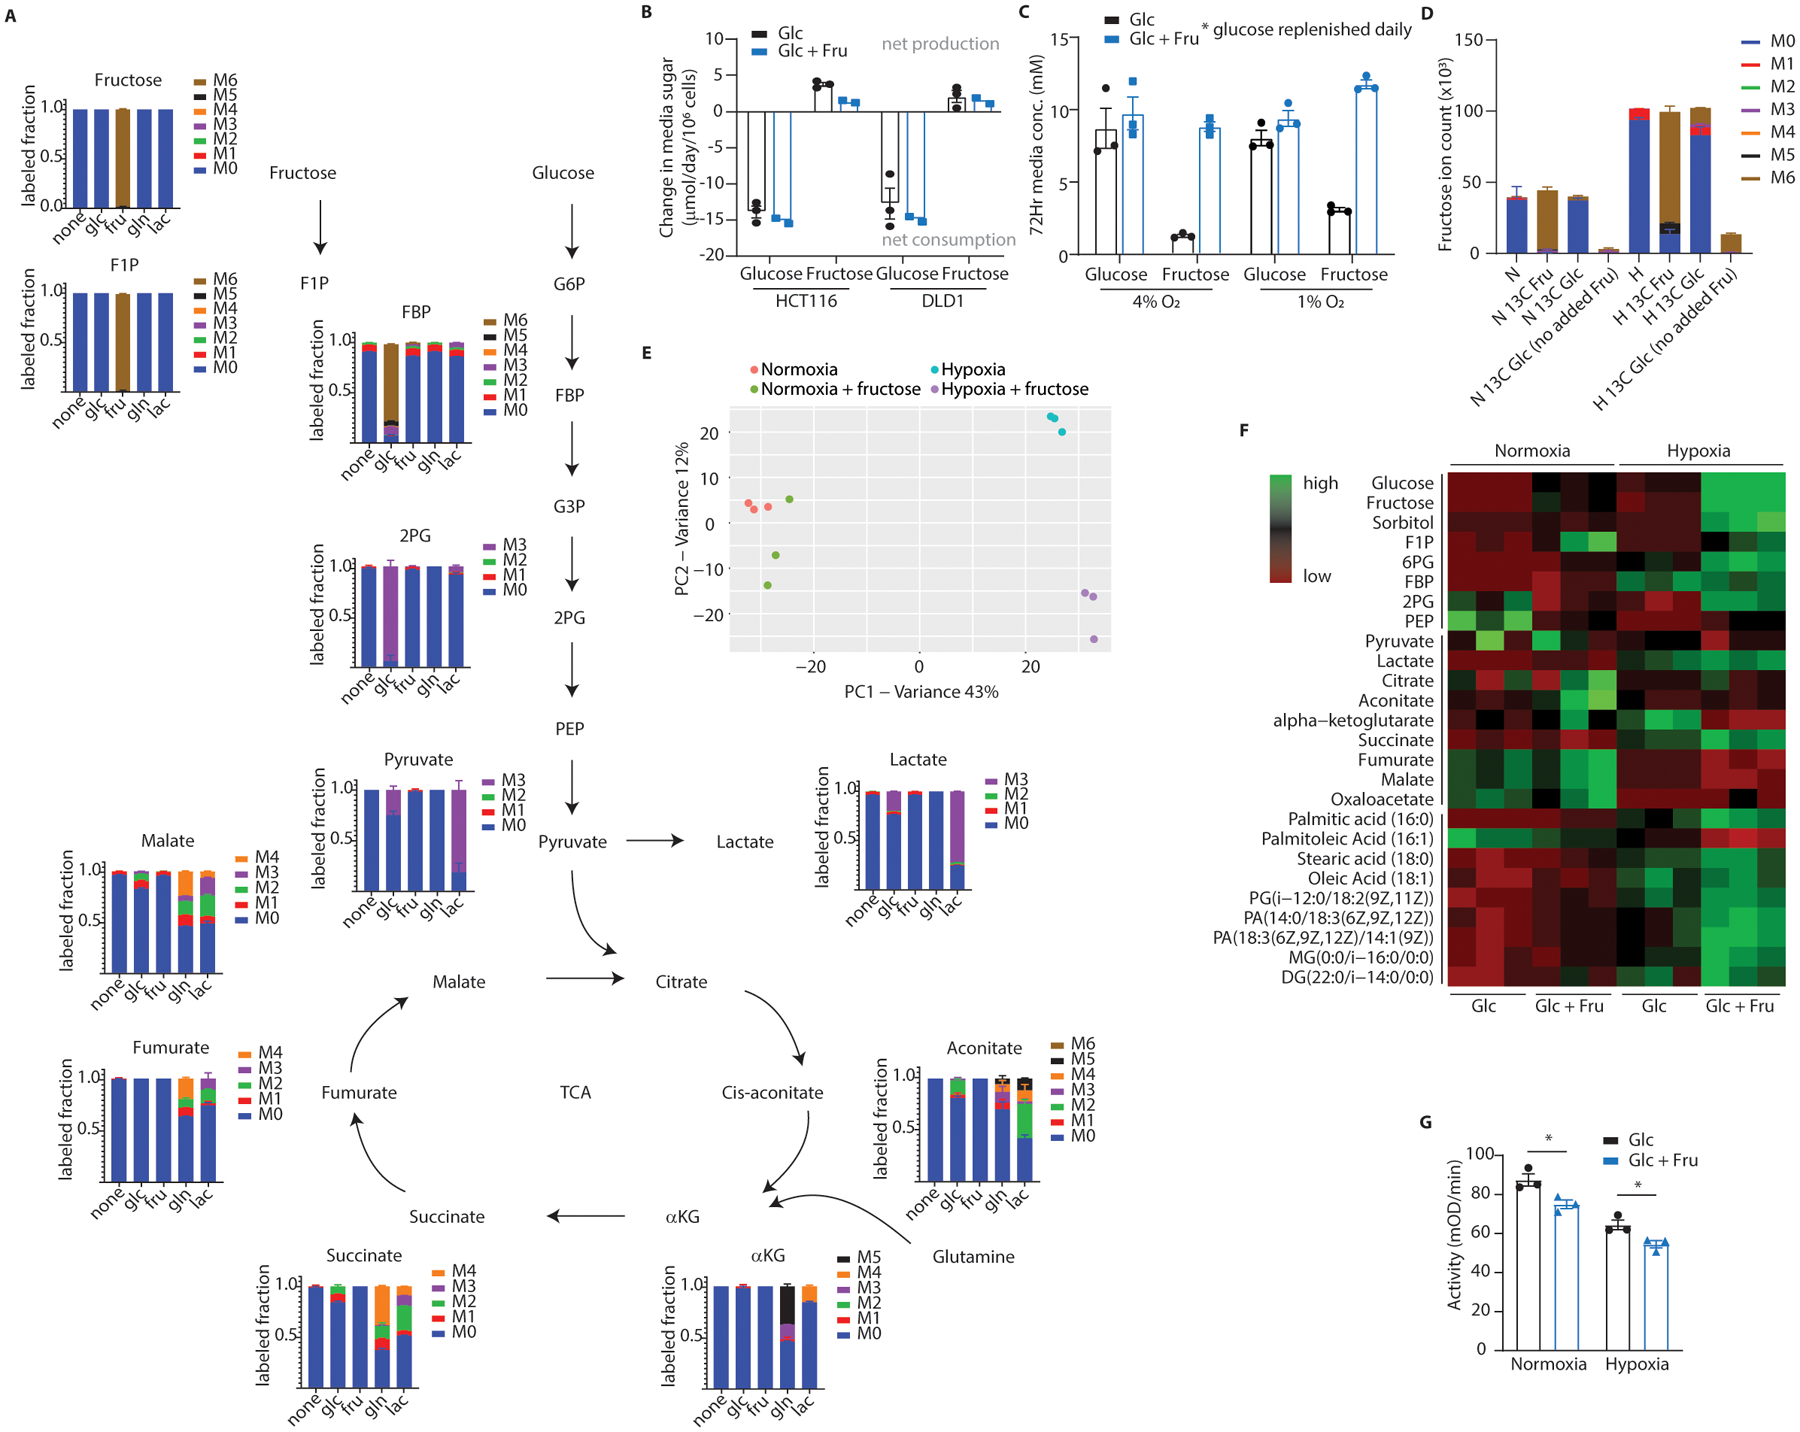
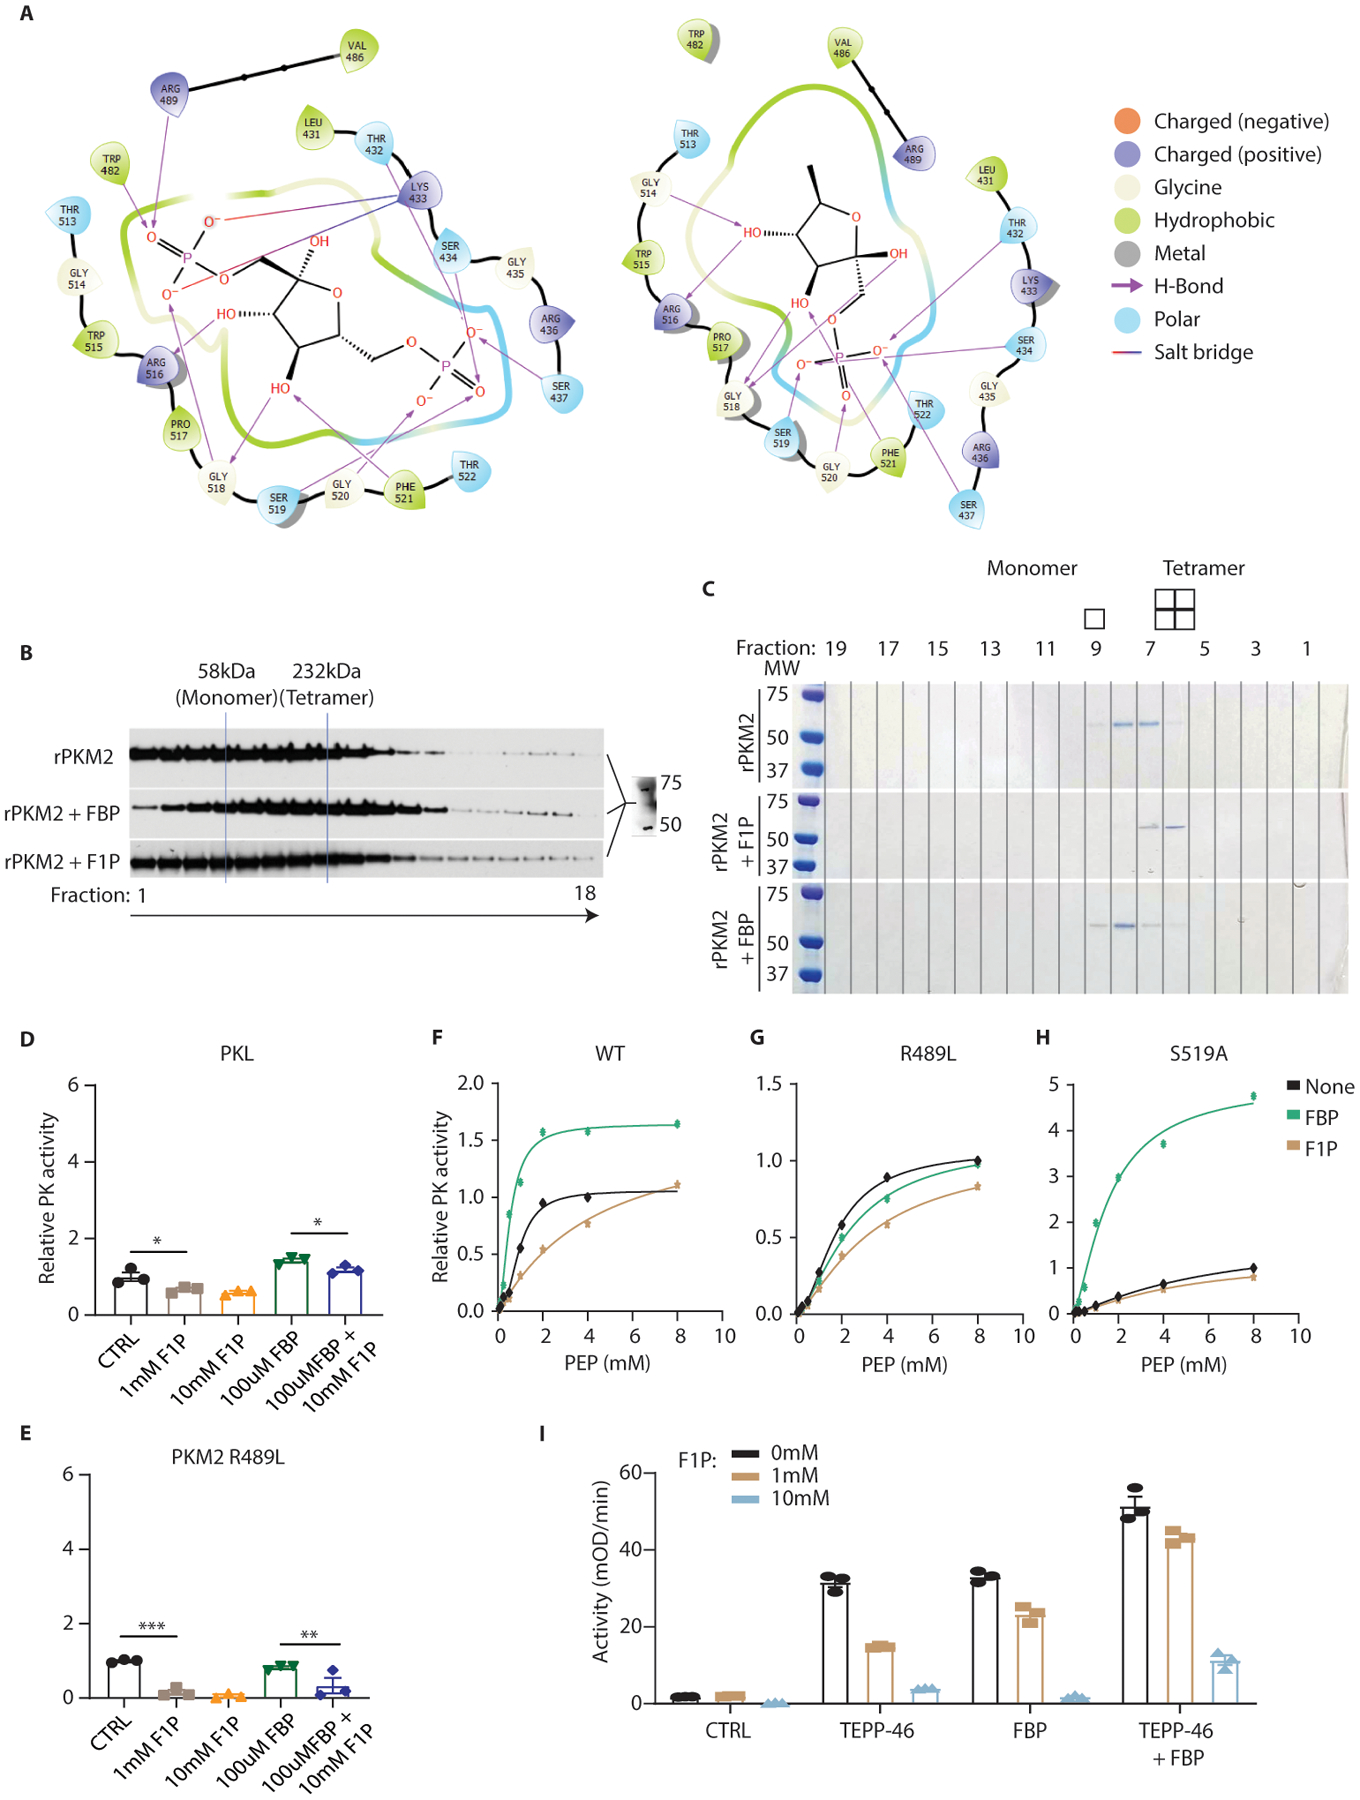
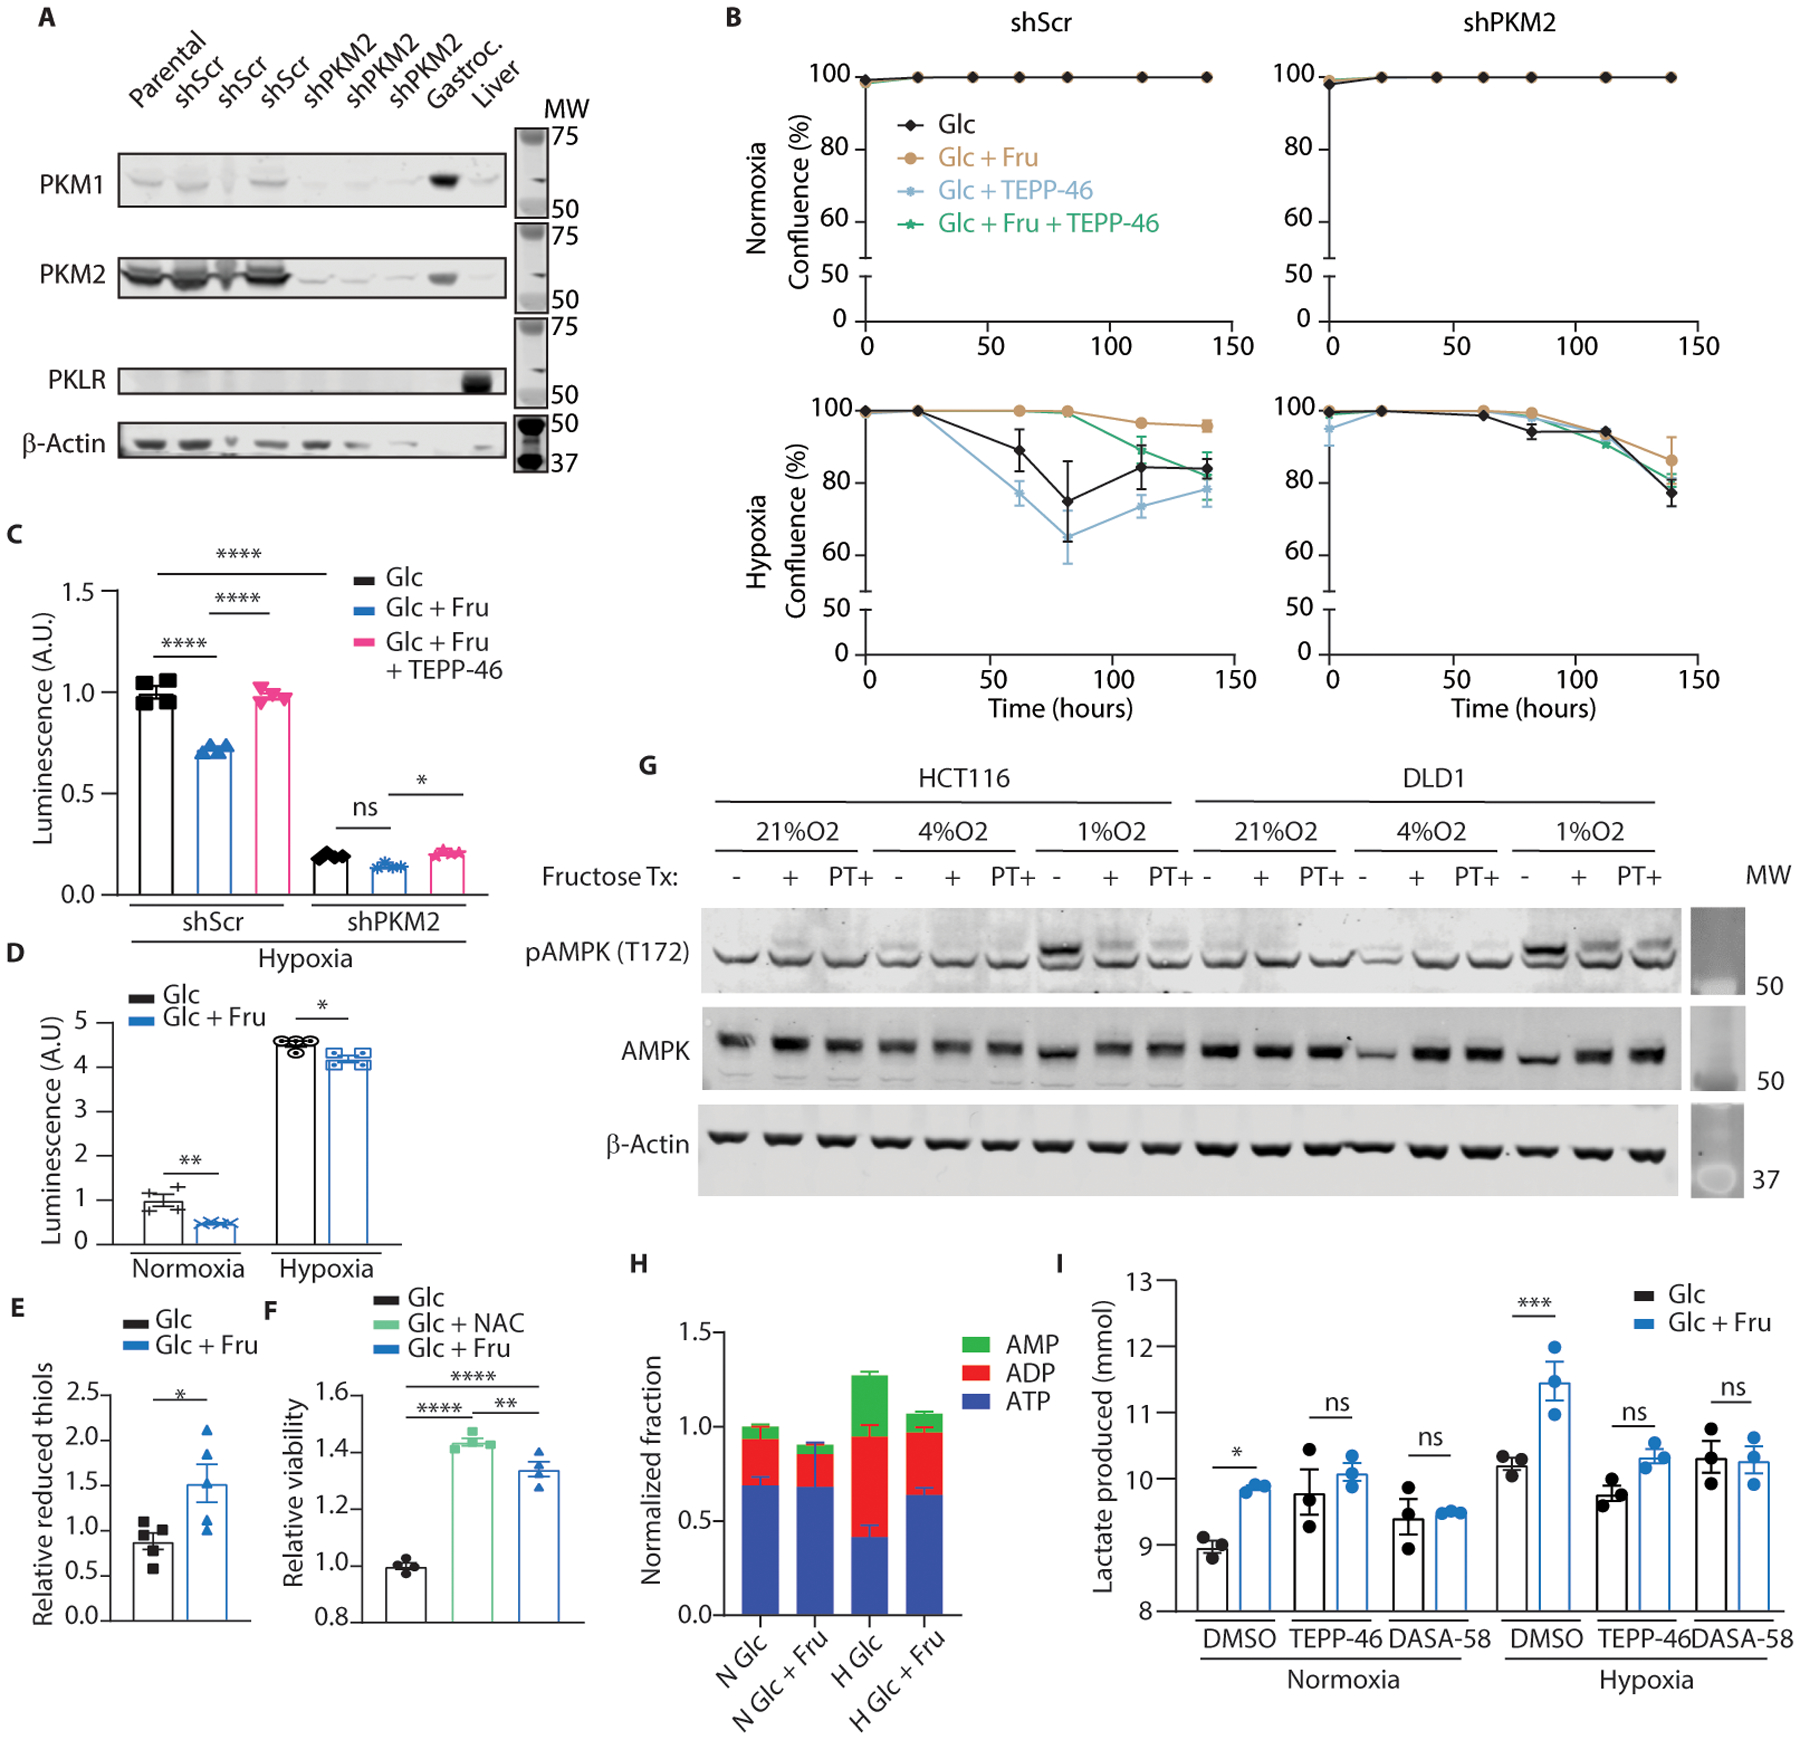
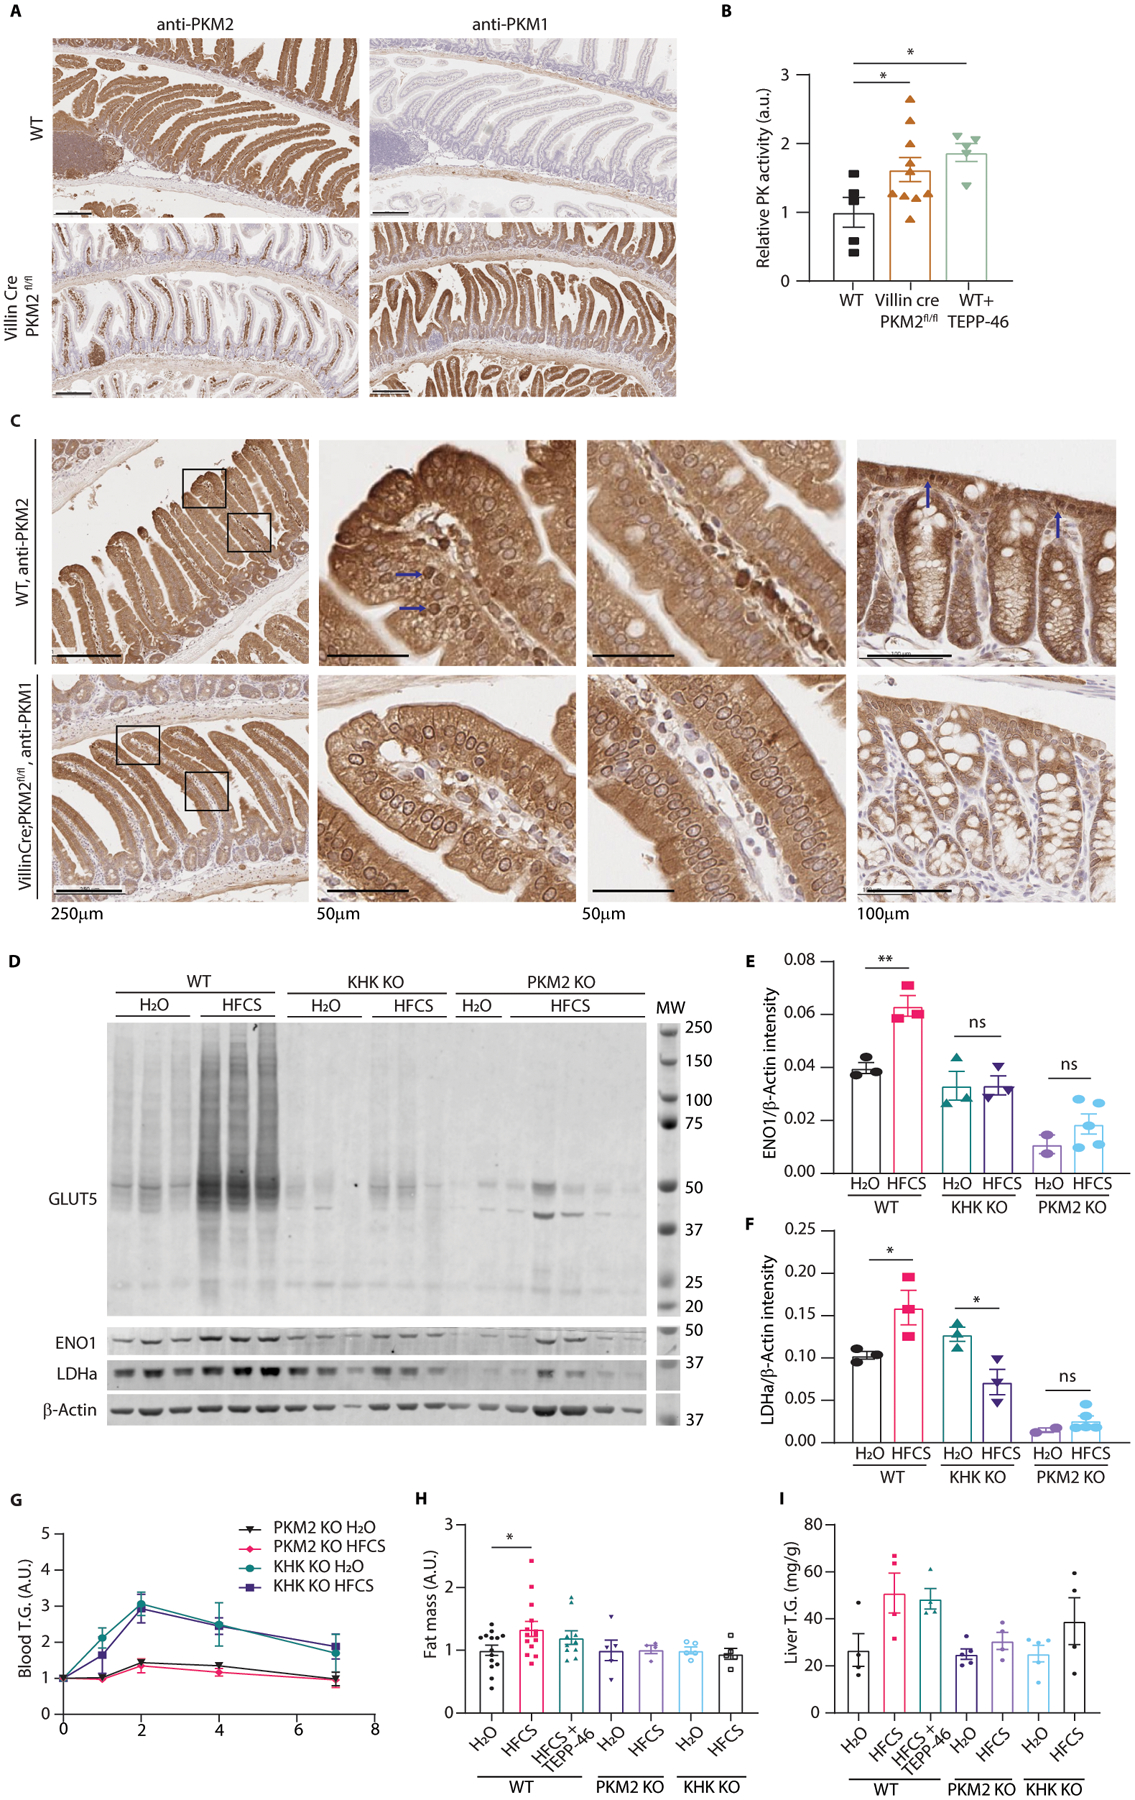
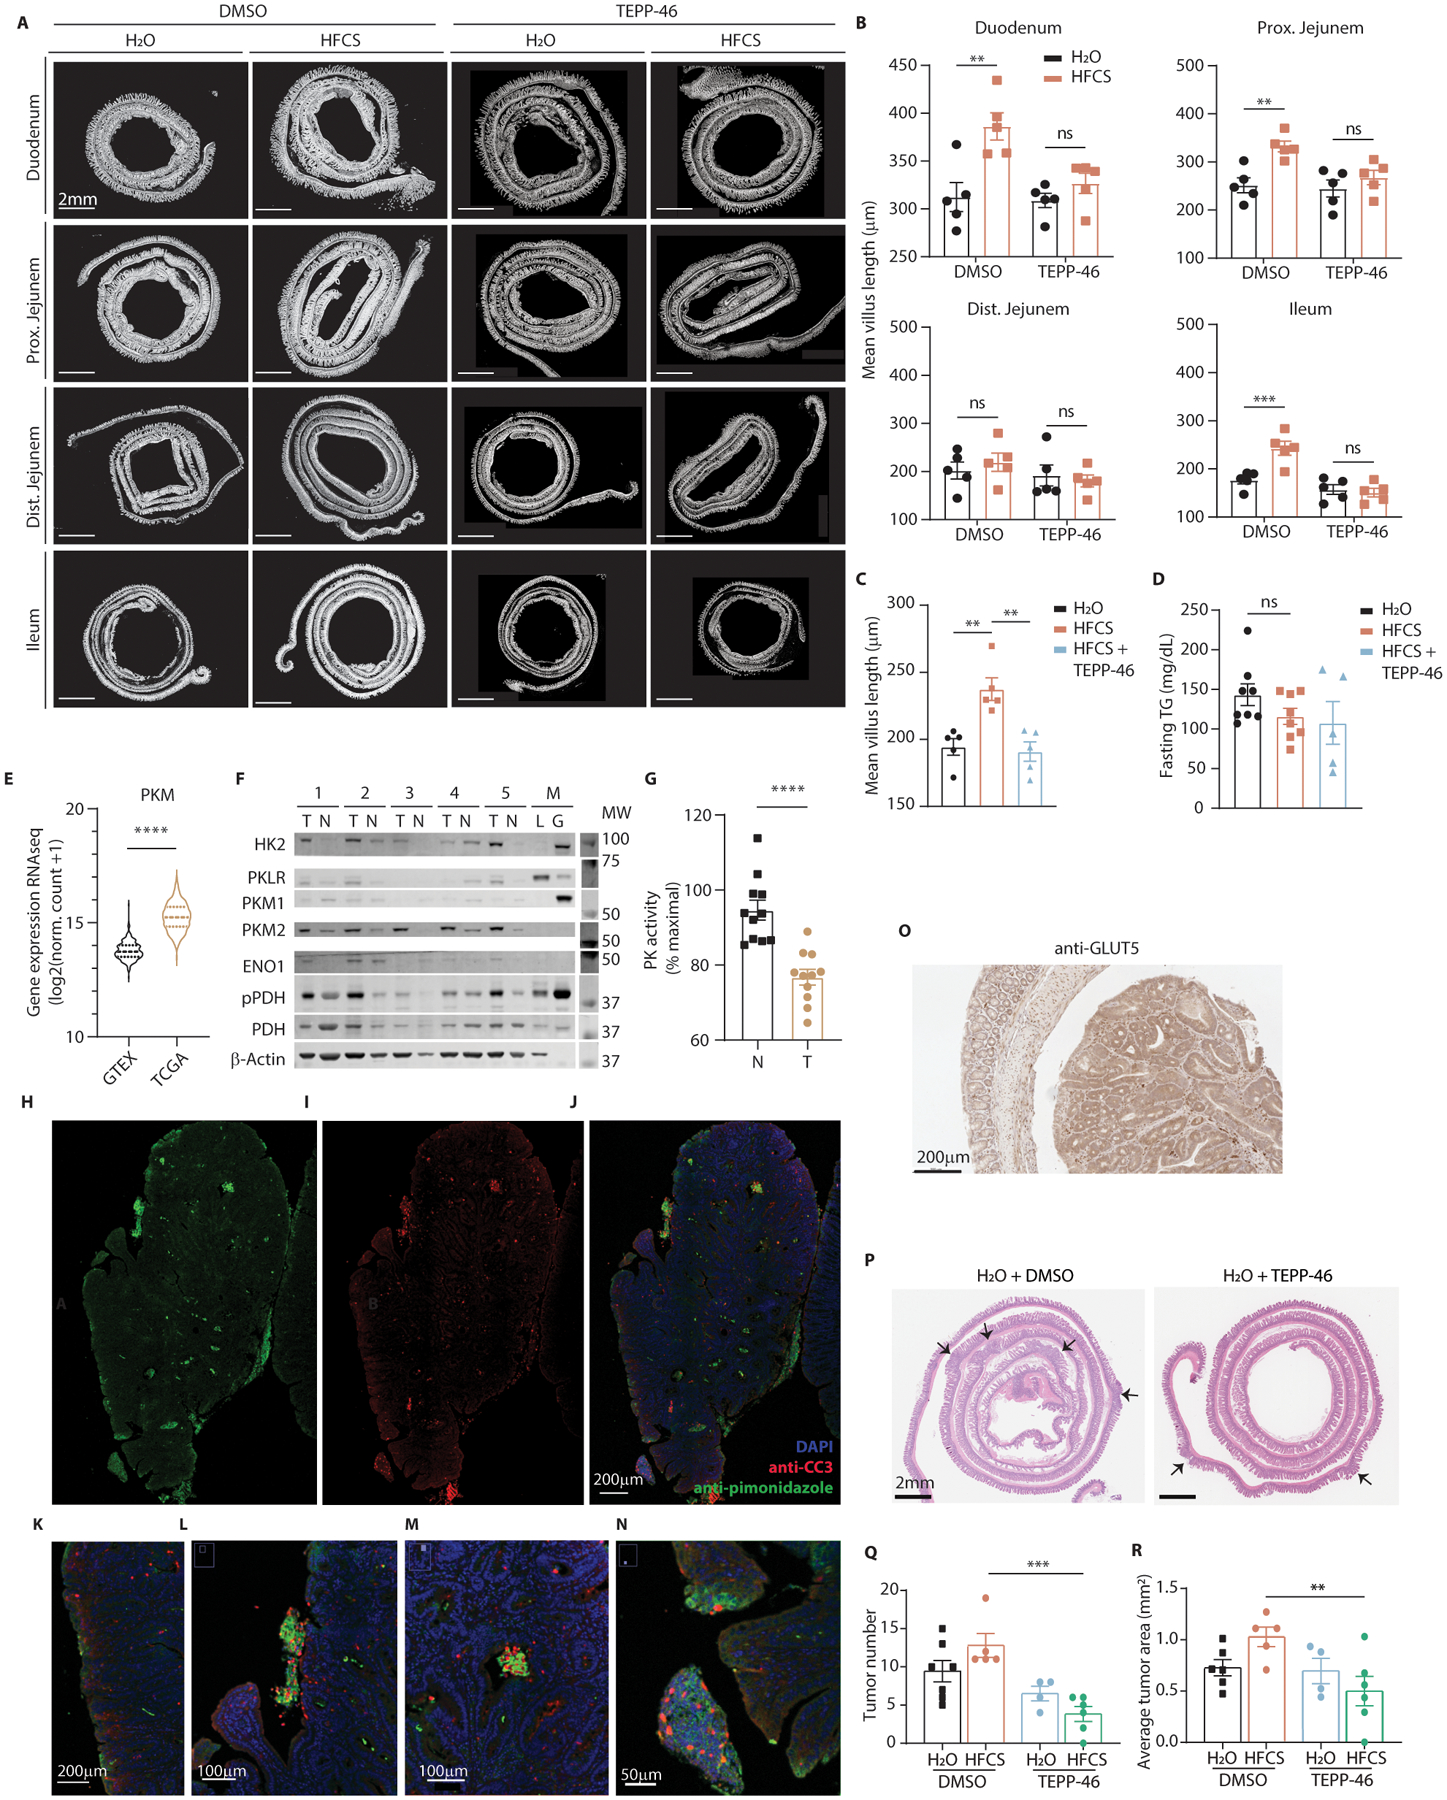
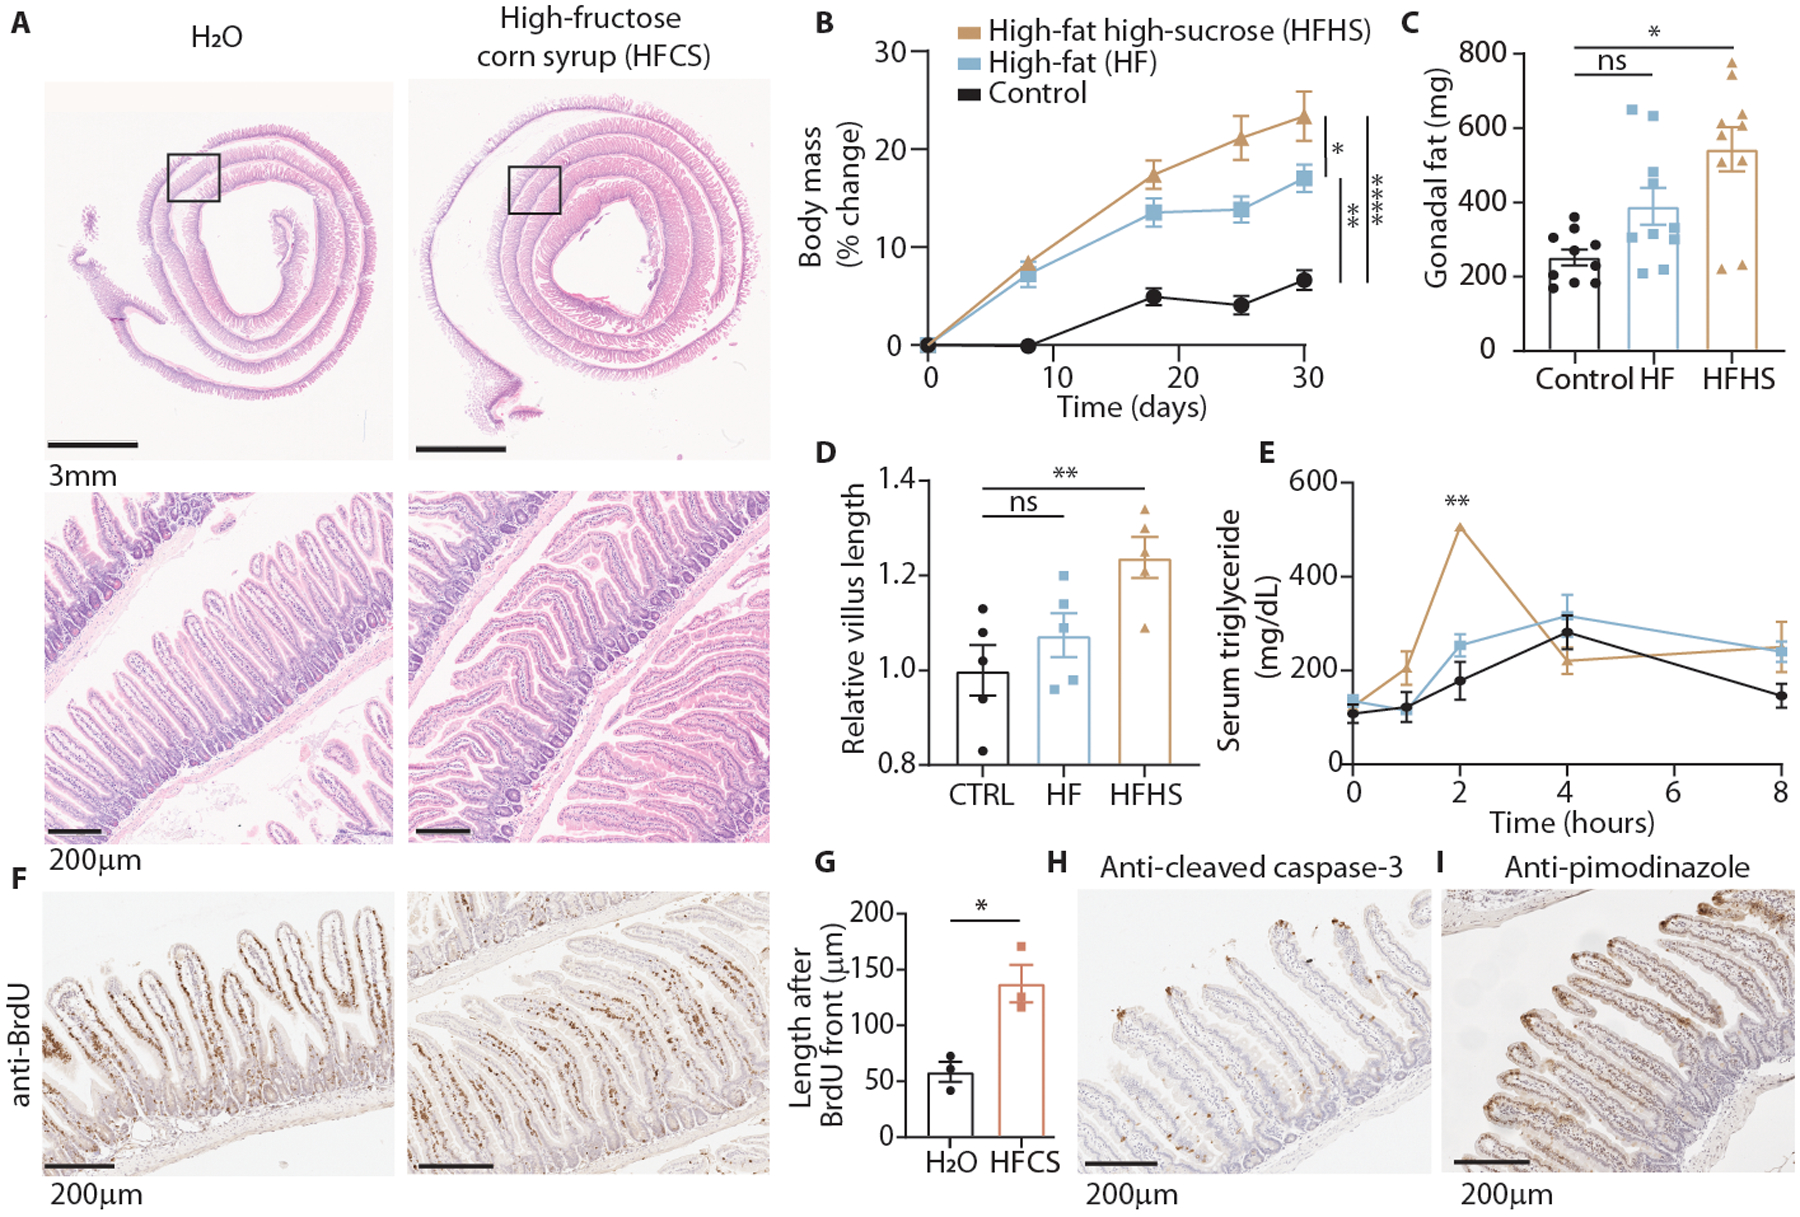
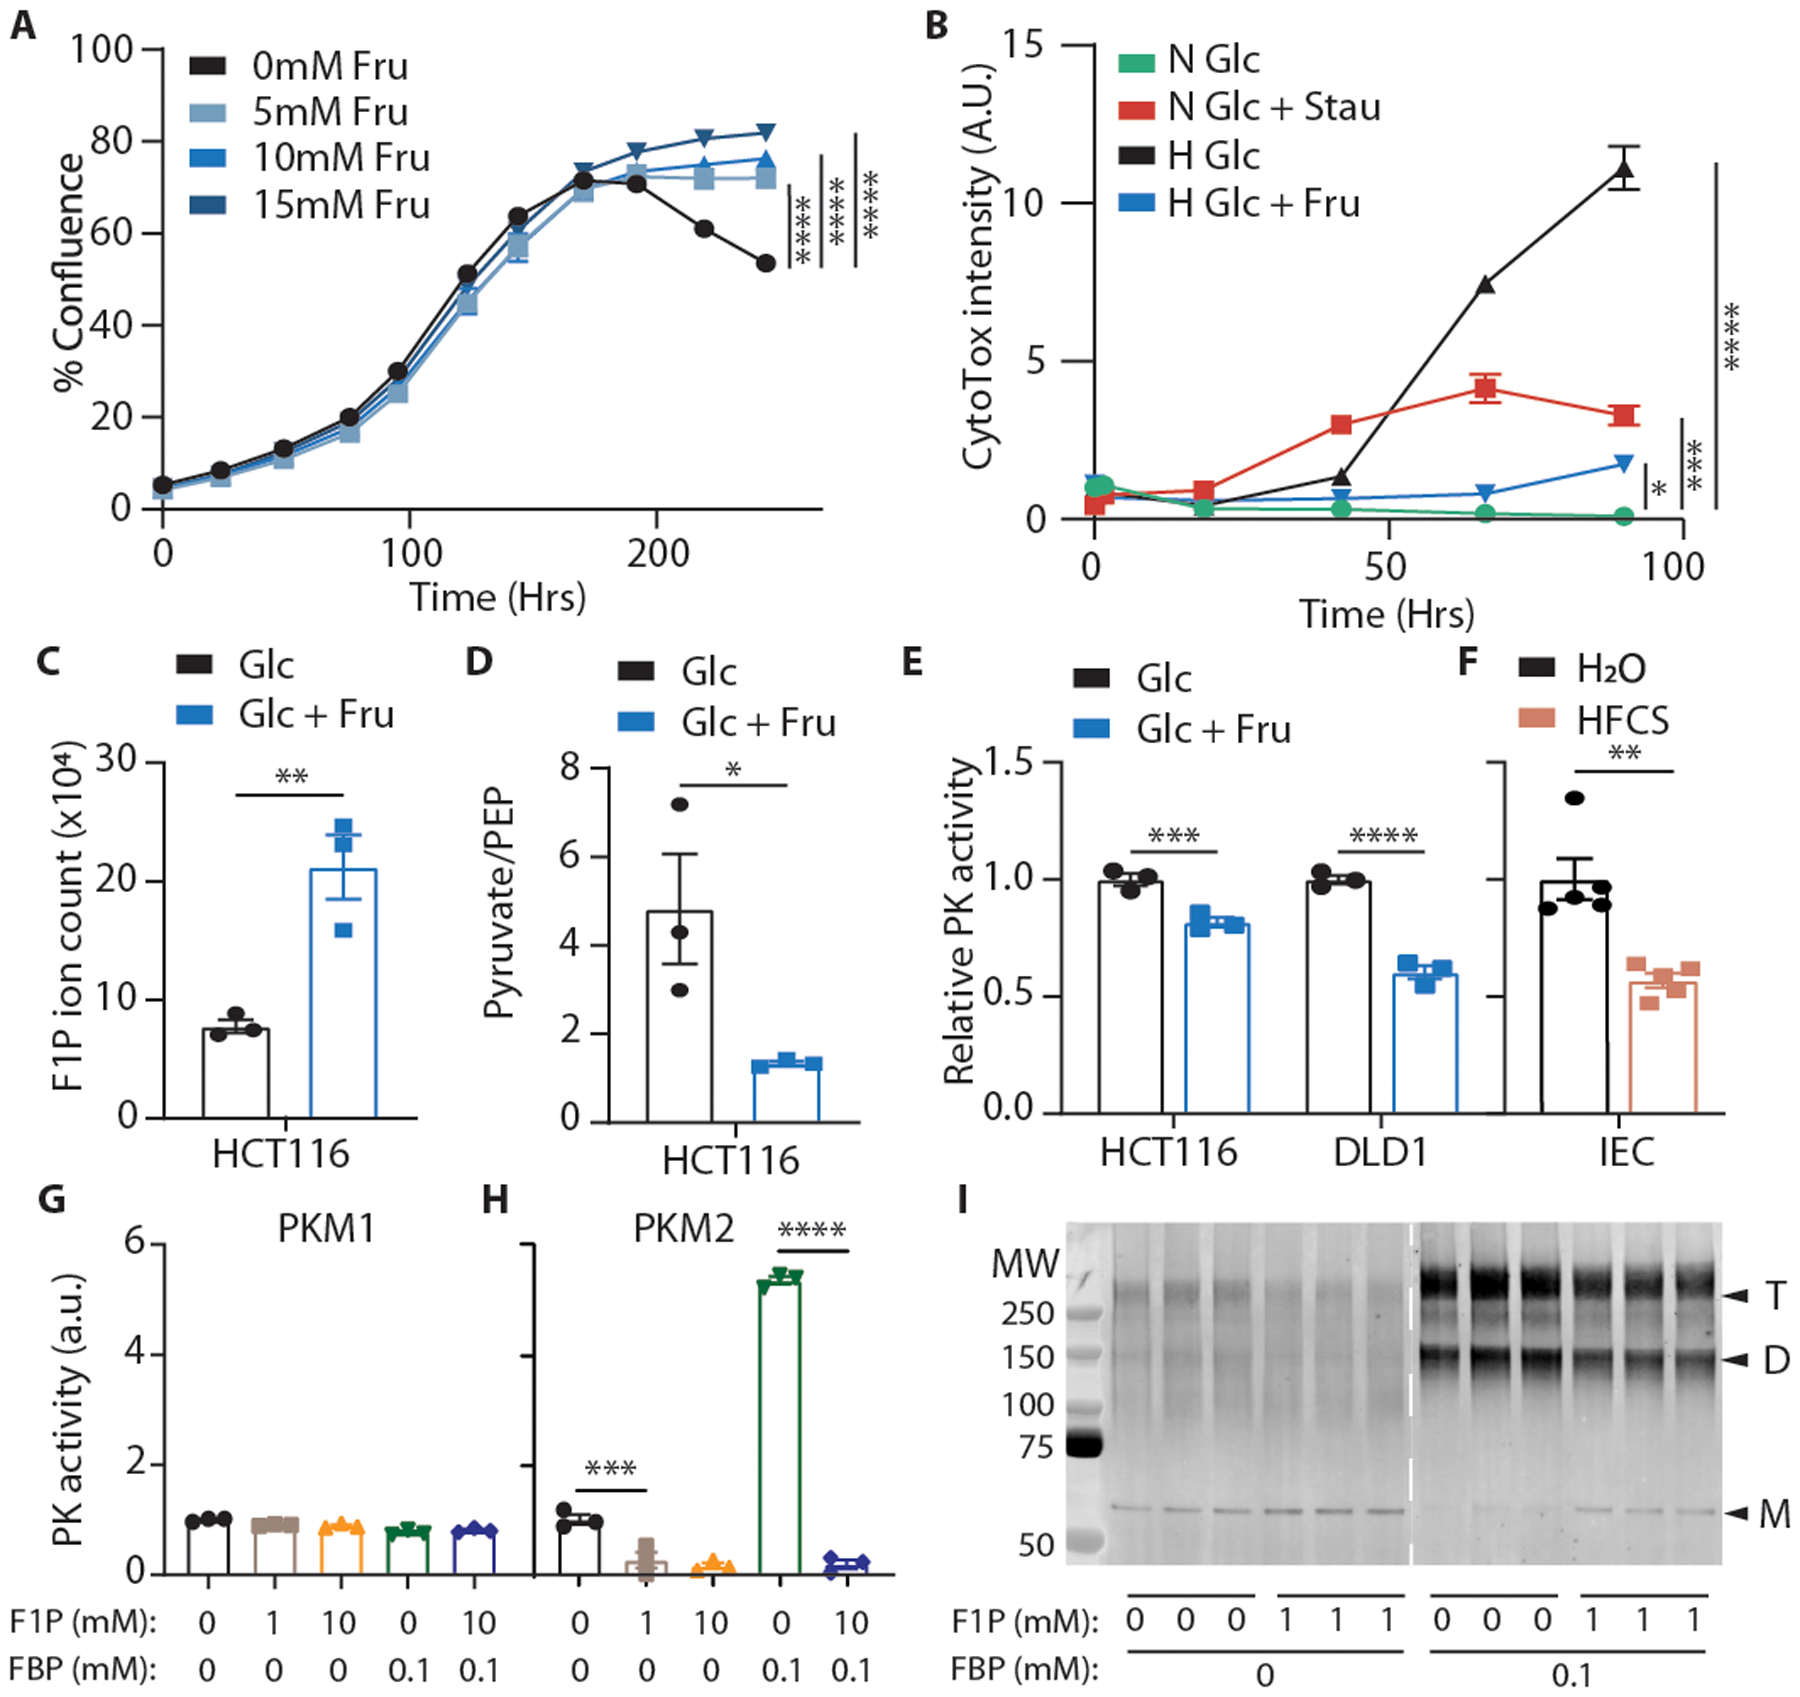
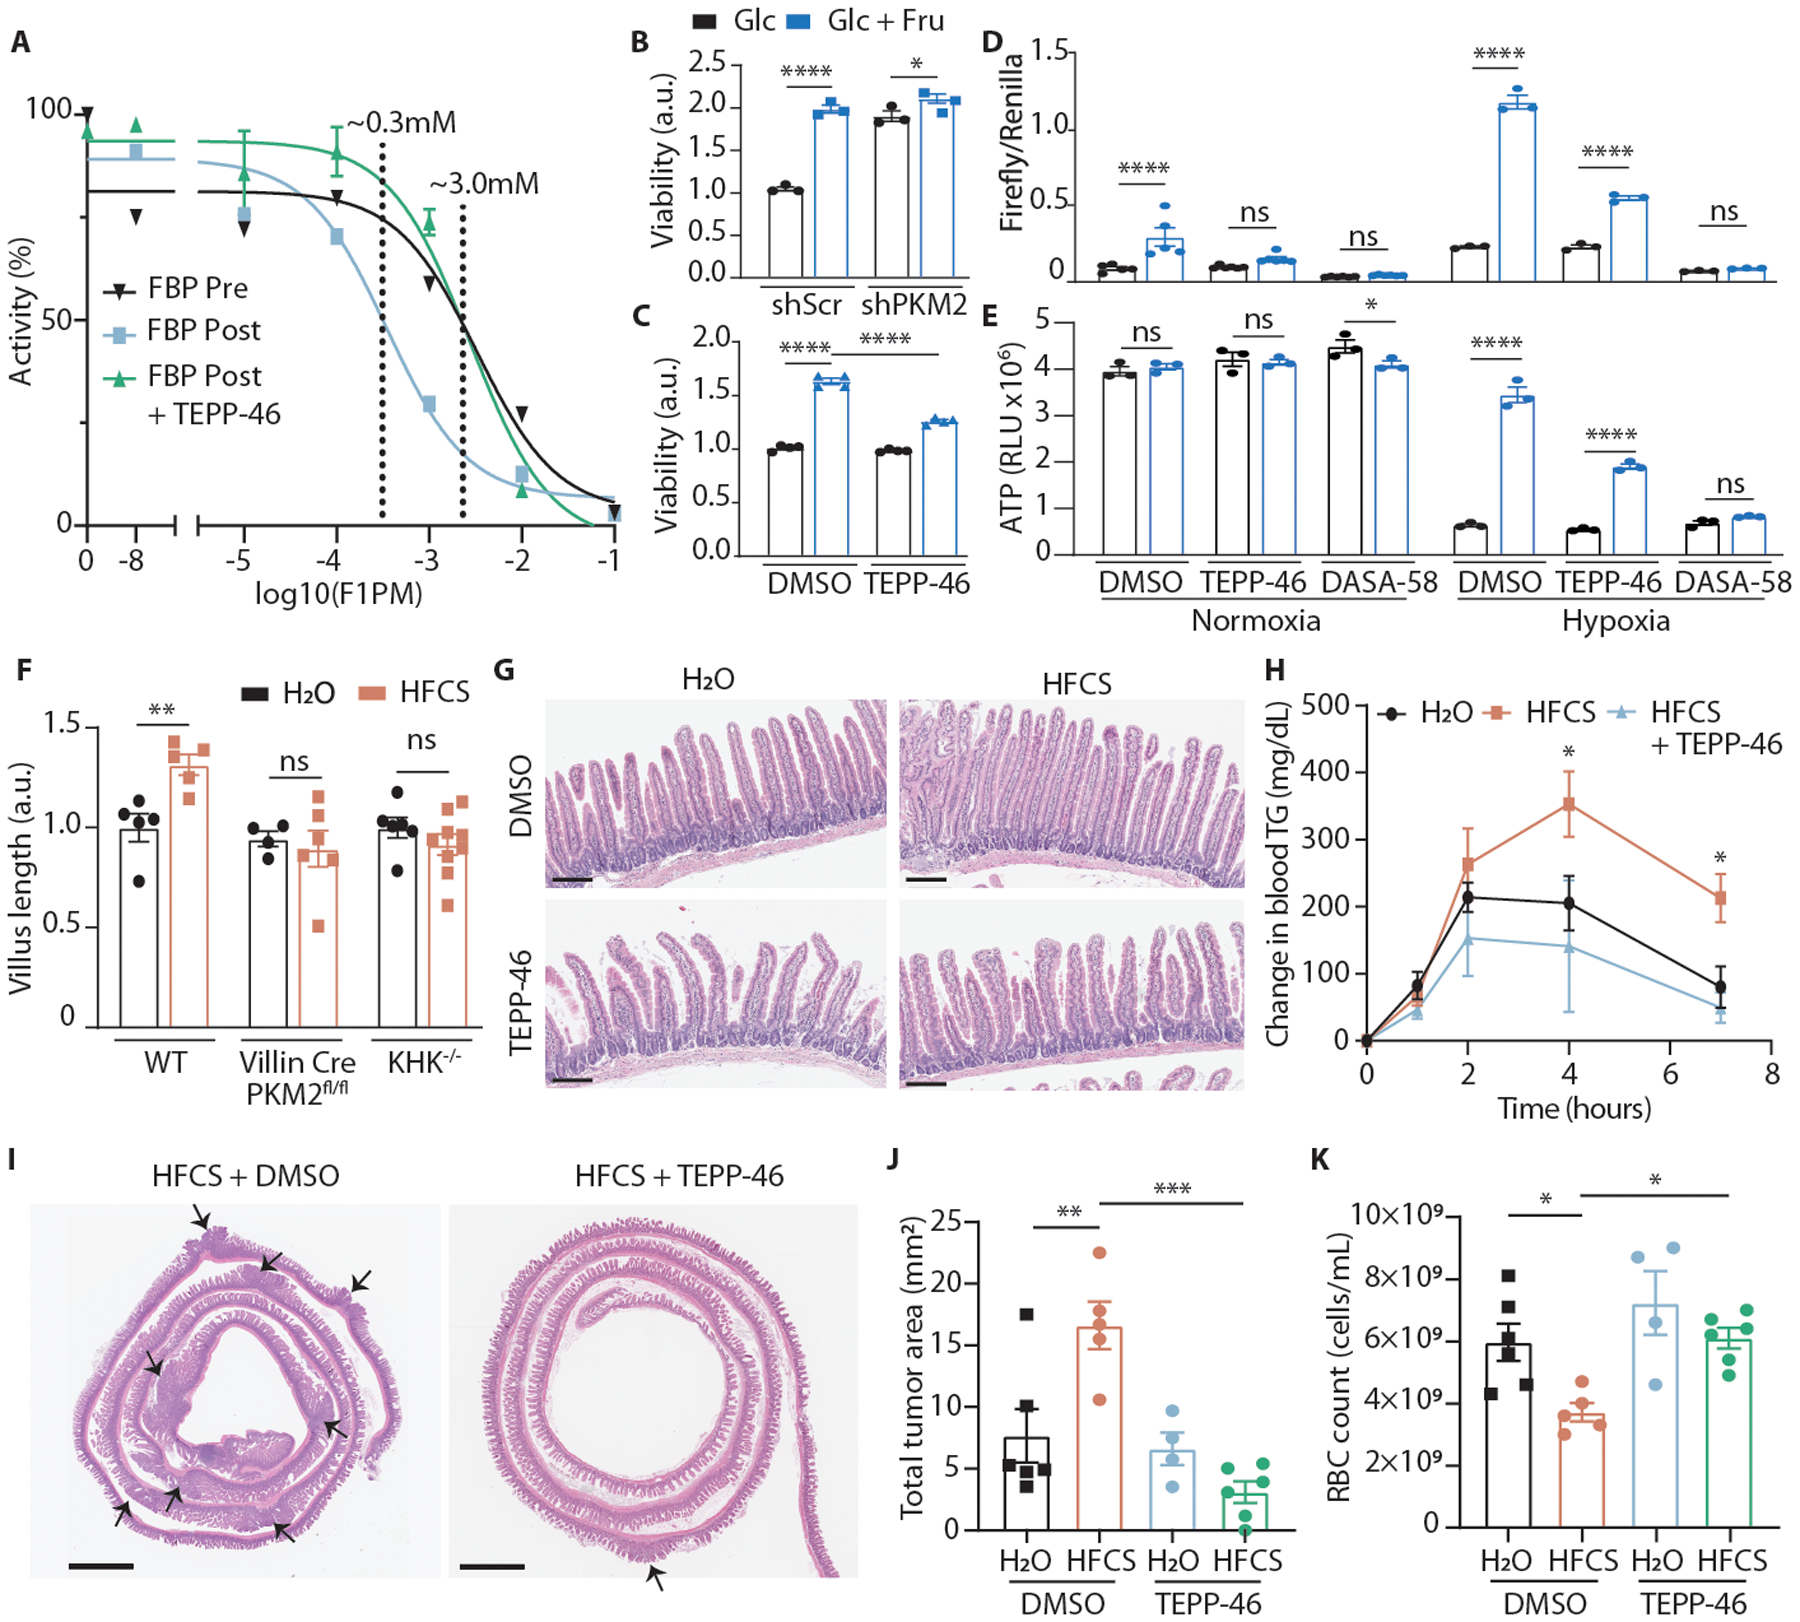
Fructose consumption is linked to the rising incidence of obesity and cancer, which are two of the leading causes of morbidity and mortality globally1,2. Dietary fructose metabolism begins at the epithelium of the small intestine, where fructose is transported by glucose transporter type 5 (GLUT5; encoded by SLC2A5) and phosphorylated by ketohexokinase to form fructose 1-phosphate, which accumulates to high levels in the cell3,4. Although this pathway has been implicated in obesity and tumour promotion, the exact mechanism that drives these pathologies in the intestine remains unclear. Here we show that dietary fructose improves the survival of intestinal cells and increases intestinal villus length in several mouse models. The increase in villus length expands the surface area of the gut and increases nutrient absorption and adiposity in mice that are fed a high-fat diet. In hypoxic intestinal cells, fructose 1-phosphate inhibits the M2 isoform of pyruvate kinase to promote cell survival5-7. Genetic ablation of ketohexokinase or stimulation of pyruvate kinase prevents villus elongation and abolishes the nutrient absorption and tumour growth that are induced by feeding mice with high-fructose corn syrup. The ability of fructose to promote cell survival through an allosteric metabolite thus provides additional insights into the excess adiposity generated by a Western diet, and a compelling explanation for the promotion of tumour growth by high-fructose corn syrup.


Figures

Extended Data Fig. 1.
Extended Data Fig. 1.. Image segmentation avoids pitfalls of manual villi measurement
(A) Stain-normalized H&E images of swiss-rolled intestines were loaded into image-analysis software, which was used to manually measure the length of the gut section (dotted black line). (B) Image-segmentation isolates villi (white) while excluding other tissues such as lymph nodes, pancreas, and intestinal crypts. (C) Intraoperator variation is a source of measurement error in manual villi measurements. X and Y axes represent measurements taken by the same analyst at different times. (D) Interoperator variation is another source of measurement error in manual villi measurements. X and Y axes represent measurements taken by different analysts. (E, F) Intraoperator and interoperator variation are minimized when using the semi-automated protocol. (E, F) are the same comparisons as (C, D), however the only manual measurement in the semi-automated method is the measurement of the whole gut section length. (G) Automated and manual measurements correlate. X and Y axes represent measurements obtained from the manual and semi-automated protocols respectively. (H) Mice from various genetic backgrounds were fed HFCS and the mean villus length in the duodenal intestinal epithelium was measured using a custom analysis algorithm (mice per group, left to right (H2O|HFCS): 4|5 5|5 10|10 10|10 9|5). C-G: Each point represents a distinct image; dotted line: unity; R2 is displayed for the linear regression fit of the data. H: Two-way ANOVA followed by Holm-Sidak post-test for multiple comparisons; *p<0.05, **p<0.01, ***p<0.001, error bars represent ± S.E.M. See source data for exact p-values for all figures.
Extended Data Fig. 2.
Extended Data Fig. 2.. Dietary fructose promotes weight gain and adiposity independent from caloric intake
(A) Mice fed normal chow with or without 25% HFCS ad libitum were weighed weekly for 6 weeks. (B-D) Total body lean and fat mass was measured before and 5 weeks after mice were placed on diets. (E-G) Total consumption of chow and fluid was measured weekly to calculate caloric consumption (n = 5 serial measurements per group). (H, I) Tissues from mice on the indicated diets were harvested and weighed and the liver was assayed for triglyceride content. WAT = white adipose tissue from the left or right gonadal fat depot. (J) After 5 weeks, mice were fasted and blood glucose was measured by glucometer (A-J: 5 mice per group). (K) A lipid tolerance test was performed on wild-type (WT) female mice fed HFCS (n = 3 mice per group). (L) Mice treated with water or HFCS were fasted and then given an I.P. injection of poloxamer 407. 1 hour later TG was measured from serum and the mice were given an oral olive oil bolus. 2 hours later, serum triglyceride levels were measured again (n = 7 (H2O) and 5 (HFCS) mice per group). (M) Mice fed fructose-free control diets (control) high-fat diets consisting of 45% kcal from fat (HF) and high fat diets with sucrose in place of glucose as the main sugar (HFHS) were monitored weekly for chow consumption by cage (n = 3 repeated measurements per group). (N) Total fat and lean body mass were measured after 5 weeks on diet. Statistical comparisons are made against control fat mass (n = 5 mice per group). (O) After 4 weeks on diet, mice were fasted and blood glucose was measured via glucometer (n = 3 mice per group). (P-R) Upon sacrifice, tissues were harvested and weighed, liver tissue was homogenized and assayed for triglyceride content, and mouse intestines were excised en bloc and intestinal length was measured using ImageJ software (n = 5 (P, R) and 4 (Q) mice per group). (S) Mice treated with high-fat or high-fat high-sucrose diets for 2 weeks were housed in metabolic cages and food intake over 24 hours was measured. O2 consumption and CO2 production were measured to calculate the respiratory exchange ratio (T). Total distance traveled was also measured (U), as was hourly energy expenditure (V), which was calculated using the Weir equation. (W-Z) Mice were individually housed and fecal matter was collected over a 24 hour period (W), dried (X), then analyzed via bomb calorimetry to measure energy content and energy loss over the collection period (Y, Z) (S-Z: 4 mice per group). B, C, H, N: Two-way ANOVA followed by Holm-Sidak post-test for multiple comparisons; D-G, I, J, L, S-U, W-Z: Student’s two-sided t-test; K, M, O, Q: One-way ANOVA followed by Holm-Sidak post-test for multiple comparisons; ns: not significant; *P<0.05, **P<0.01, ***P<0.001, ****P<0.0001; all data represent means ± S.E.M.
Extended Data Fig. 3.
Extended Data Fig. 3.. HFCS increases villus survival, GLUT5, and HIF target protein expression
(A) A model depicting the strategy of the bromo-deoxyuridine (BrdU) tracing experiment. BrdU labels cells synthesizing DNA (brown). These cells transit up the length of the villus and away from richly oxygenated blood in 3–4 days. Unlabeled cells beyond the BrdU front at the time of animal sacrifice were thus generated prior to BrdU injection. (B) Duodenal villus length was measured from H&E images from H2O and HFCS-treated mouse intestine (n = 3 mice per group, 40 villi per mouse). (C) Mice were administered BrdU 72Hrs prior to sacrifice, then intestines were examined by IHC. The length of BrdU-labeled regions of the villus were measured in both treatment groups and this length was divided by the interval between injection and sacrifice to yield migration rate (n = 3 mice per group, 15–20 duodenal villi per mouse). (D-E) In a separate experiment, mice were treated with H2O or HFCS and given BrdU (green) 48 hours prior and EdU (red) 24 hours prior to sacrifice. Duodenal villi were then stained and imaged via IF and analyzed as in (C). The difference between the BrdU and EdU lengths was divided by the interval between injections to yield the migration rate (n = 3 (H2O) and 4 (HFCS) mice per group, 15–20 duodenal villi per mouse, scale bar: 100μm). (F) Mice treated with H2O or 25% HFCS were euthanized and the intestines were examined by IHC against ki67, cleaved-caspase 3, and Terminal deoxynucleotidyl transferase dUTP nick end labeling (TUNEL); scale bar: 200μm. (G) Prior to sacrifice, mice treated as in (F) were injected with pimonidazole to label tissue hypoxia. Intestines were then fixed and examined for pimonidazole intensity by IHC. Representative images shown; scale bar: 500μm. (H) Pimonidazole positive area was quantified and normalized to total small intestine (SI) area (n = 5 mice per group). (I) WT mice treated with H2O or HFCS and total-body, constitutive GLUT5 KO mice treated with HFCS were sacrificed and intestines were fixed and examined by IHC. Representative images shown; upper scale bar: 200μm, lower scale bar: 50μm. (J) WT mice treated with H2O or 25% HFCS ad libitum for 4 weeks were sacrificed and intestinal epithelium was harvested for western blot for indicators of cell health including markers of energy homeostasis (pACC, pAMPK) and anti-apoptotic proteins (BCL2, BCL-XL, MCL-1). (K) Animals treated as in (J) were also sacrificed and the intestinal epithelium was examined by western blot for hypoxia response proteins (ENO1, LDHa) and KHK. B, C, E, H: two-sided student’s T-test; ns: not significant; ***P<0.001; all data represent means ± S.E.M. For gel source data, see Fig. S1 in the supplement.
Extended Data Fig. 4.
Extended Data Fig. 4.. Fructose enhances hypoxic cell survival
(A) At the conclusion of the experiment depicted in Fig. 2A, HCT116 cells were harvested and analyzed by trypan blue exclusion assay. Total live cells per group were counted and normalized to the fructose-free group. (n = 3 biological replicates per group) (B, C) HCT116 cells were plated near confluence and cultured in hypoxia with or without 10mM fructose in the media. Every 48 hours, as indicated, the media was exchanged with fresh oxygen-equilibrated media. Confluence was monitored and at the conclusion of the experiment cells were analyzed by trypan blue exclusion assay as in (A) (n = 3 biological replicates per group). (D) HCT116 or (E, F) DLD1 cells were cultured with glucose and either stausporin (“Stau”, 100nM, apoptotic control) or fructose, in media which also contained an AnnexinV dye (D, E) and a nucleic acid binding cell death dye (F, “CytoTox”). Cells were incubated in normoxia (“N”) or hypoxia (“H”) and imaged daily via live cell imaging. Stain intensity is reported as positive cell area per well normalized to the initial normoxic glucose control (n = 3 biological replicates per data point). (G) Intestinal organoids were generated from adult B6J mice and cultured in hypoxia with or without fructose for 72 hours. At experiment termination, organoids were pulsed with EdU, fixed in situ, stained for the indicated targets, and examined via confocal microscopy. Representative images are shown. Scale bar: 50μm; white arrows indicate regions with intra-organoid CC3 puncti. (H, I) organoids treated as in (G) were rapidly dissociated and stained for viability (via a membrane impermeable dye) and EdU. The resulting cell suspensions were analyzed by flow cytometry. Viability is expressed as viable cells recovered per culture well, normalized to the average of the normoxic glucose controls (n = 3 progenitor mice; each pair of points represents a different mouse progenitor). In these and future in-vitro assays, unless otherwise noted, glucose was replenished daily as described in methods. A, D, H: One-way ANOVA followed by Holm-Sidak post-test for multiple comparisons; B, C: two-sided student’s T-test; *p<0.05, **p<0.01, ****p<0.0001; all data represent means ± S.E.M.
Extended Data Fig. 5.
Extended Data Fig. 5.. Hypoxia increases GLUT5 expression, KHKA transcription
(A) HCT116 and DLD1 cells cultured at the indicated O2 concentrations with or without 10mM fructose were lysed at 36 hours and western blotted for the indicated targets. “+” in the “%O2” row indicates that 100μM cobalt chloride was added to the media at time 0. (B) RNA was extracted from HCT116 cells treated in normoxia or hypoxia for 24 hours and analyzed by IsoSeq. The relative proportion of the A and C isoforms of KHK are shown (n = 1 biological replicate per O2 condition). (C) HCT116 cells cultured in normoxia or hypoxia for 24 hours were lysed and tested for KHK activity via enzymatic assay (n = 3 biological replicates). C: two-sided student’s T-test; ** p<0.01; all data except B represent means ± S.E.M. For gel source data, see Fig. S1 in the supplement.
Extended Data Fig. 6.
Extended Data Fig. 6.. F1P accumulates in cells and correlates with marked metabolic changes in hypoxia
(A) HCT116 cells cultured in hypoxia with fructose were labeled with various U-13C metabolites and intracellular metabolites were detected via LC-MS. The Y-axis reflects the fraction of the detected metabolite labeled with 13C on the number of carbons denoted by the colors to the right of each graph. The X-axis denotes the labeled feed-metabolite for that particular group. The graph for fructose, for example, indicates that all detected fructose ions were labeled at all 6 carbons with 13C when U-13C6 fructose was provided in the media (n = 3 biological replicates per unique label). (B) HCT116 and DLD1 cells were cultured in hypoxia with 25mM glucose with or without 10mM fructose. At 48 hours the growth media was assayed for glucose and fructose content. Colors indicate the initial media formulation for each group. The X-axis denotes which sugar is being measured (n = 3 (Glc) and 2 (Glc + Fru) biological replicates per group). (C) Mouse intestinal organoids were cultured in hypoxia with 10mM glucose with or without 10mM fructose for 72 hours. Glucose in the 3mL culture volume was increased by 5mM daily to account for glucose depletion. After 72 hours the growth media was assayed for sugar content (n = 3 biological replicates per group, 1 from each progenitor mouse). (D) HCT116 cells were treated with uniformly labeled 13C fructose or glucose and isotopologues for intracellular fructose were generated. Unless otherwise noted, each column represents an experimental group which received some form of glucose and fructose (n = 3 biological replicates per x-axis label; N: normoxia, H: hypoxia). (E) Principal component analysis and (F) targeted heatmap of metabolomics data from HCT116 cells cultured at confluence in hypoxia for 36 hours then harvested for LC-MS. PCA data are centered and unit-variance scaled, heatmap data are row-normalized ion abundances (n = 3 biological replicates per group, loading plots available in supplement). (G) PK activity was measured via enzymatic assay in lysates from HCT116 cells cultured in normoxia or hypoxia for 24 hours with or without fructose. Assay wells were loaded with equal amounts of total protein for each group (n = 3 biological replicates per group). F1P: fructose 1-phosphate; FBP: fructose 1, 6-bisphosphate; G6P: glucose 6-phosphate; G3P: glyceraldehyde 3-phosphate; 2PG: 2-phosphoglycerate; PEP: phosphoenolpyruvate; TCA: tri-carboxylic acid cycle; aKG: alpha-ketoglutarate; PA: phosphatidic acid; MG: monoacylglycerol; DG: diacylglycerol; G: Two-way ANOVA followed by Holm-Sidak post-test for multiple comparisons; *P<0.05; all error bars represent means ± S.E.M.
Extended Data Fig. 7.
Extended Data Fig. 7.. The FBP-binding pocket of PKM2 is important for F1P inhibition
(A) Simulated binding positions and residue interactions for FBP (left) and F1P (right) in the allosteric binding pocket of PKM2. Residues 482 and 489 are components of the FBP-activation loop which are predicted to interact with FBP but not F1P 25. (B) Purified recombinant PKM2 (rPKM2) was incubated with the indicated metabolites and separated through a sucrose gradient (also containing the indicated metabolites). Fractions were removed from the gradients and analyzed via SDS-PAGE and western blot for PKM2. FBP concentration was 100uM; F1P concentration was 500uM. (C) Recombinant PKM2 incubated with the indicated metabolites was run on a gel filtration column and subjected to SDS-PAGE and Coomassie blue staining. FBP concentration during incubation and in the column was 100uM; F1P concentration was 500uM. (D, E) The activity of recombinant PKL and the PKM2 R489L mutant pre-incubated with the indicated metabolites was measured via enzymatic assay (n = 3 independent reaction wells per group). The residues responsible for PKM2 binding FBP are altered in these isoforms. (F-H) Recombinant PKM2 mutants with alterations to the FBP-binding pocket were generated and assayed for PK activity with the indicated metabolites added at the incubation step. FBP was used at 100μM and F1P was used at 1mM (n = 2 wells per data point). (I) The activity of recombinant PK pre-incubated concurrently with the indicated metabolites or compounds was measured via enzymatic assay (n = 3 wells per group). D, E: One-way ANOVA followed by Holm-Sidak post-test for multiple comparisons. *P<0.05, **P<0.01, ***P<0.001; error bars represent means ± S.E.M. For gel source data, see Fig. S1 in the supplement.
Extended Data Fig. 8.
Extended Data Fig. 8.. Fructose and PK activation modulate cell survival in hypoxia
(A) HCT116 cells were transduced with short-hairpin RNA targeting a scrambled sequence (shScr) or PKM2 (shPKM2). 2 weeks after transduction, parental cells as well as these modified lines were western blotted for the protein targets indicated on the left. 3 separate shScr and shPKM2 subclones were analyzed. Mouse gastrocnemius (Gastroc.) muscle and liver tissue were used as PKM1 and PKLR controls respectively. B-actin was used as a loading control. (B) HCT116 cells expressing the indicated hairpins were cultured in normoxia or hypoxia with or without fructose and TEPP-46 (50μM) in the media. Glucose was replenished daily, and confluence was monitored by live cell imaging (n = 3 biological replicates per group). (C) shScr or shPKM2-transduced HCT116 cells were cultured in hypoxia for 24 hours with or without fructose or fructose and TEPP-46 (50μM). Total cell H2O2 was then measured using a luciferase-based assay (n = 4 biological replicates per group). (D) Parental HCT116 cells were subjected to the same treatment as in (C) but were cultured for 72 hours in normoxia or hypoxia with daily glucose replenishmen (n = 4 biological replicates per group). (E) HCT116 cells cultured in hypoxia for 24 hours were assayed for reduced thiols (n = 5 biological replicates per group). (F) HCT116 cells cultured in hypoxia were provided with 10mM glucose, 10mM glucose with N-acetylcysteine (NAC) or 5mM glucose and 5mM fructose in media. After 144 hours the viability of the adherent cells was measured (n = 4 biological replicates per group). (G) HCT116 and DLD1 cells were subjected to varying levels of hypoxia for 24 hours with fructose introduced in the media either at the time the cells were placed in hypoxia (“+”) or as pre-treatment (“PT+”), starting in the previous cell passage prior to plating the experiment and continuing through the hypoxic period (4 days total fructose exposure with the final 24 hours in hypoxia). Cells were rapidly lysed at the conclusion of the experiment and analyzed by western blot. (H) HCT116 cells were exposed to hypoxia with or without fructose in the media and LC-MS analysis was performed on the resulting polar extracts (n = 3 biological replicates per group). (I) HCT116 cells were cultured in normoxia or hypoxia for 24 hours with or without fructose. At the end of the experiment, media samples were taken from each well and analyzed via enzymatic assay for lactate content (n = 3 biological replicates per group). C, D, I: Two-way ANOVA followed by Holm-Sidak post-test for multiple comparisons; E: Student’s two-sided t-test; F: One-way ANOVA followed by Holm-Sidak post-test for multiple comparisons; ns: not significant, *P<0.05, **P<0.01, ***P<0.001, ****P<0.0001; all data represent means ± S.E.M where possible. For gel source data, see Fig. S2 in the supplement.
Extended Data Fig. 9.
Extended Data Fig. 9.. PKM2 ablation in villi results in PKM1 upregulation
(A) Representative intestines from 12-week-old mice examined by IHC for the indicated targets (scale bar = 200μm). (B) Mouse intestinal epithelial cell lysates from wild-type mice (WT), VillinCre;PKM2fl/fl mice, and WT mice treated with TEPP-46 were analyzed via enzymatic assay for pyruvate kinase activity (mice per group, left to right: 5|10|5; same final protein concentration in each reaction well). (C) WT and VillinCre;PKM2fl/fl mice were sacrificed and intestines were fixed and examined by IHC against PKM2 or PKM1, respectively. The left column shows proximal jejunum villi in each animal while the next two columns are high magnification of the distal and proximal villus in each animal. The last column is colon epithelium. Blue arrows indicate nuclei with intense staining. Scales for each row are as indicated. (D) WT, KHK KO, and intestinal PKM2 KO mice were treated with H2O or HFCS and the intestinal epithelium was examined by western blot. (E, F) LDHa and ENO1 intensity were quantified relative to the b-Actin loading control (mice per group, left to right: 3|3|3|3|2|5). (G) Serum triglyceride (T.G.) following a lipid challenge was measured in mice fed water (H2O) or 25% HFCS via daily oral gavage for 2 weeks. Units are normalized to the initial timepoint to highlight changes in blood T.G. after the bolus (mice per group, top to bottom: 7|6|5|5). (H) After 2 weeks on diet mice were euthanized, and the gonadal fat deposits were weighed. Units represent total gonadal depot fat mass as a percentage of total body mass, normalized to H2O animals (mice per group, left to right: 14|14|10|5|4|5|5). (I) Liver was also harvested and analyzed for T.G. content per gram tissue (mice per group, left to right: 4|4|4|5|4|5|4). B, H: one-way ANOVA followed by Holm-Sidak post-test for multiple comparisons; E, F: two-way ANOVA followed by Holm-Sidak post-test for multiple comparisons; ns: not significant, *P<0.05, **P<0.01; all data represent means ± S.E.M. For gel source data, see Fig. S2 in the supplement.
Extended Data Fig. 10.
Extended Data Fig. 10.. TEPP-46 ablates HFCS-induced villus elongation, tumor growth
(A) WT mice provided with a daily oral gavage of HFCS or H2O mixed with DMSO or TEPP-46 were sacrificed after 10 days. Intestines were harvested and analyzed for mean villus length. (B) Villi measurements for those same sections (n = 5 mice per group). (C) Mice were treated with normal chow and either water for two weeks, 25% HFCS daily gavage for two weeks, or HFCS for two weeks followed by HFCS with TEPP-46 (2mg/kg/day) for another two weeks. At the conclusion of these treatments, the animals were sacrificed and small intestine villus length was examined (n = 5 mice per group). (D) Mice were fed the indicated diets via oral gavage for 2 weeks and serum TG content was measured during the fasted state (mice per group, left to right: 8|8|5). (E) Violin plot of gene expression data from GTEX (normal human colon epithelium) and TCGA (human colon adenocarcinoma) are displayed for PKM. (F) Patient samples of colon tumor (“T”) and matched normal epithelium (“N”) were lysed and analyzed by western for PK isoform expression and hypoxia markers. Mouse liver and gastrocnemius are included as controls. (G) PK activity was measured in patient sample lysates before and after incubation with PK activator, and the ratio of initial vs activated activity is shown (tumor and adjacent normal tissue pairs from n = 11 patients). (H-J) Single channels and composite image of normal diet-treated APCQ1405X intestinal tumors stained with DAPI, anti-CC3, and anti-pimonidazole and examined via immunofluorescence. (K-N) Fly-out panels depicting areas of CC3 and pimonidazole colocalization both along the tumor periphery (K, L) and in the tumor core (M, N). Scale bars as indicated. (O) Normal diet-treated intestinal tumors were also examined by IHC using anti-GLUT5 (scale bar: 200μm). (P) Representative H&E-stained intestinal swiss rolls from APCQ1405X/+ mice treated with the indicated regimens. Arrows indicate tumor; scale bar = 2mm. (Q, R) H&E images of intestinal swill rolls were analyzed for tumor burden. Each tumor in the section was counted and its cross-sectional area measured (mice per group, left to right: 6|5|4|6). B, Q, R: Two-way ANOVA followed by Holm-Sidak post-test for multiple comparisons; C, D: One-way ANOVA followed by Holm-Sidak post-test for multiple comparisons; E, G: two-sided student’s t-test; ns: not significant; **P<0.01, ***P<0.001, ****p<0.0001; all error bars represent means ± S.E.M. For gel source data, see Fig. S2 in the supplement.
Fig. 1.
Fig. 1.. Dietary fructose increases intestinal villus length and lipid absorption
(A) H&E-stained duodenum from animals fed normal chow with ad libitum water or 25% high-fructose corn syrup for 4 weeks. (B) Relative change in body mass of mice fed control, high-fat (45% kcal fat), or high-fat high-sucrose chow (control, HF: n = 5 mice, HFHS: n = 4 mice). (C) Mass of white adipose tissue from the gonadal depot after 5 weeks on each diet (n = 5 mice per group, 2 depots per mouse). (D) Relative duodenal villus length after 5 weeks on each diet (n = 5 mice per group). (E) Serum triglyceride levels in fasted mice following an oral olive oil gavage (n = 3 animals per group). (F) BrdU immunohistochemistry (IHC) of duodenal sections from H2O or HFCS-treated mice 72 hours after intraperitoneal BrdU injection. (G) Duodenal villus length distal to the BrdU front (n = 3 mice per group, 40 villi per mouse). (H, I) IHC for the indicated targets in duodenal sections from H2O-treated mice. B-E: One-way ANOVA followed by Holm-Sidak post-test for multiple comparisons; G: two-sided student’s t-test. ns: not significant; *p<0.05, **p<0.01, ****p<0.0001; exact P-values are provided in source data for all figures; all data represent means ± S.E.M.
Fig. 2.
Fig. 2.. Fructose metabolism enhances hypoxic cell survival and decreases pyruvate kinase activity
(A) Confluence of HCT116 cells grown in hypoxia with varying concentrations of fructose (n = 3 biological replicates per group). (B) CytoTox viabilty dye intensity in HCT116 cells cultured in glucose media with and without fructose. Stain intensity is reported as positive area per well normalized to the initial normoxic glucose control (n = 3 biological replicates per group; “Stau”: stausporin control, “N”: normoxia, “H”: hypoxia). In these and future cell viability assays, unless otherwise noted, glucose was replenished daily (see methods). (C, D) Metabolites from hypoxic HCT116 cells quantified via LC-MS (n = 3 biological replicates per group). (E, F) Pyruvate kinase activity in hypoxic cell lysates and in intestinal epithelial lysates from mice fed the indicated diets for 4 weeks (n = 3 independent reaction wells per group; same final protein concentration in each well). (G, H) PK activity of recombinant PK isozymes pre-incubated with the indicated metabolites (n = 3 wells per group). (I) Western blot against PKM2 using recombinant PKM2 samples crosslinked with disuccinimidyl glutarate (n = 3 independent reaction wells per group; “T, D, M” indicate putative sizes of tetrameric, dimeric, and monomeric PKM2). A, B, G, H: One-way ANOVA followed by Holm-Sidak post-test for multiple comparisons; C, D, F: two-sided student’s T-test; E: Two-way ANOVA followed by Holm-Sidak post-test for multiple comparisons; *p<0.05, **p<0.01, ***p<0.001, ****p<0.0001; all data represent means ± S.E.M. For gel source data, see Fig. S1 in the supplement.
Fig. 3.
Fig. 3.. PK activation diminishes fructose’s effect on hypoxia survival
(A) PK activity of recombinant PKM2 incubated with varying concentrations of F1P. FBP with or without TEPP-46 was added either before or after F1P. IC50 with FBP pre-F1P-incubation = 3.3mM (95% CI: 1.1–9.6mM); IC50 with FBP post-F1P-incubation = 0.35mM (95% CI: 0.15–0.80mM); IC50 with FBP and TEPP-46 post-F1P-incubation = 2.7mM (95% CI: 1.7–4.4mM). (n = 2 wells per data point for FBP Pre, 4 for FBP Post, 3 for FBP Post + TEPP-46). (B) Viability of HCT116 cells virally transduced with the indicated shRNAs and cultured in hypoxia with or without fructose (n = 3 biological replicates per group). (C) Viability of HCT116 cells cultured in hypoxia with or without fructose and TEPP-46 (n = 4 biological replicates per group). (D) Relative luminesence of HCT116 cells transfected with firefly luciferase HIF-1α reporter (p2.1) and renilla luciferase constitutive reporter (pRL). Luminesence was measured after 24 hours culture in the indicated conditions (n = 6 biological replicates per group for normoxia, 3 for hypoxia). (E) ATP levels in HCT116 cells after culture as above (n = 3 biological replicates per group). (F) Relative duodenal villus length in mice after 4 weeks ad-lib H2O or HFCS. Mean villus length is reported relative to water-treated controls in each genotype (mice per group, left to right: 5|5 5|8 6|9). (G) Duodenal villi of WT mice treated for 4 weeks with the indicated diets (scale bar = 200μm). (H) Serum triglyceride (T.G.) following an oral lipid bolus in mice treated via daily oral gavage for 2 weeks (n = 8 (H2O, HFCS) and 5 (HFCS + TEPP-46) mice per group). (I) Representative intestines from APCQ1405X/+ mice treated with the indicated regimens and euthanized at 15 weeks of age. Arrows indicate tumors; scale bar = 2mm. (J) Total tumor area per histological section of mouse large and small intestine and (K) red blood cell (RBC) count at 15 weeks (mice per group, left to right: 6|5 4|6). B-F, J, K: Two-way ANOVA followed by Holm-Sidak post-test for multiple comparisons; H: two-sided student’s T-test at the 4 and 7Hr timepoints; ns: not significant, *p<0.05, **p<0.01, ***p<0.001, ****p<0.0001; all data represent means ± S.E.M.

Comment in

References

    1. Bray GA, Nielsen SJ & Popkin BM Consumption of high-fructose corn syrup in beverages may play a role in the epidemic of obesity. Am. J. Clin. Nutr 79, 537–543 (2004). - PubMed
    1. Joh H-K et al. Simple Sugar and Sugar-Sweetened Beverage Intake During Adolescence and Risk of Colorectal Cancer Precursors. Gastroenterology S0016–5085(21)00537–0 (2021) doi:10.1053/j.gastro.2021.03.028. - DOI - PMC - PubMed
    1. MILLER M, CRAIG JW, DRUCKER WR & WOODWARD H The metabolism of fructose in man. The Yale journal of biology and medicine 29, 335–60 (1956). - PMC - PubMed
    1. Jang C et al. The Small Intestine Converts Dietary Fructose into Glucose and Organic Acids. Cell Metab. 27, 351–361.e3 (2018). - PMC - PubMed
    1. Anastasiou D et al. Inhibition of pyruvate kinase M2 by reactive oxygen species contributes to cellular antioxidant responses. Science (New York, N.Y.) 334, 1278–83 (2011). - PMC - PubMed

Publication types

MeSH terms