. 2021 Sep;597(7875):239-244.
doi: 10.1038/s41586-021-03837-0. Epub 2021 Aug 18.

Chronic social isolation signals starvation and reduces sleep in Drosophila

Affiliations

Chronic social isolation signals starvation and reduces sleep in Drosophila

Wanhe Li et al. Nature. 2021 Sep.

Abstract

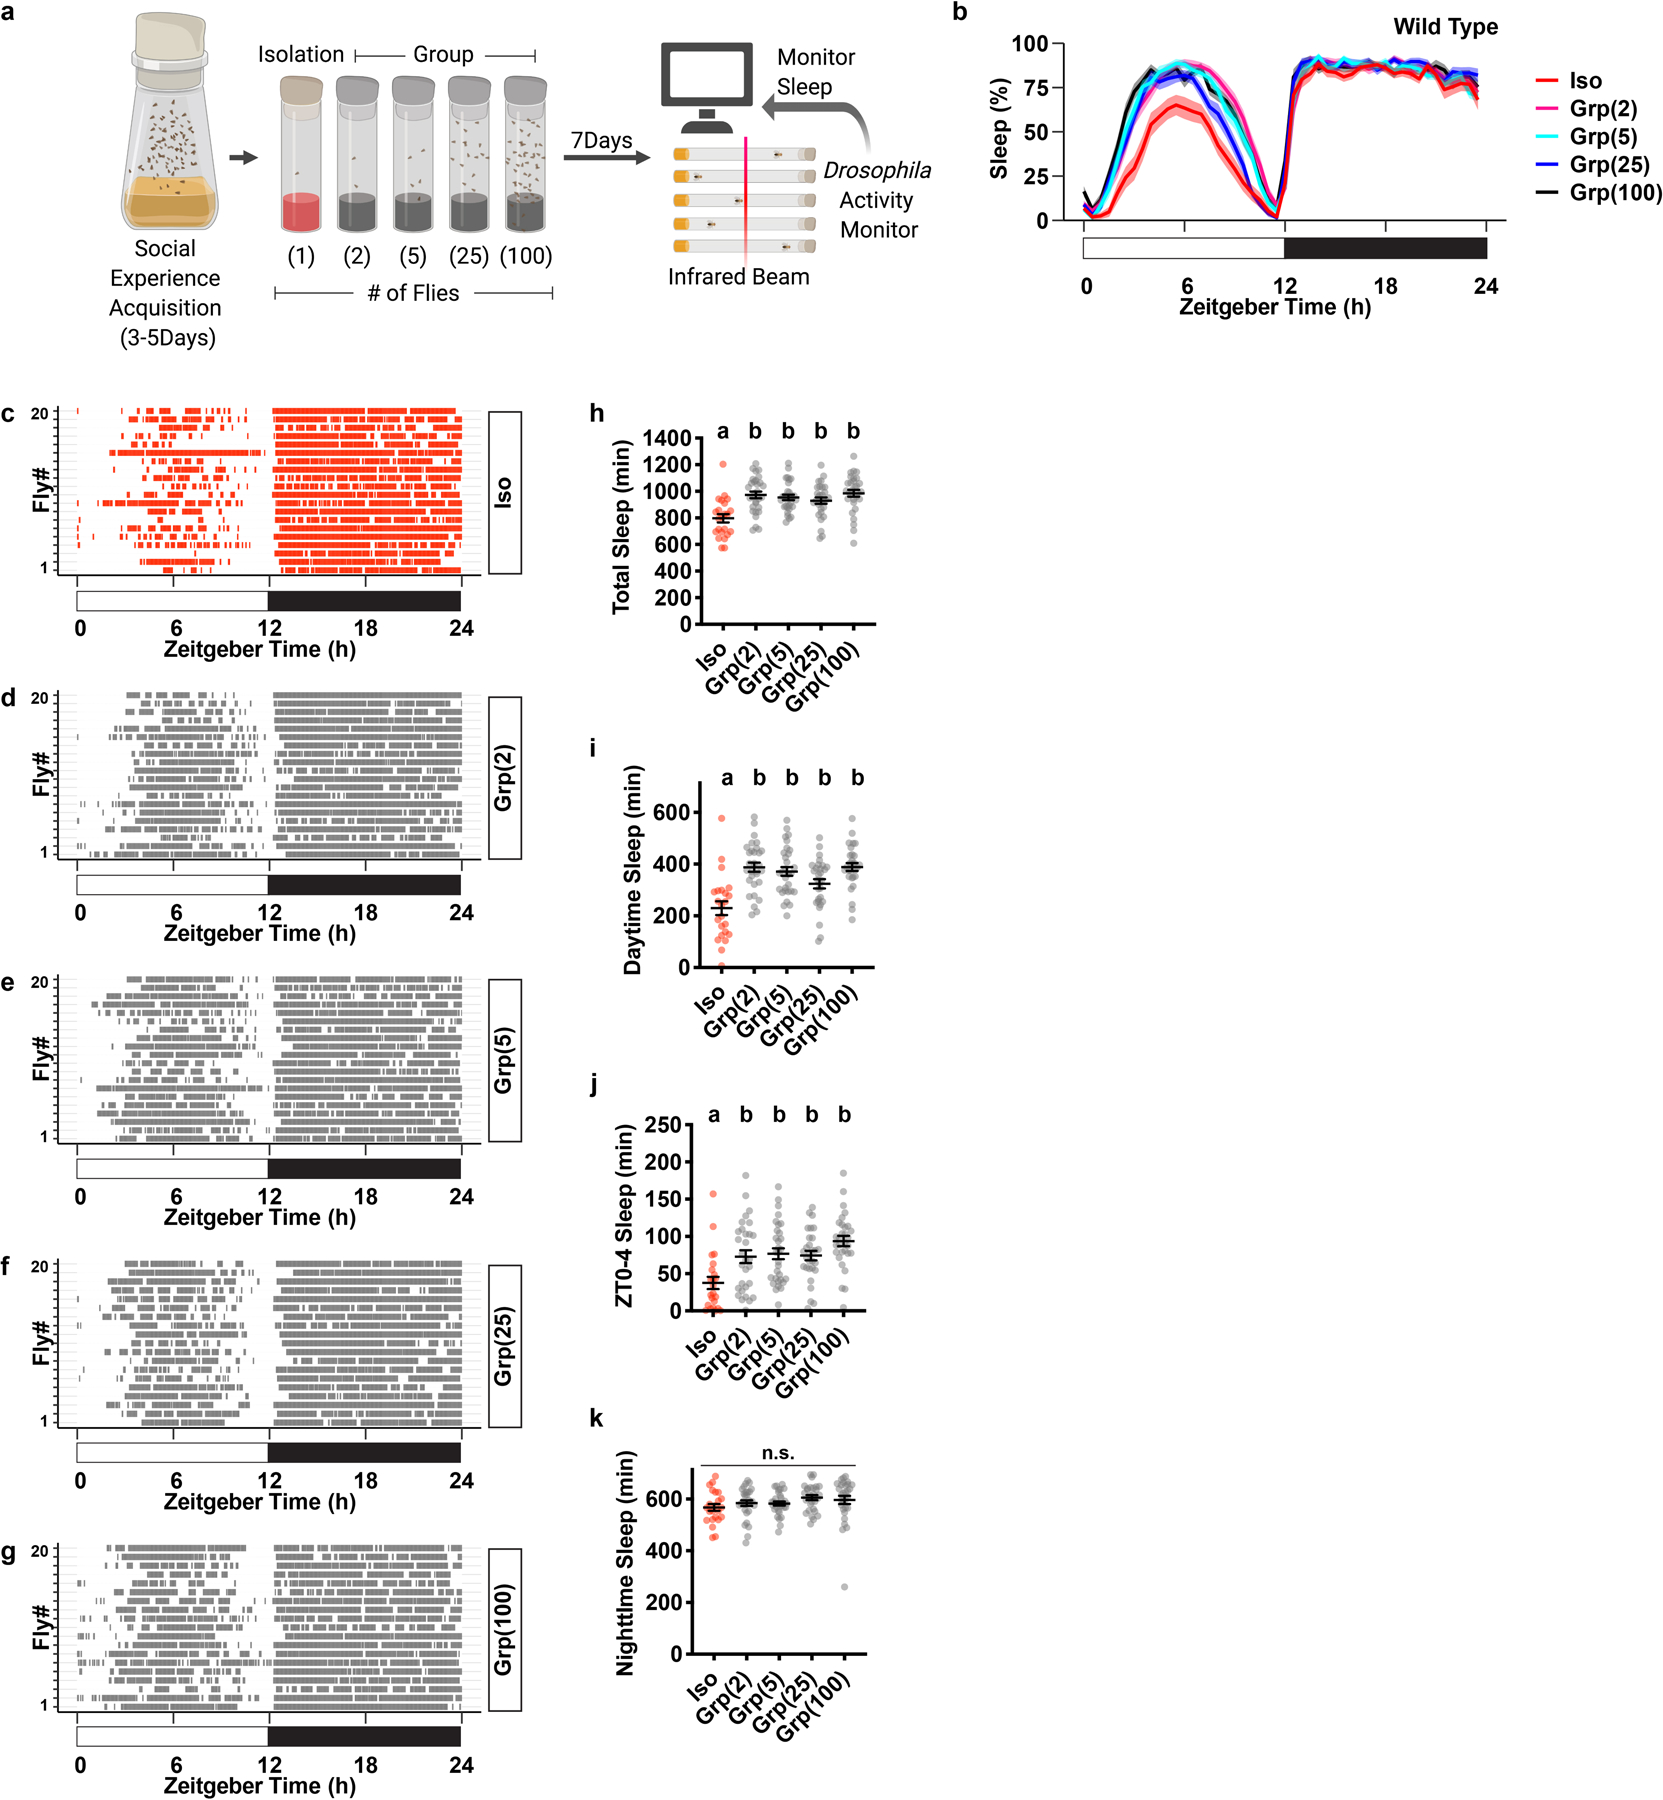
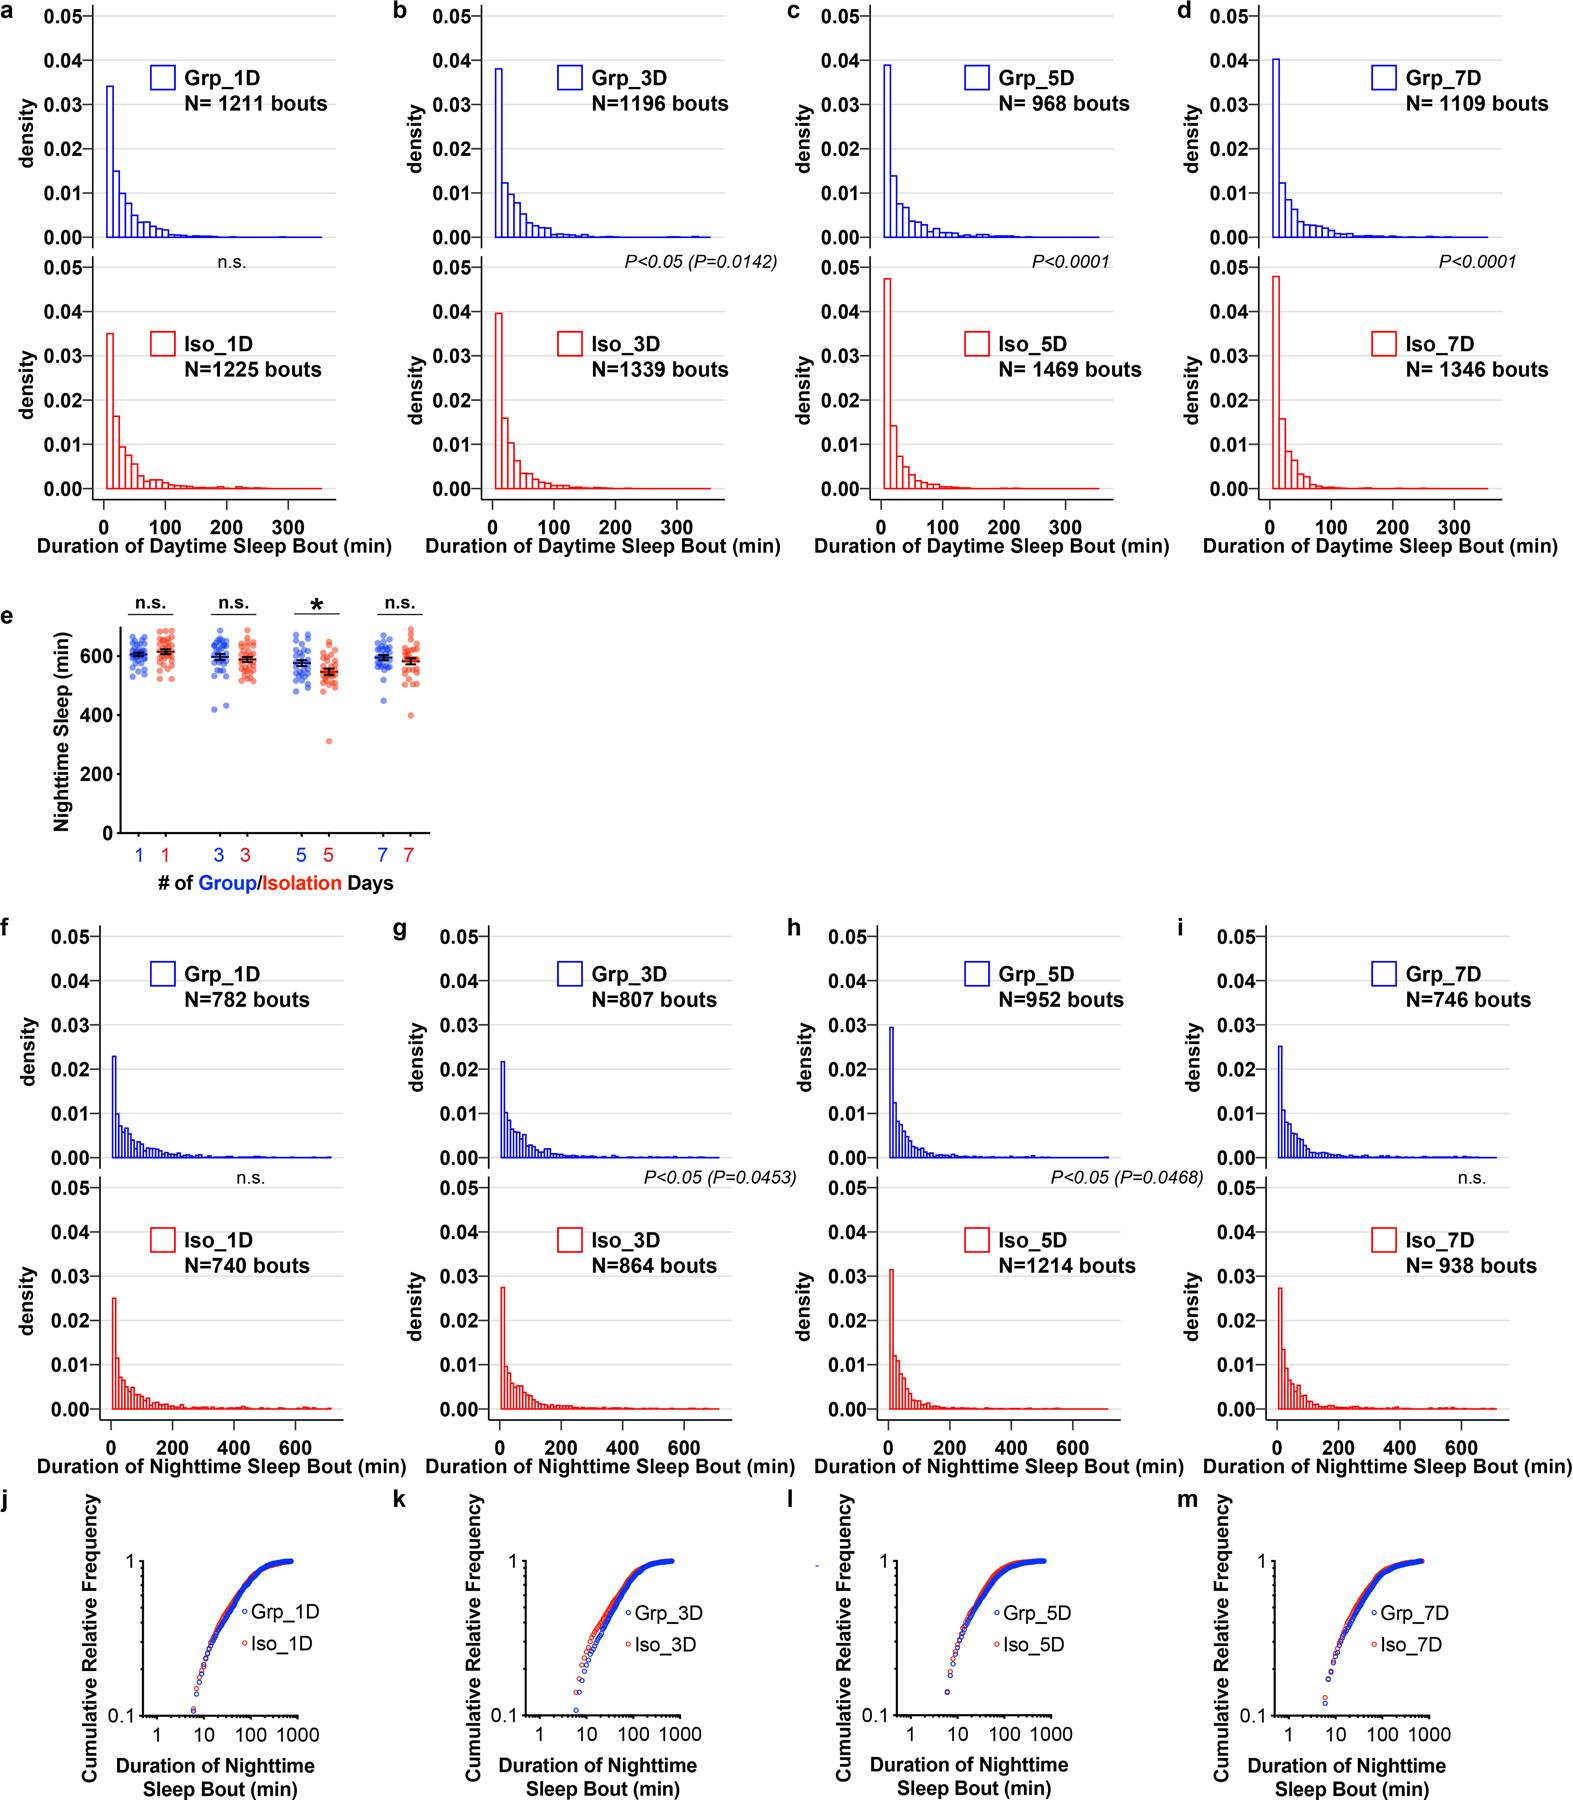
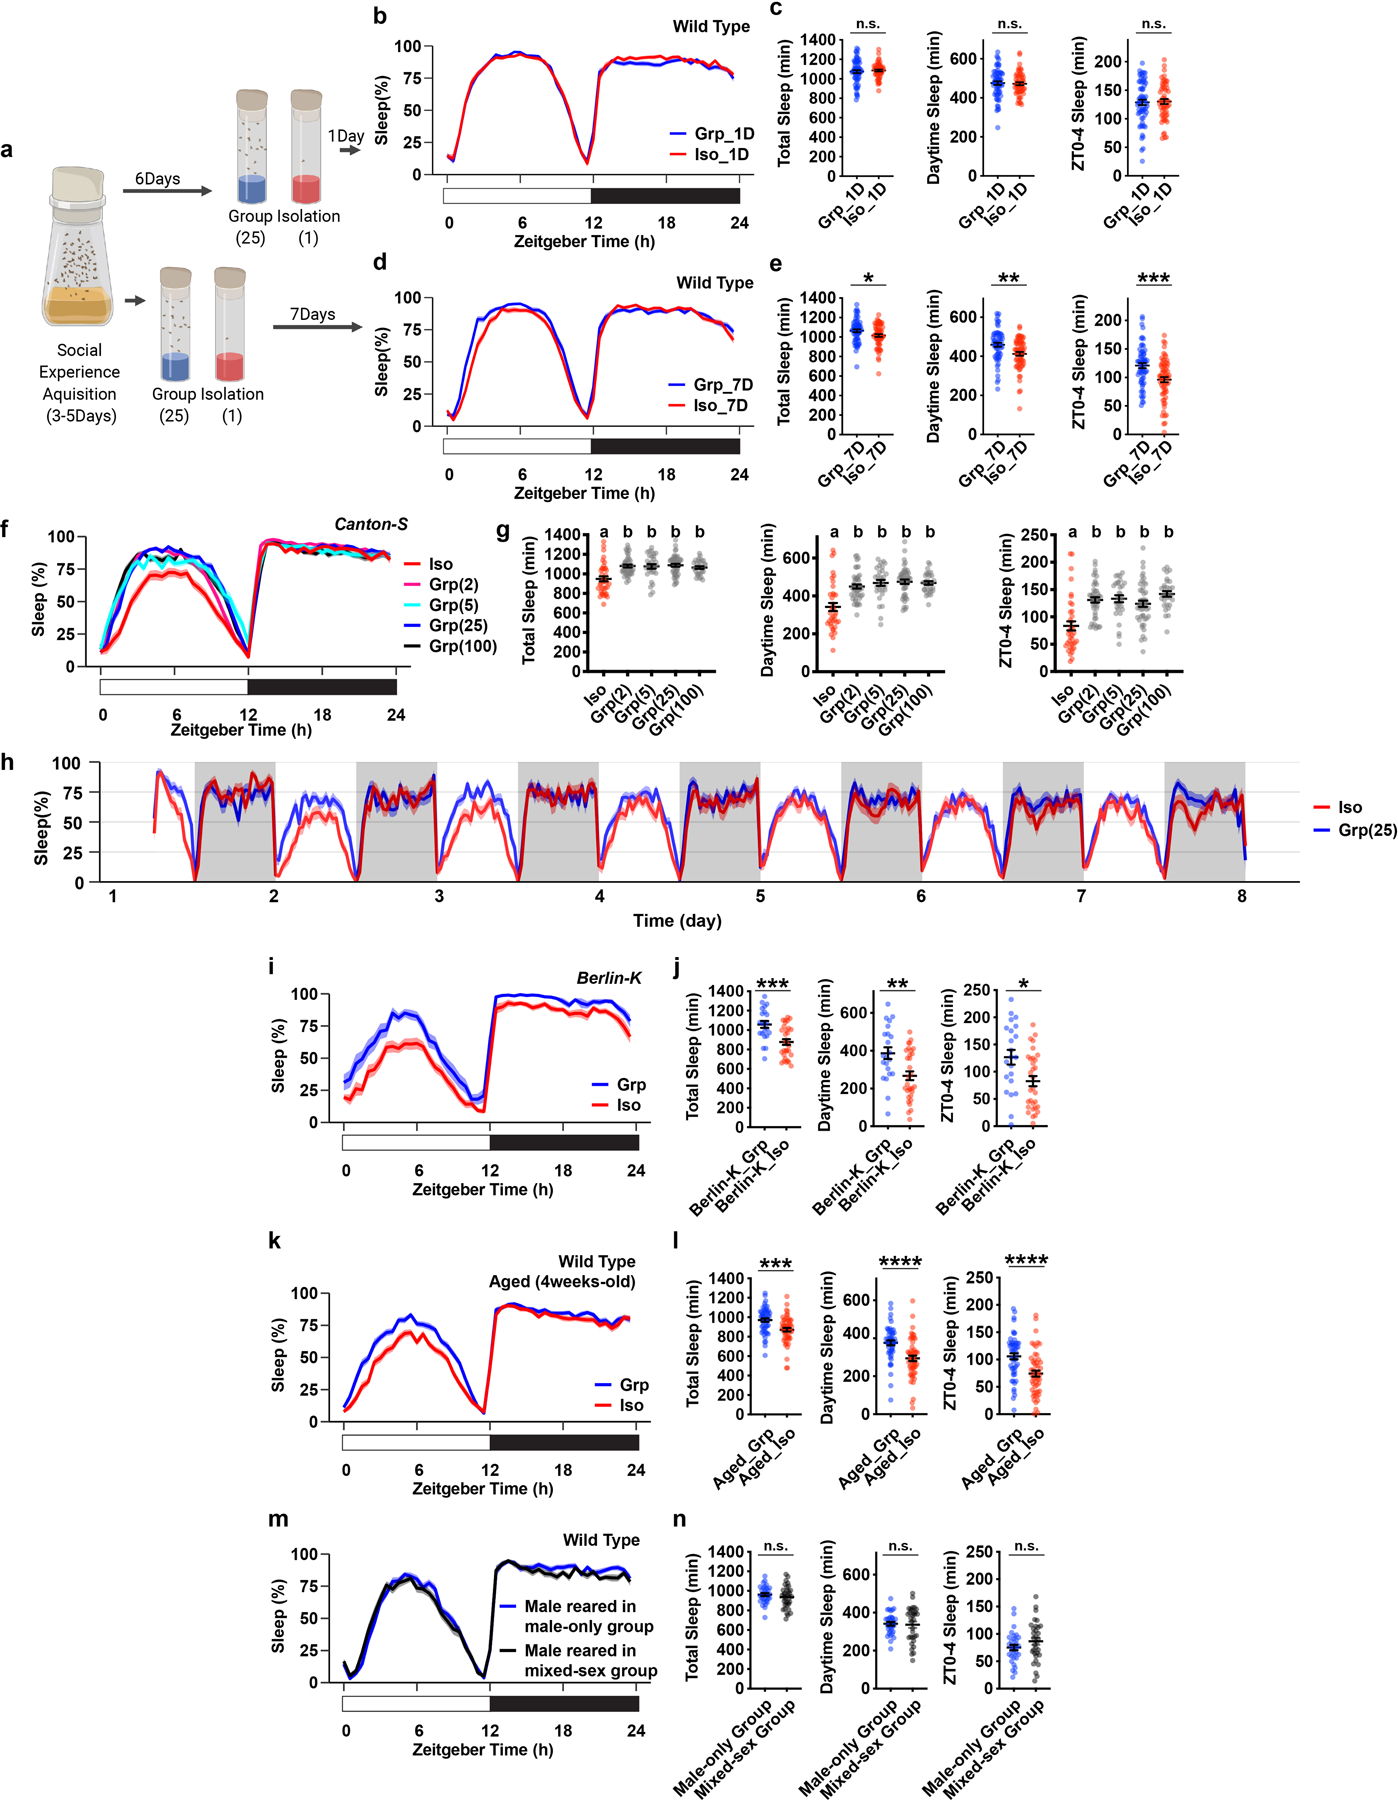
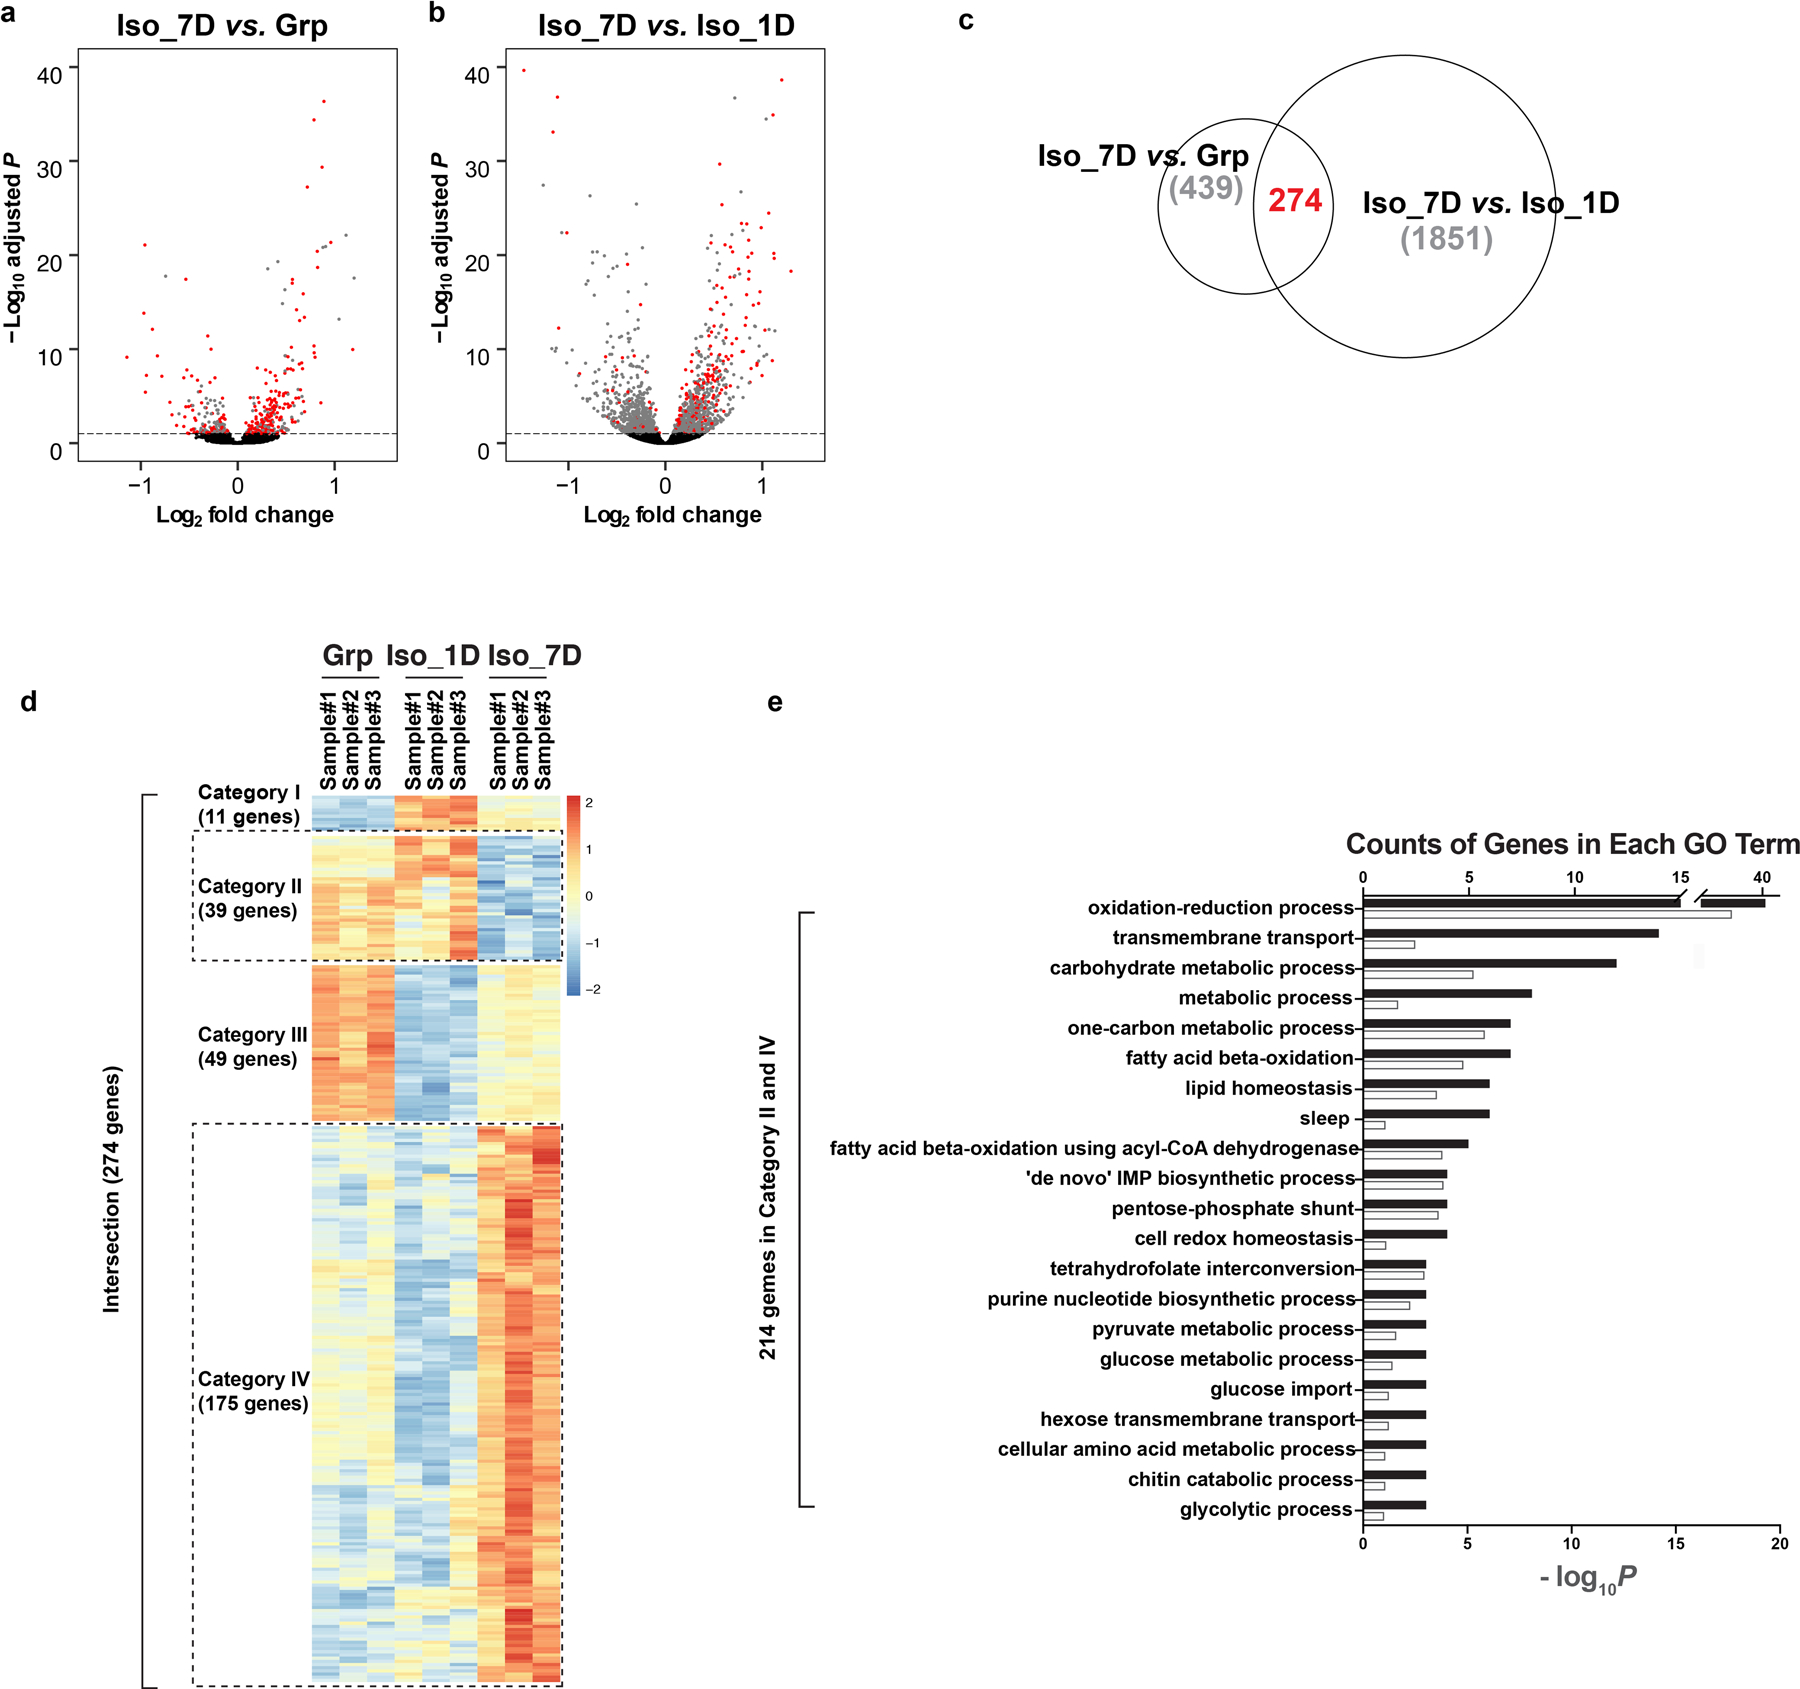
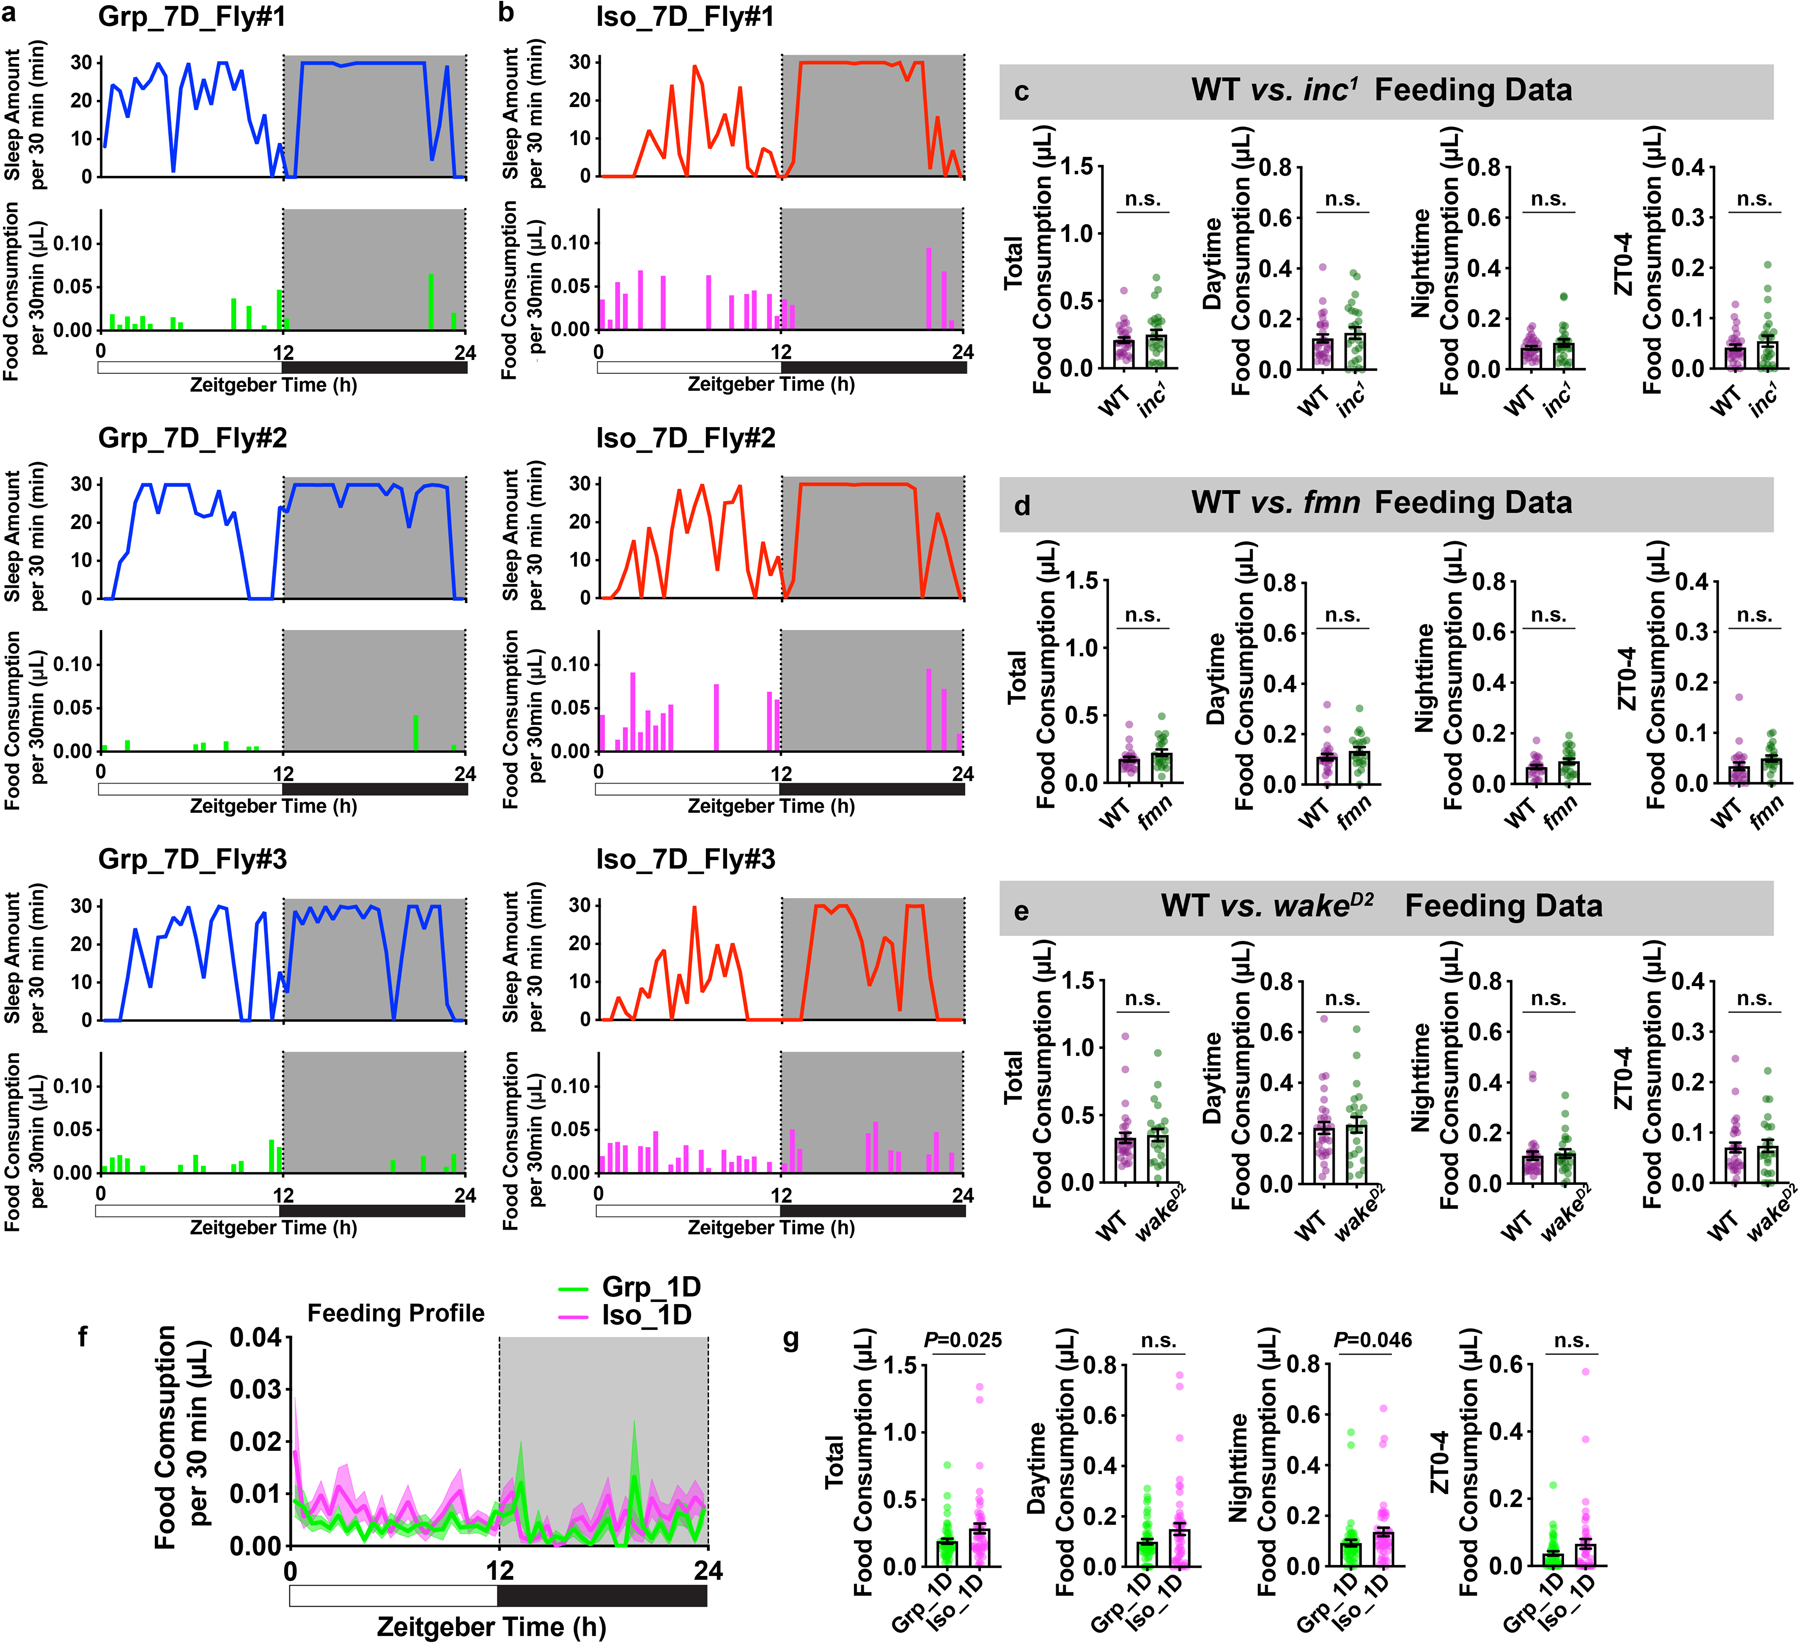
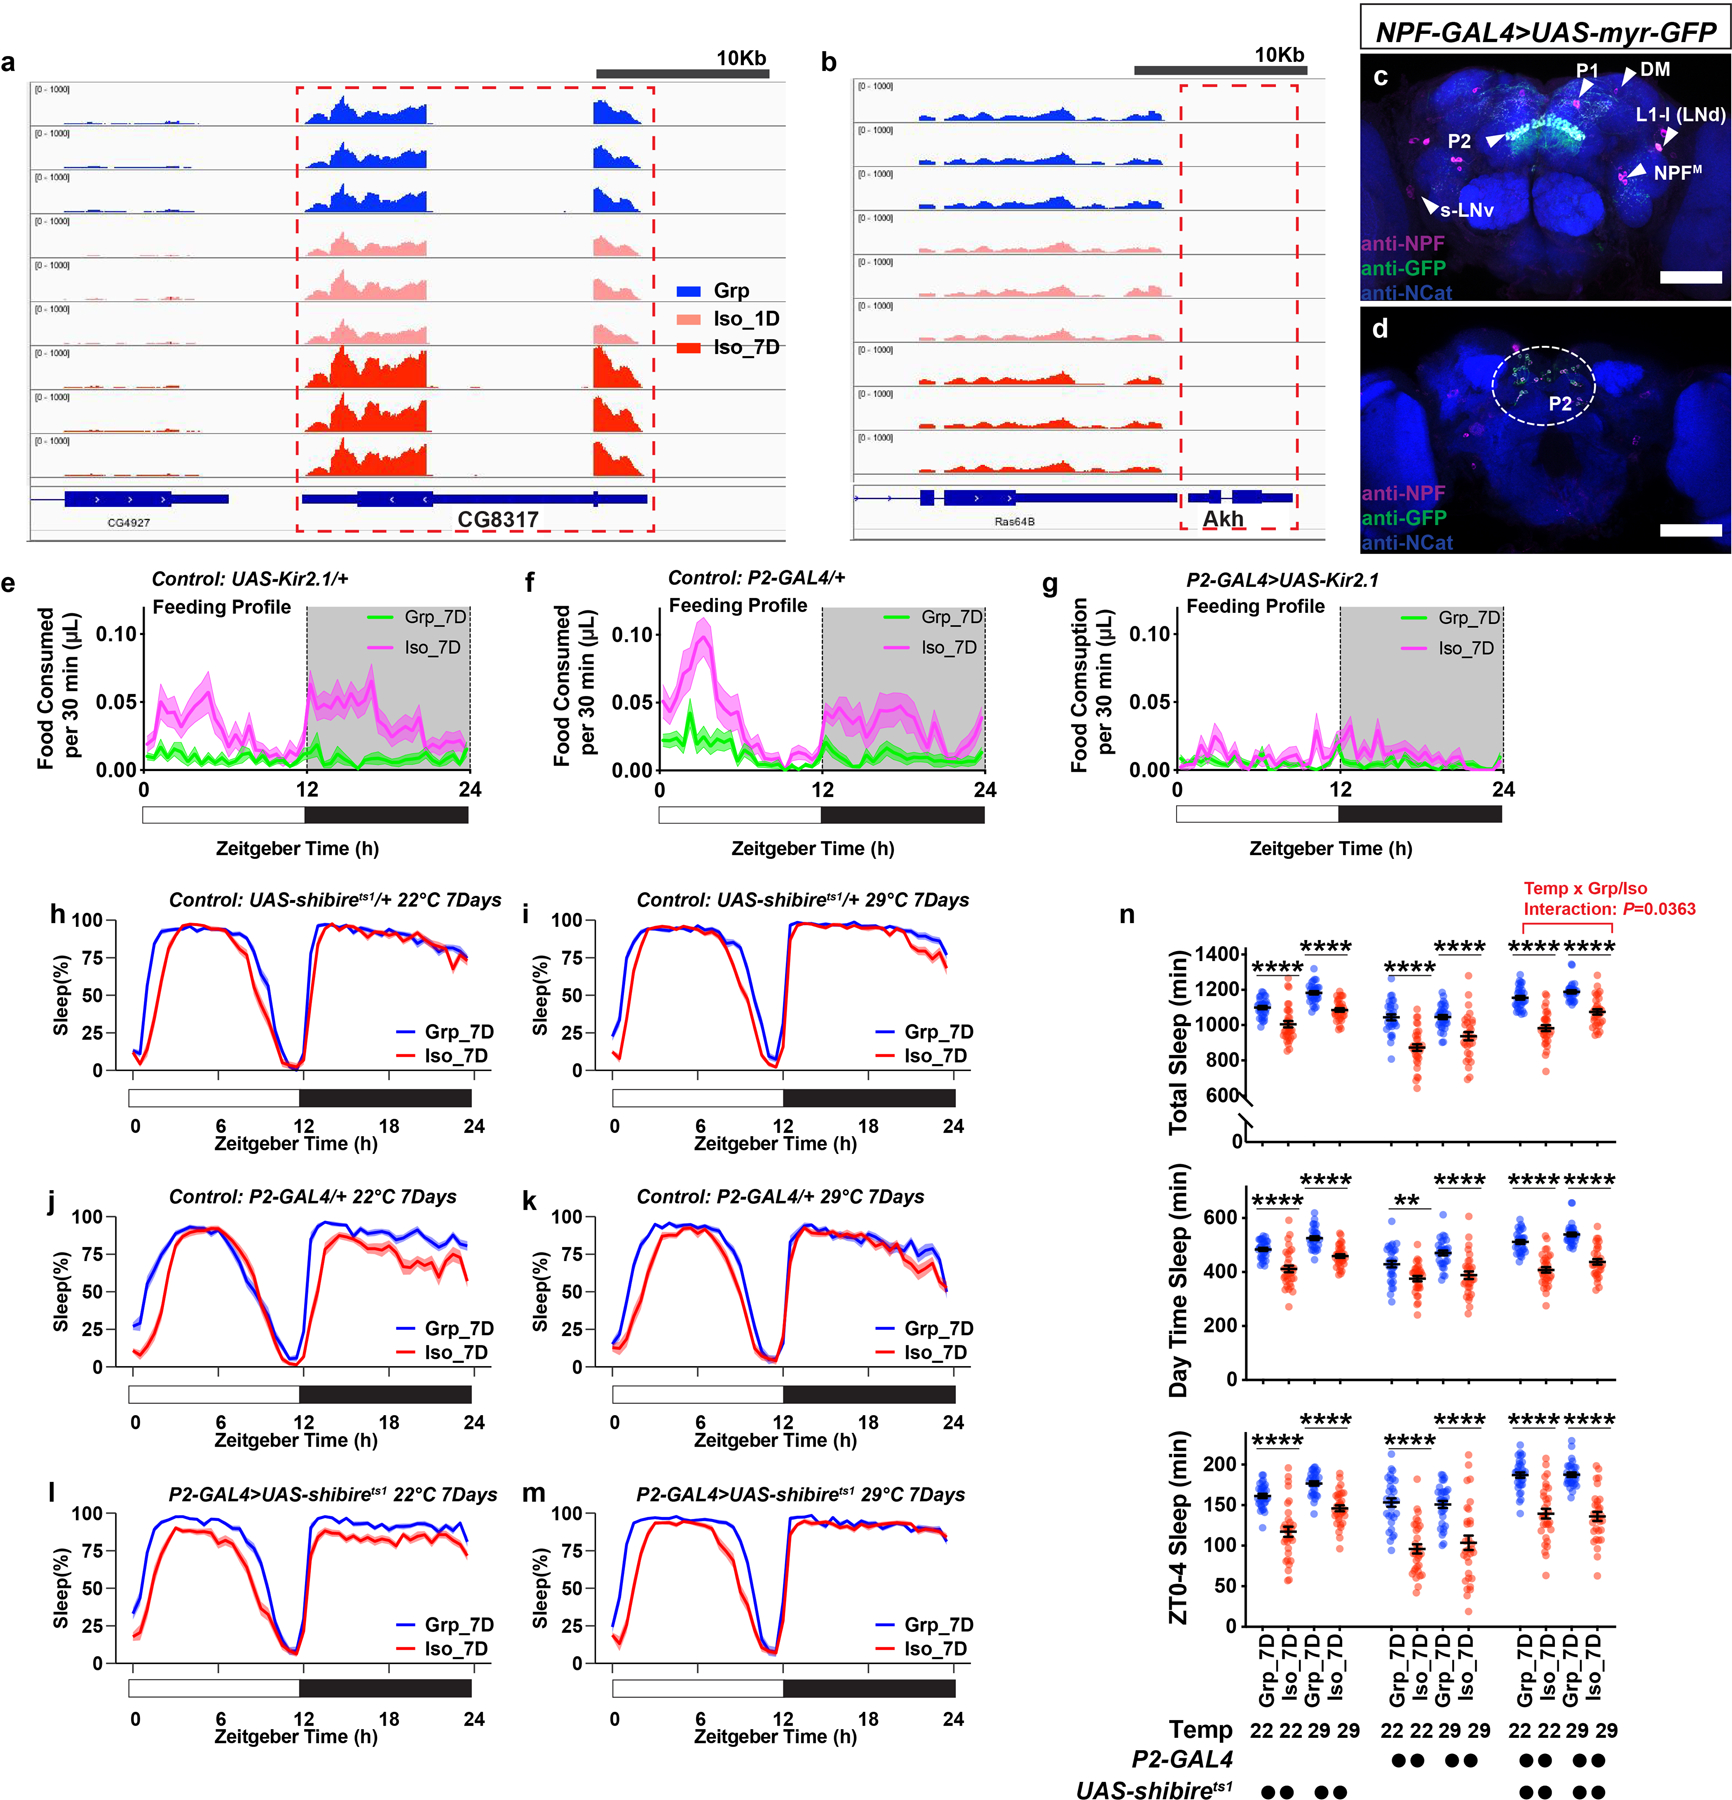
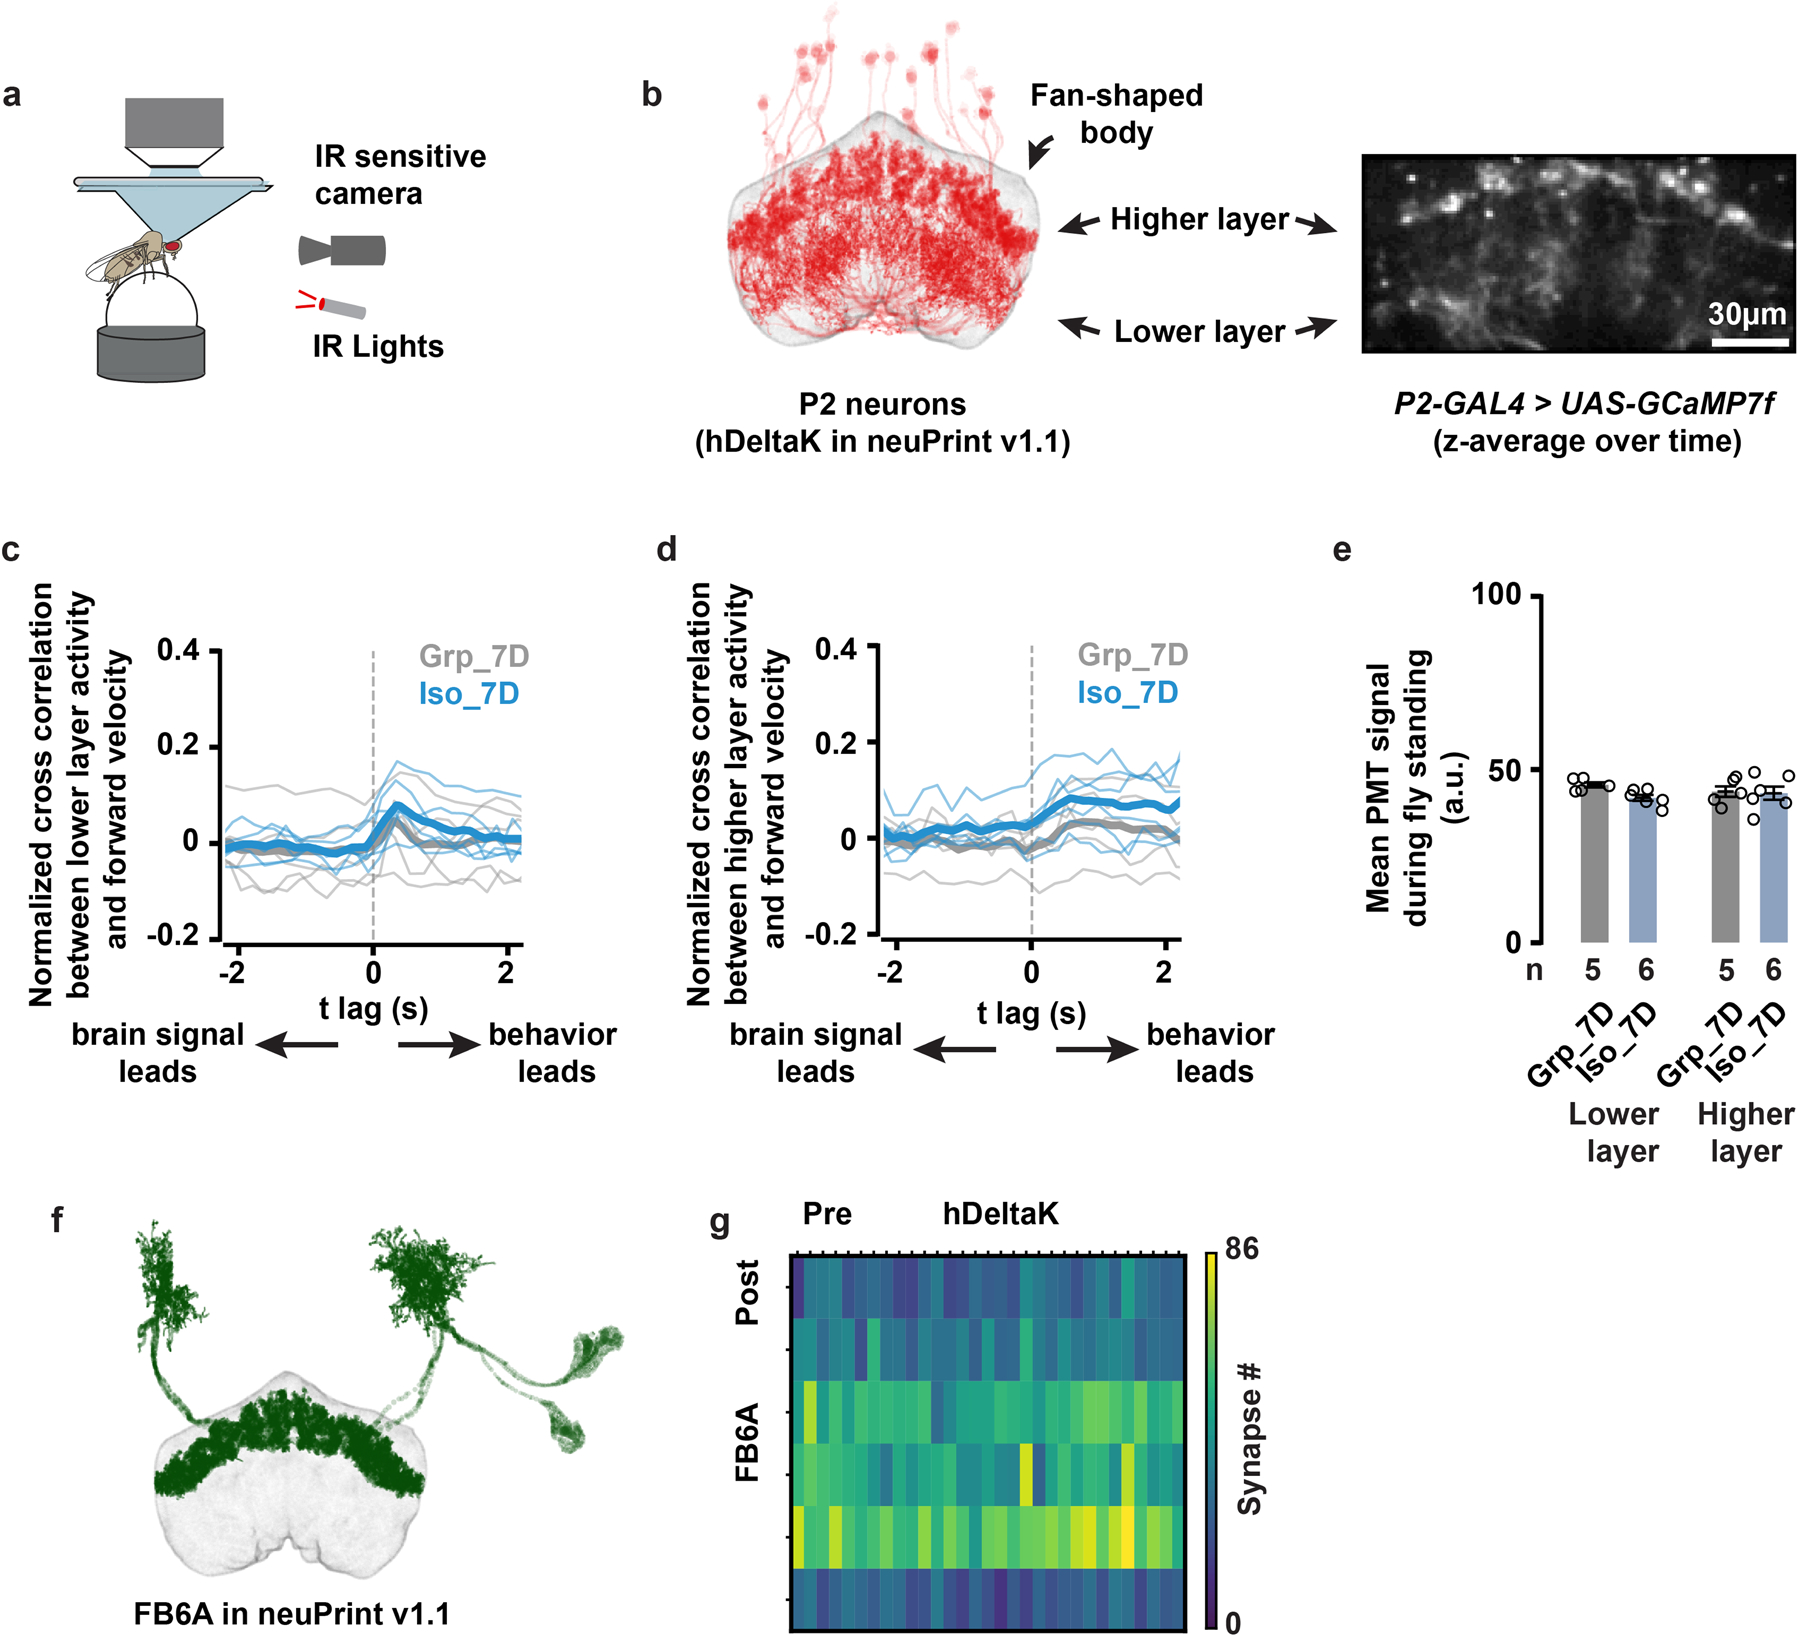
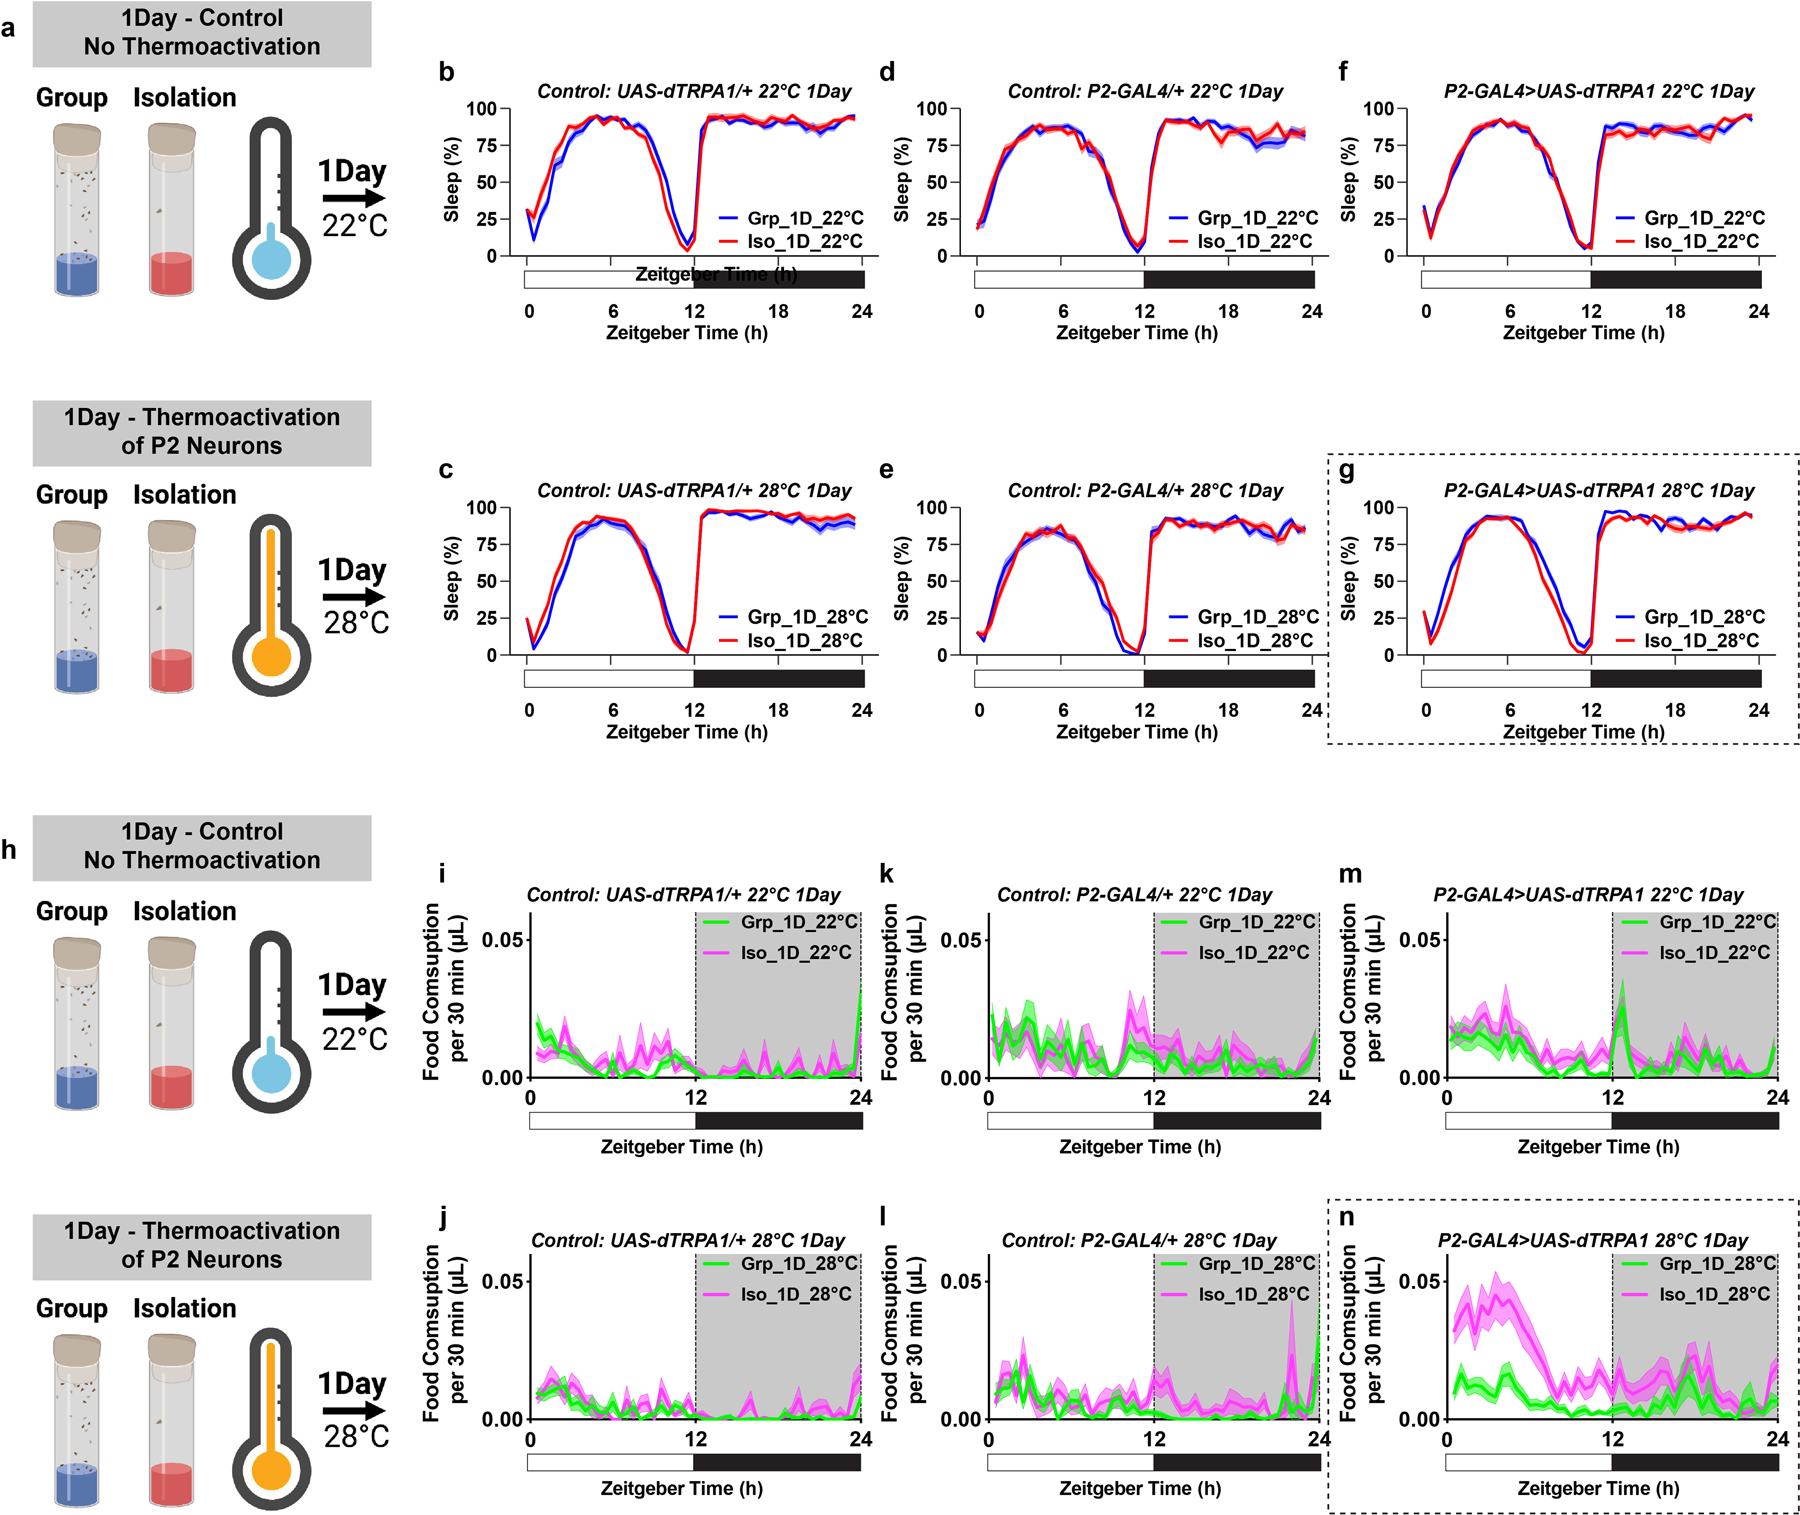
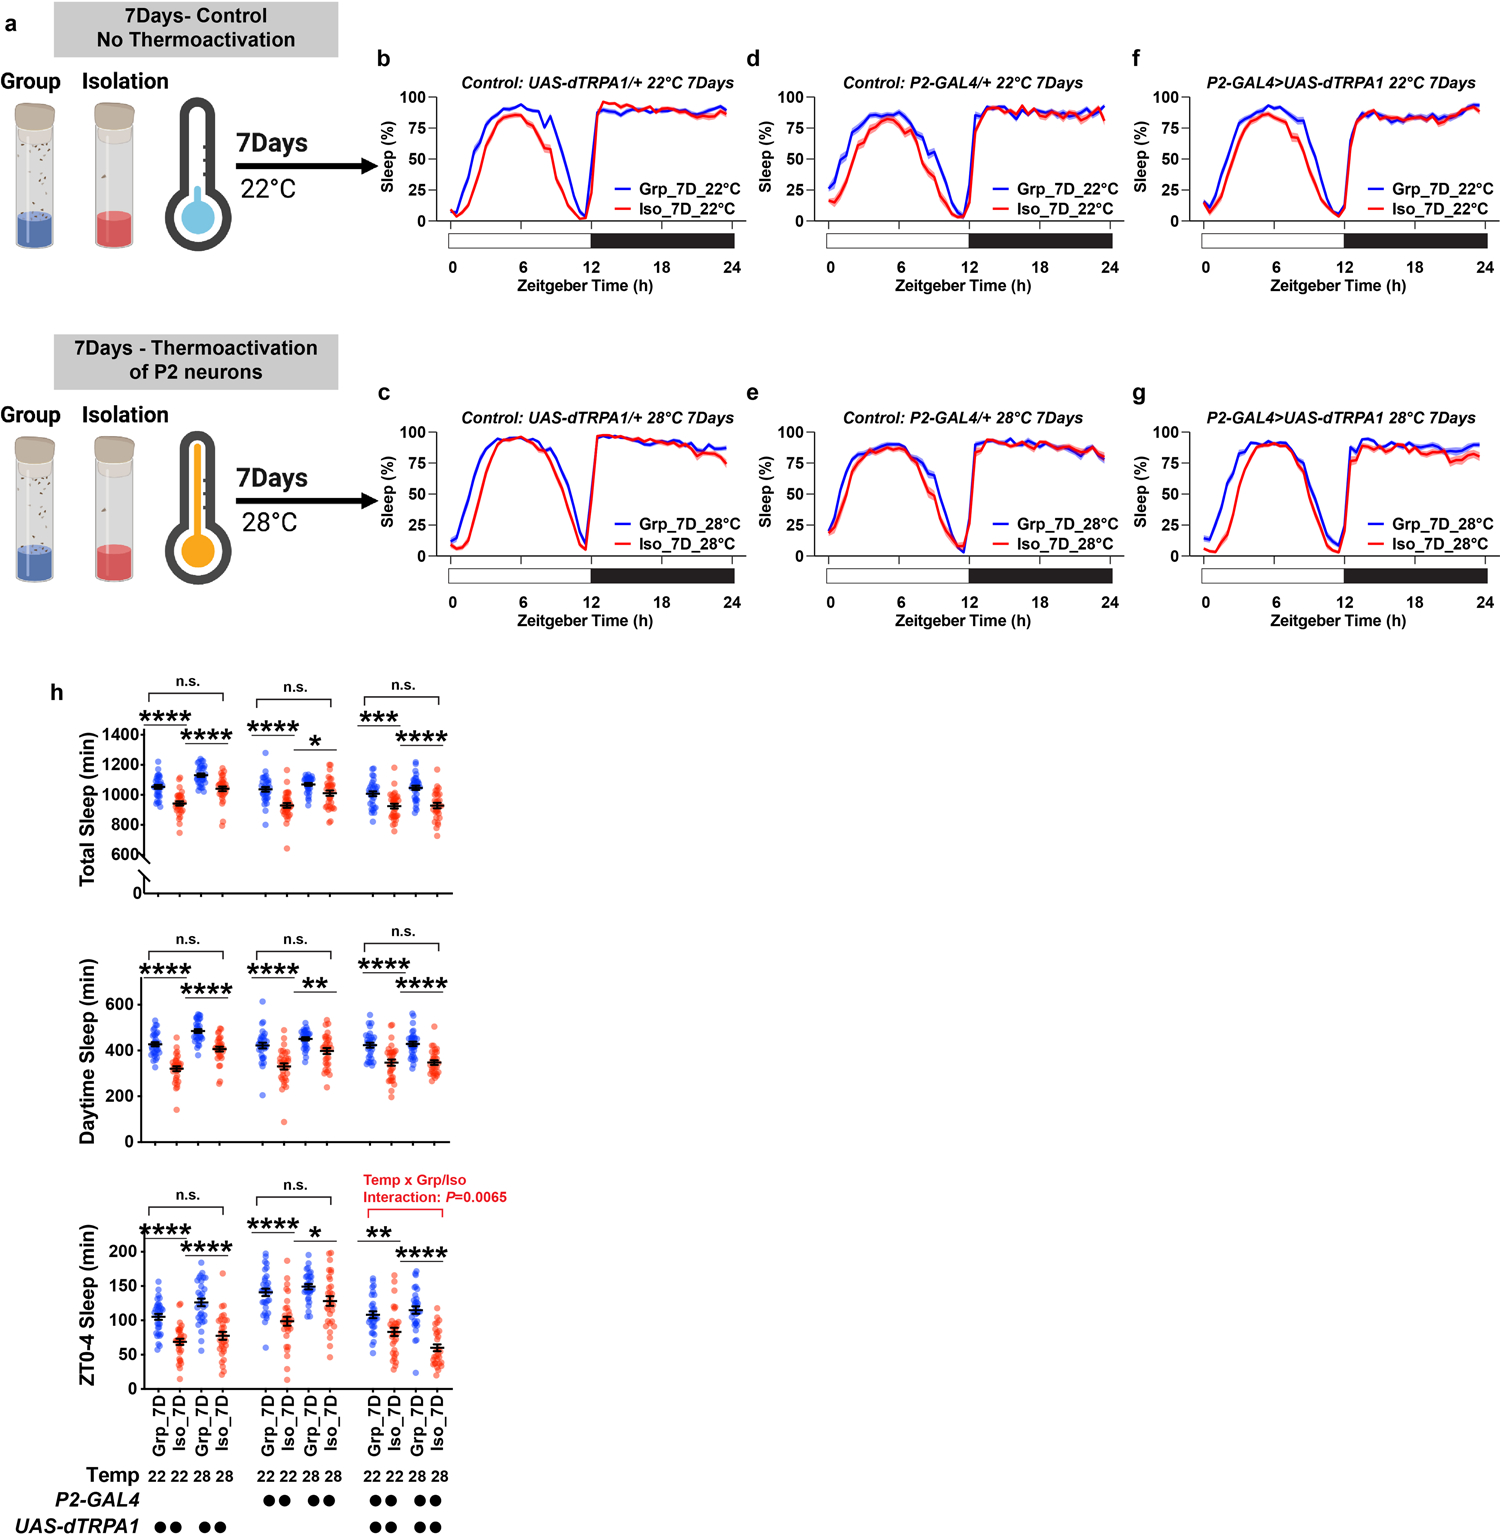
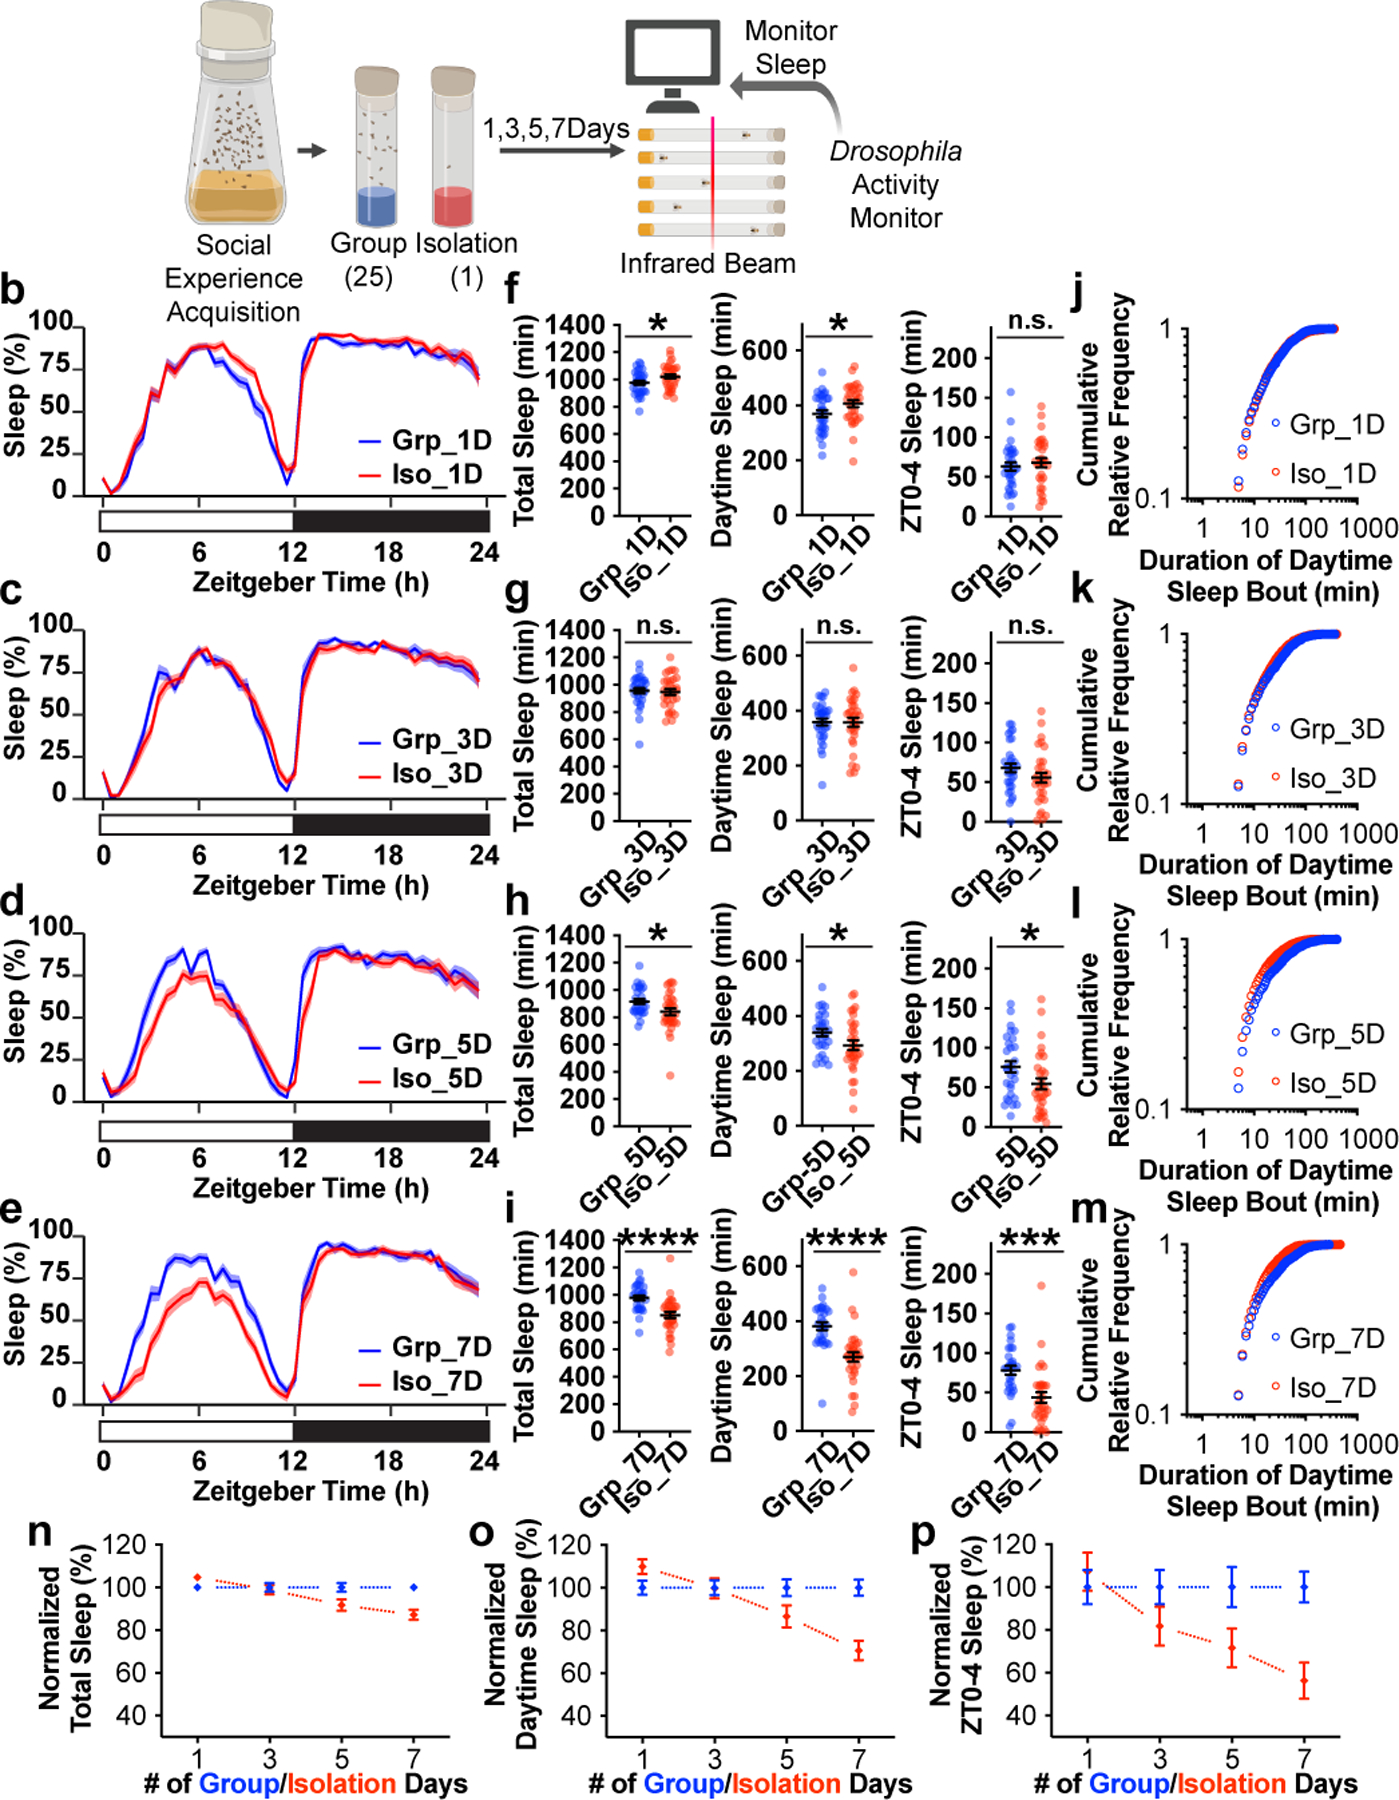
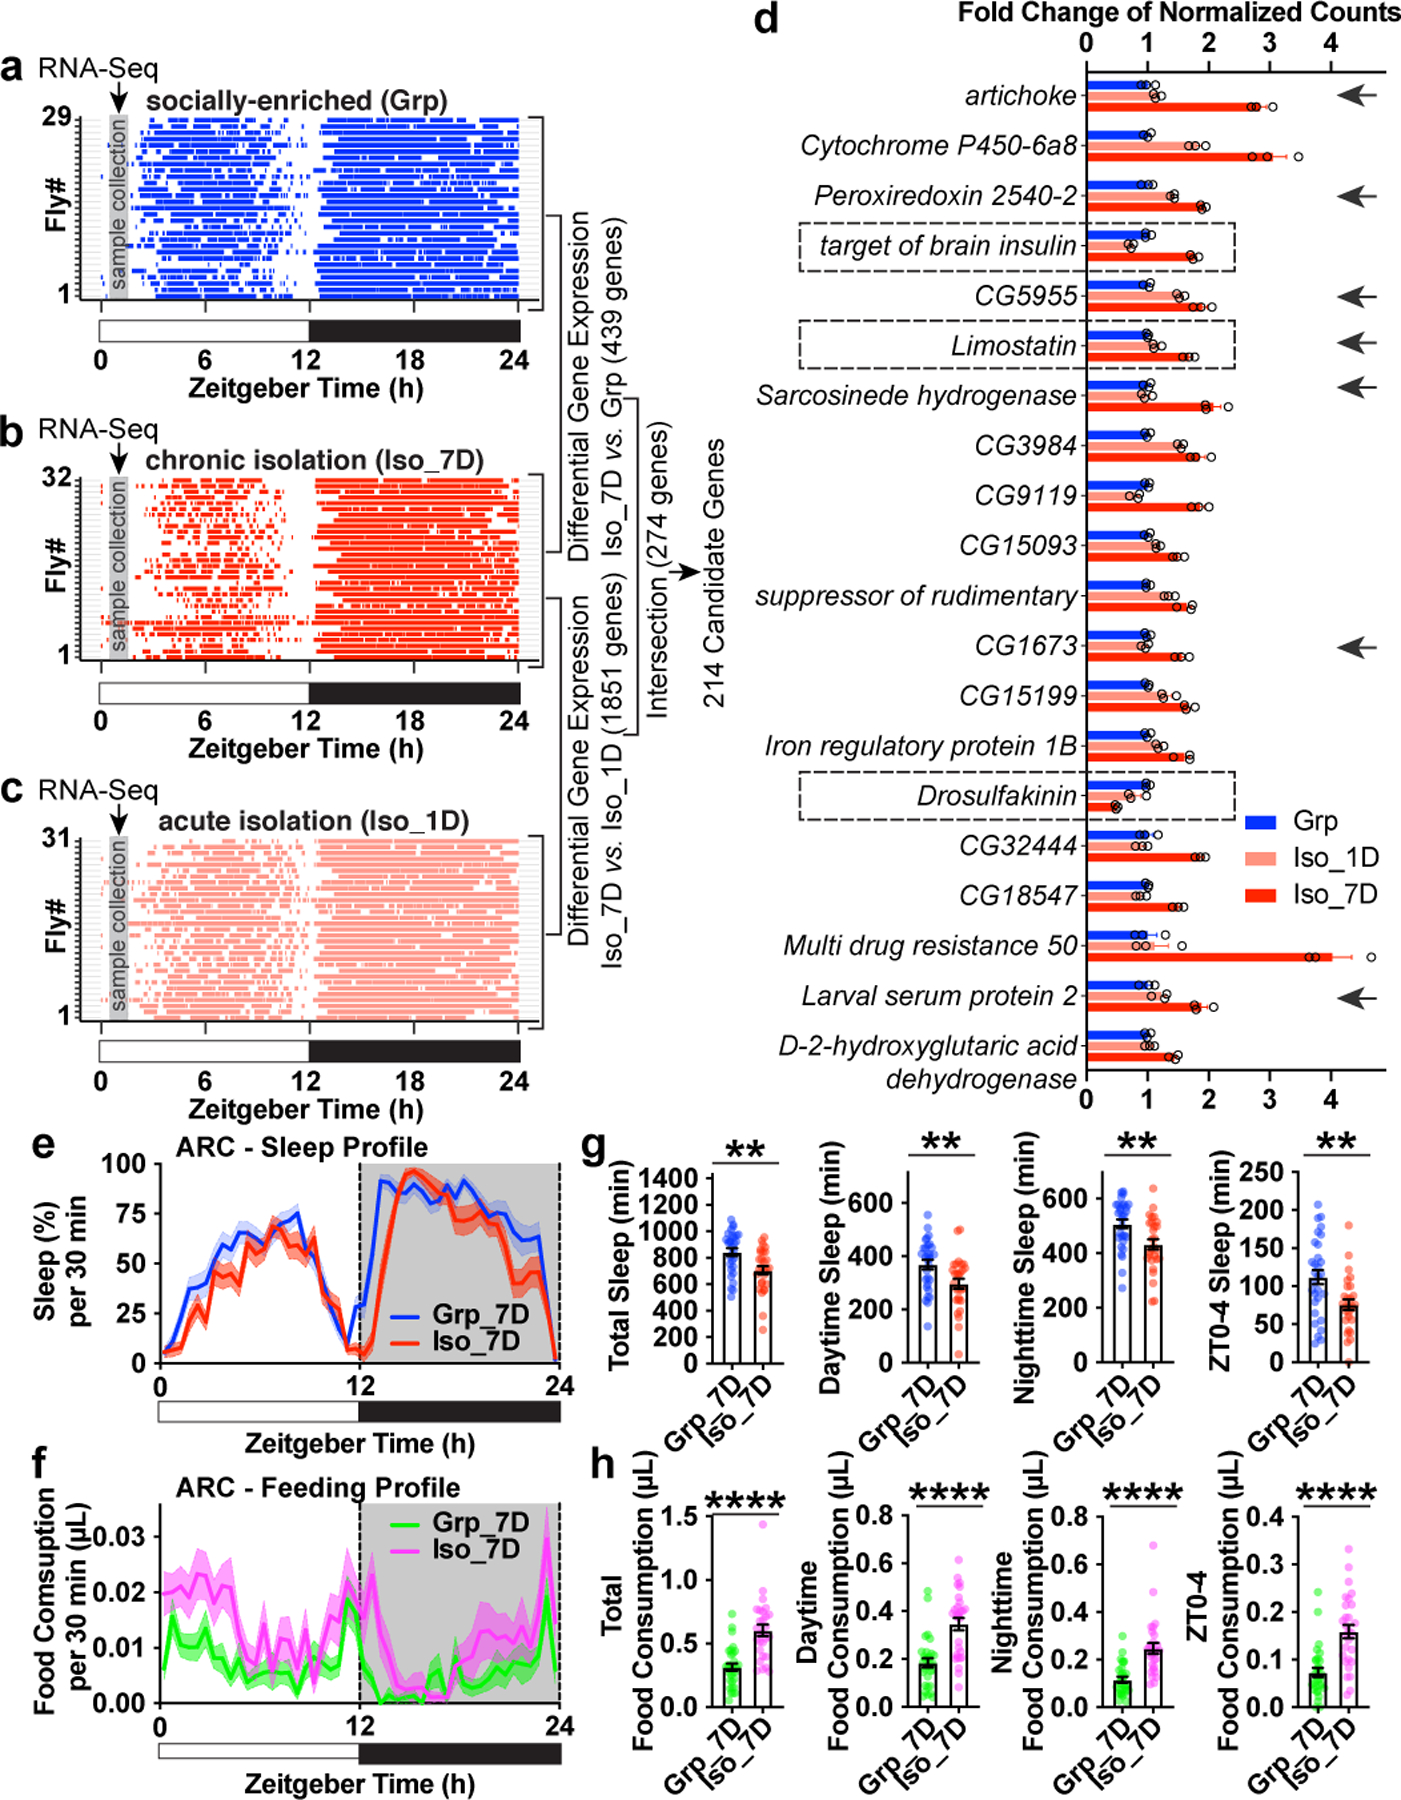
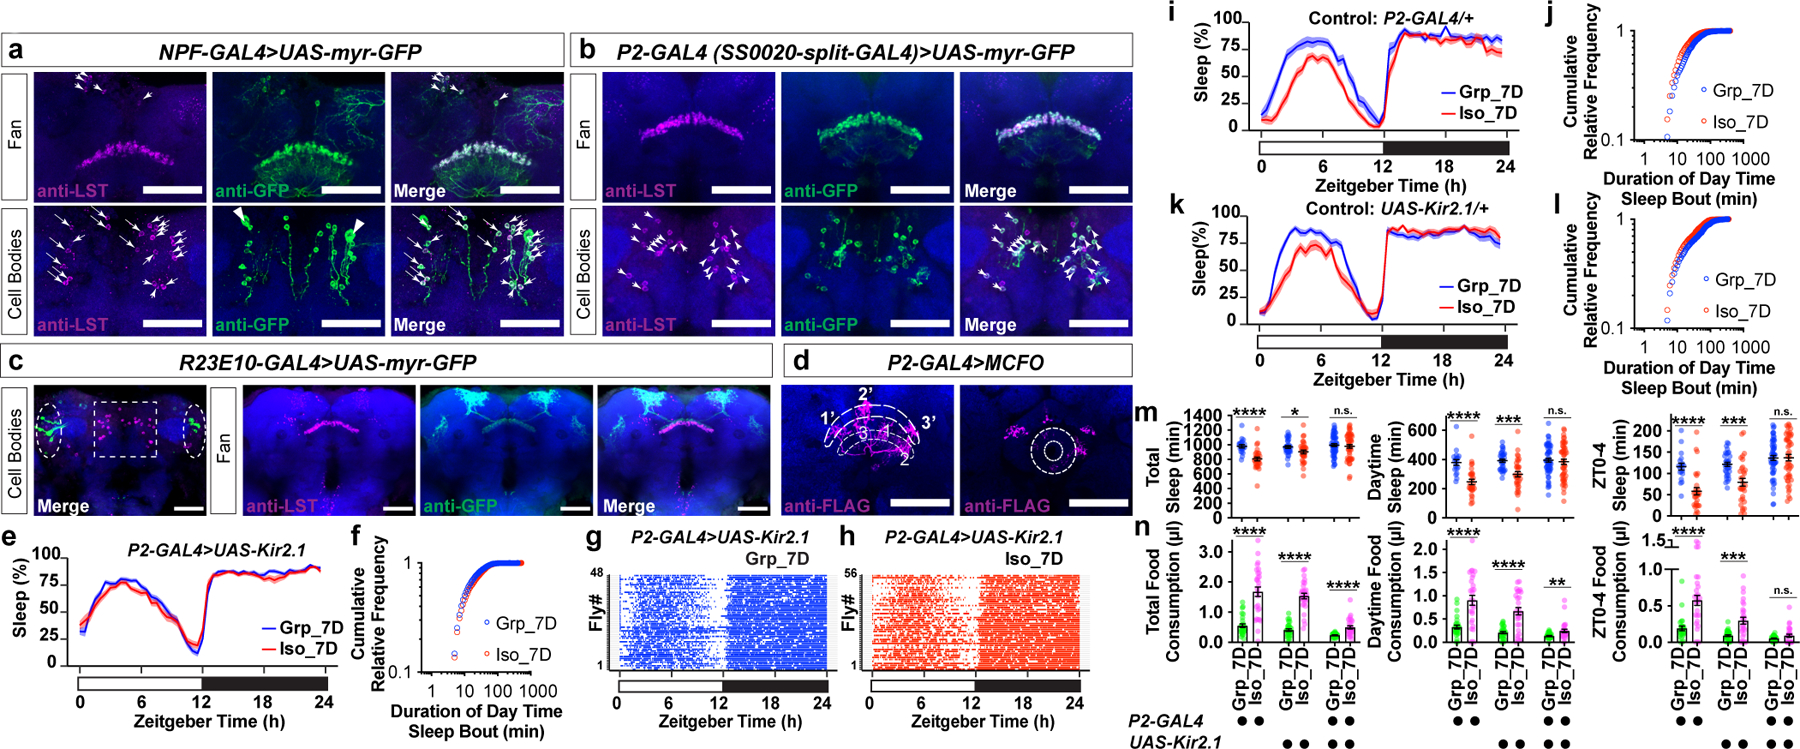
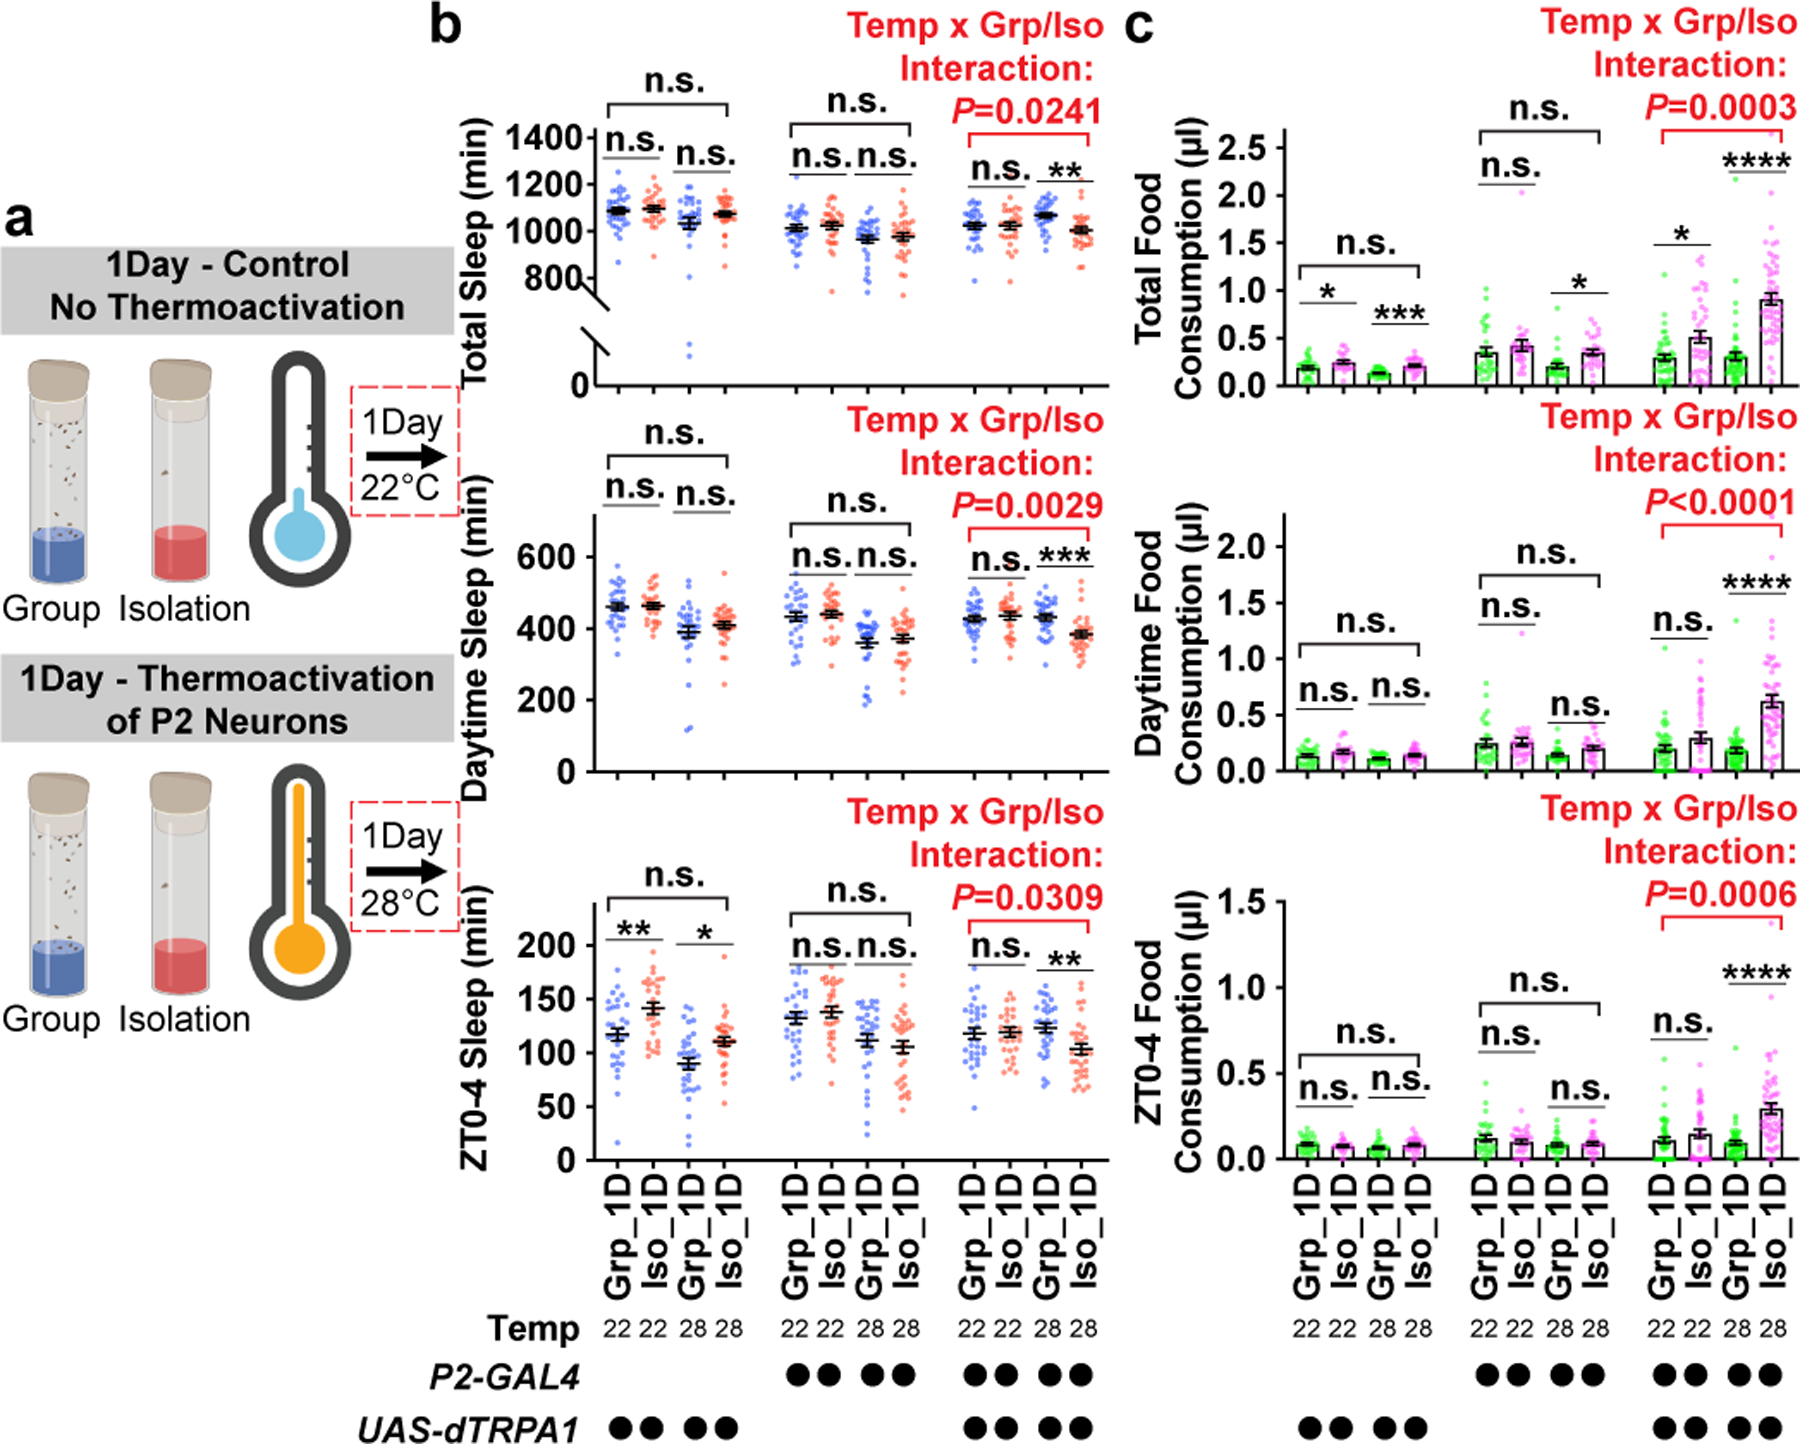
Social isolation and loneliness have potent effects on public health1-4. Research in social psychology suggests that compromised sleep quality is a key factor that links persistent loneliness to adverse health conditions5,6. Although experimental manipulations have been widely applied to studying the control of sleep and wakefulness in animal models, how normal sleep is perturbed by social isolation is unknown. Here we report that chronic, but not acute, social isolation reduces sleep in Drosophila. We use quantitative behavioural analysis and transcriptome profiling to differentiate between brain states associated with acute and chronic social isolation. Although the flies had uninterrupted access to food, chronic social isolation altered the expression of metabolic genes and induced a brain state that signals starvation. Chronically isolated animals exhibit sleep loss accompanied by overconsumption of food, which resonates with anecdotal findings of loneliness-associated hyperphagia in humans. Chronic social isolation reduces sleep and promotes feeding through neural activities in the peptidergic fan-shaped body columnar neurons of the fly. Artificial activation of these neurons causes misperception of acute social isolation as chronic social isolation and thereby results in sleep loss and increased feeding. These results present a mechanistic link between chronic social isolation, metabolism, and sleep, addressing a long-standing call for animal models focused on loneliness7.


Figures

Extended Data Fig. 1
Extended Data Fig. 1. Social isolation reduces sleep in Drosophila.
a, Schematic of social isolation paradigm. Adult fruit flies with social experience were subjected to social isolation or group enrichment for 7 days before sleep is measured using Drosophila Activity Monitors. Social isolation is housing 1 fly per vial. Group enrichment is housing 2, 5, 25 or 100 flies per vial. b, Sleep profile (displayed as the average proportion of time spent sleeping in consecutive 30min segments during a 24hr LD cycle, Mean±SEM) of flies after social isolation or group enrichment of different group sizes for 7 days. c–g, Raster plot of sleep bouts of 20 individual animals after social isolation (c), group enrichment in a group of 2 animals (d), group enrichment in a group of 5 animals (e), group enrichment in a group of 25 animals (f) and group enrichment in a group of 100 animals (g). Each row is an individual animal, with each colored bar representing sleep bouts in a 24hr LD cycle. h–k, Quantification (Mean±SEM with individual data points) of daily total sleep (h), daytime sleep (i), ZT0-4 sleep (j) and nighttime sleep (k) for flies after social isolation (Iso) or group enrichment (Grp) of different group sizes. For b and h–k, N=23–30 animals; ordinary one-way ANOVA followed by Tukey’s multiple comparison tests; means sharing the same letter are not significantly different. For N and P values, see the Source Data.
Extended Data Fig. 2
Extended Data Fig. 2. Chronic social isolation does not alter nighttime sleep in wild type Drosophila.
a–d, Density plots for distribution of daytime sleep bouts for flies after 1, 3, 5, 7 days of group enrichment/social isolation. All daytime sleep bouts collected from all animals in each condition were combined. e, Quantification (Mean±SEM with individual data points) of daily nighttime sleep for wild type flies after group enrichment/social isolation for 7 days. f–i, Density plots for distribution of nighttime sleep bouts for flies after 1, 3, 5, 7 days of group enrichment/social isolation. All nighttime sleep bouts collected from all animals in each condition were combined. j–m, Plots of cumulative relative frequency for distributions of nighttime sleep bouts for flies after 1, 3, 5, 7 days of group enrichment/social isolation. Kolmogorov-Smirnov tests were used for comparing distributions. For e, N= 29–32 animals, two-sided unpaired t-test with Welch’s correction; *P<0.05, **P<0.01, ***P<0.001, ****P<0.0001. For N and P values, see the Source Data.
Extended Data Fig. 3
Extended Data Fig. 3. Social isolation reduces Drosophila sleep in age-matched flies, in various isogenic strains, and in aged wild type animals.
a, Schematics of measuring sleep using Drosophila Activity Monitors after 1 or 7 days of group enrichment/social isolation in age-matched flies. b–e, Sleep profile and quantification of daily total sleep, daytime sleep and ZT0-4 sleep after 1 day (b–c, N=55–64 animals) or 7 days of group enrichment/social isolation (d–e, N=61–64 animals). f–g, Sleep profile and quantification of daily total sleep, daytime sleep and ZT0-4 sleep of the Canton-S isogenic strain after social isolation or group enrichment of different group sizes for 7 days (N=30–47 animals). h, A 7-day long sleep profile of flies after group enrichment/social isolation for 7 days. i–j, Sleep profile and quantification of daily total sleep, daytime sleep and ZT0-4 sleep for Berlin-K flies after social isolation/group enrichment (25 flies in a group) for 7 days (N=22–31 animals). k–l, Sleep profile and quantification of daily total sleep, daytime sleep and ZT0-4 sleep of aged wild type flies after group enrichment/social isolation (25 flies in a group) for 7 days (N=52–54 animals). m–n, Sleep profile and quantification of daily total sleep, daytime sleep and ZT0-4 sleep of male wild type flies after group enrichment in a male only group (30 flies in a group) or in a mixed-sex group (15 male and 15 female flies in a group) for 7 days (N=32 animals). Sleep profiles are displayed as the average proportion of time spent sleeping in consecutive 30min segments during a 24hr LD cycle; solid line, Mean; shaded area, ±SEM. Quantifications are displayed as Mean±SEM with individual data points. For g, ordinary one-way ANOVA followed by Tukey’s multiple comparison test; means sharing the same letter are not significantly different. For c, e, j, l and n, two-sided unpaired t-tests with Welch’s correction; *P<0.05, **P<0.01, ***P<0.001, ****P<0.0001. For N and P values, see the Source Data.
Extended Data Fig. 4
Extended Data Fig. 4. Social isolation reduces sleep in Drosophila Sleep Inbred Panel (SIP) lines.
a–d, Sleep profile of long-sleeping flies: SIP-L1-3 (a), SIP-L1-4 (b), SIP-L2-1 (c), and SIP-L2-6 (d) after group enrichment/social isolation (25 flies in a group for group treatment) for 7 days. e–h, Sleep profile of short-sleeping flies: SIP-S1-1 (e), SIP-S1-9 (f), SIP-S2-3 (g), and SIP-S2-9 (h) after group enrichment/social isolation (25 flies in a group for group treatment) for 7 days. Sleep profiles are displayed as the average proportion of time spent sleeping in consecutive 30min segments during a 24hr LD cycle; solid line, Mean; shaded area, ±SEM. The long-sleeping/short-sleep fly lines were randomly selected from the Sleep Inbred Panel (SIP), a panel of inbred Drosophila melanogaster strains with extreme long or short sleep duration phenotypes,.
Extended Data Fig. 5
Extended Data Fig. 5. RNA-sequencing experiment reveals gene expression change during chronic social isolation.
a–b, Volcano plots of differential gene expression from RNA-seq results. Comparison between chronic isolation and group conditions (a, “Iso_7D vs. Grp”). Comparison between chronic isolation and acute isolation conditions (b, “Iso_7D vs, Iso_1D”). Red dots indicate genes showing significant adjusted P-values in both comparisons. Differential gene expression analyses were conducted using DESeq2, which uses two-sided Wald test and Benjamin Hochberg correction. c, Venn diagram showing the intersection of the above two comparisons. d, Heatmap of the 274 intersected genes showing significant differential gene expression changes in both comparisons of “Iso_7D vs. Grp” and “Iso_7D vs. Iso_1D”. e, Gene Ontology of the 214 candidate genes from Category II and Category IV in d; black bar: counts of genes in each GO term; white bar: −log10P values for each GO term. See Methods and Supplementary Information for details on RNA-seq data analyses.
Extended Data Fig. 6
Extended Data Fig. 6. Chronic social isolation results in reduced sleep and excessive feeding, while food consumption is not altered in sleep mutants or after acute social isolation.
a, Sleep profiles and matching feeding profiles of three representative individual animals after 7 days of group enrichment. b, Sleep profiles and matching feeding profiles of three representative individual animals after 7 days of social isolation. Sleep profile is presented as sleep amount (min) in consecutive 30min segments during a 24hr LD cycle. Matching feeding profile is presented as food consumption (μL) in consecutive 30min segments during a 24hr LD cycle. c, Quantification of daily total food consumption, daytime food consumption, nighttime food consumption and ZT0-4 food consumption for wild type and sleep mutant inc1 flies (N=25–29 animals). d, Quantification of daily total food consumption, daytime food consumption, nighttime food consumption and ZT0-4 food consumption for wild type and sleep mutant fmn flies (N=25–29 animals). e, Quantification of daily total food consumption, daytime food consumption, nighttime food consumption and ZT0-4 food consumption for wild type and sleep mutant wakeD2 flies. (N=23–30 animals). f, Feeding profile measured by ARC (Activity Recording Capillary Feeder) assay in flies following 1 day of group enrichment/social isolation; solid line, Mean; shaded area, ±SEM. g, Quantification of daily total food consumption, daytime food consumption, nighttime food consumption and ZT0-4 food consumption for flies after 1 day of group enrichment/social isolation (f–g, N=49–50 animals). All quantifications are displayed as Mean±SEM with individual data points. Unpaired t-tests with Welch’s correction. For N and P values, see the Source Data.
Extended Data Fig. 7.
Extended Data Fig. 7.. Limostatin transcripts are detected in fly head RNA-seq sample libraries; NPF-GAL4 expression pattern; feeding profile of flies in experiments silencing P2 neurons; and silencing P2 neurons with UAS-shibirets1 during social isolation is insufficient to block chronic social isolation-induced sleep loss.
a, Reads from RNA-seq sample libraries (Grp, Iso_1D, and Iso_7D) align to the gene region of Limostatin (CG8317). b, Akh and Lst were known to co-express in the corpora cardiaca. No reads were detected or aligned to the gene region of Akh, suggesting the RNA-seq samples are free of corpora cardiaca materials and the measured Lst transcripts come from sources in the brain. c, Expression pattern of NPF-GAL4 labeled neurons revealed by UAS-myr::GFP and NPF antibody staining. NPF-immunoreactivity-positive cells overlaps with GFP-positive cells. Triangles indicate P1, P2, DM, L1-l (or LNd), s-LNv44 and NPFM45 neurons. d, An additional brain imaged from the posterior end to show NPF and GFP-positive cell bodies of P2 neurons, circled in the dashed line (Magenta: NPF; Green: GFP; Blue: N-cadherin; scale bar: 50μm). e–g, Feeding profiles measured by ARC (Activity Recording Capillary Feeder) assay for parental control flies (e and f) and flies expressing UAS-Kir2.1 with P2-GAL4 (g) following 7 days of group enrichment/social isolation; solid line, Mean; shaded area, ±SEM (N=27–30 animals). h–m, Sleep profiles for parental control flies (h–k) and flies expressing UAS-shibirets with P2-GAL4 (l and m) following 7 days of group enrichment/social isolation at 22°C (h, j, l) or 29°C (i, k, m). All sleep behavior was tested at 22°C. n, Quantification (Mean±SEM with individual data points) of daily total sleep, daytime sleep and ZT0-4 sleep for parental control flies and flies expressing UAS-shibirets with P2-GAL4 following 7 days of group enrichment/social isolation at 22°C or 29°C. Sleep profiles are displayed as the average proportion of time spent sleeping in consecutive 30min segments during a 24hr LD cycle; solid line, Mean; shaded area, ±SEM. For h–n, N=31–32 animals; two-way ANOVA were used for detecting interactions between temperature treatment and group/isolation status; Šidák multiple comparisons tests were used for post-hoc analyses between group treated and isolated animals of the same genotype and temperature treatment; *P<0.05, **P<0.01, ***P<0.001, ****P<0.0001. For N and P values, see the Source Data.
Extended Data Fig. 8.
Extended Data Fig. 8.. P2 neurons show similar activity patterns after chronic social isolation/group enrichment and P2 neurons synapse onto cell types labelled by R23E20-GAL4.
a, Tethered, walking, [Ca2+]-imaging setup with an IR-sensitive camera that tracks the rotation of the ball. b, The anatomy of hDeltaK cells from neuPrint (left), compared with time-averaged z projection of GCaMP7f signals driven by P2-GAL4 (right). Both images show two separate layers (higher layer and lower layer) of fan-shaped body neuropils. c, Cross-correlation analysis of the lower-layer GCaMP7f activity and the fly’s forward walking velocity; thin lines: individual fly data; thick lines: population means. d, Cross-correlation analysis of the higher-layer GCaMP7f activity and the fly’s forward walking velocity; thin lines: individual fly data; thick lines: population means. e, Quantification (Mean±SEM with individual data points) of GCaMP7f activity during standing moments of flies following 7 days of group enrichment/social isolation. Identical 2-photon acquisition parameters were used in all experiments (c–e, N=5 to 6 animals). f, The anatomy of FB6A cells from neuPrint. FB6A has been identified as one of the few cell types labelled by R23E10-GAL4. g, Synapse-number matrix for detected synapses from P2 neurons (named hDeltaK cells in neuPrint) to FB6A cells. Connectivity data and cell-type names are based on those in neuPrint, hemibrain: v1.1.
Extended Data Fig. 9.
Extended Data Fig. 9.. Sleep profiles and feeding profiles of flies in which P2 neurons were thermally activated by expressing UAS-dTPRA1 during acute (1 day) group enrichment/social isolation; parental and temperature controls are included.
a, Schematics of activating P2 neurons for 1 day of group enrichment/social isolation. 22°C treatments (no thermoactivation) were used as controls. Flies in group enrichment/social isolation were kept at 28°C for 1 day to thermally activate P2 neurons. After 1 day of thermal activation (or no activation), sleep behavior was measured at 22°C. b and c, Sleep profile of UAS-dTRPA1/+ heterozygous control flies after group enrichment/social isolation at 22°C for 1 day or at 28°C for 1 day. d and e, Sleep profile of P2-GAL4/+ heterozygous control flies after group enrichment/social isolation at 22°C for 1 day or at 28°C for 1 day. f and g, Sleep profile of flies expressing UAS-dTRPA1 under the control of P2-GAL4 after group enrichment/social isolation at 22°C for 1 day or at 28°C for 1 day. h, Schematics of activating P2 neurons for 1 day of group enrichment/social isolation. 22°C treatments (no thermoactivation) were used as controls. Flies in group enrichment/social isolation were kept at 28°C for 1 day to thermally activate P2 neurons. After 1 day of thermal activation (or no activation), feeding behavior was measured at 22°C. i and j, Feeding profile of UAS-dTRPA1/+ heterozygous control flies after group enrichment/social isolation at 22°C for 7 days or at 28°C for 7 days. k and l, Feeding profile of P2-GAL4/+ heterozygous control flies after group enrichment/social isolation at 22°C for 7 days or at 28°C for 7 days. m and n, Feeding profile of flies expressing UAS-dTRPA1 under the control of P2-GAL4 after group enrichment/social isolation at 22°C for 7 days or at 28°C for 7 days. Sleep profiles are displayed as the average proportion of time spent sleeping in consecutive 30min segments during a 24hr LD cycle; solid line, Mean; shaded area, ±SEM. Feeding profiles are presented as average food consumption (μL) in consecutive 30min segments during a 24hr LD cycle; solid line, Mean; shaded area, ±SEM; b–e and i–n, N=28–32 animals.
Extended Data Fig. 10.
Extended Data Fig. 10.. Sleep profiles of flies in which P2 neurons were thermally activated by expressing UAS-dTPRA1 during chronic (7 days) group enrichment/social isolation; parental and temperature controls are included.
a, Schematics of activating P2 neurons for 7 days of group enrichment/social isolation. 22°C treatments (no thermoactivation) were used as controls. Flies in group enrichment/social isolation were kept at 28°C for 7 days to thermally activate P2 neurons. After 7 days of thermal activation (or no activation), sleep behavior was measured at 22°C. b and c, Sleep profile of UAS-dTRPA1/+ heterozygous control flies after group enrichment/social isolation at 22°C for 7 days or at 28°C for 7 days. d and e, Sleep profile of P2-GAL4/+ heterozygous control flies after group enrichment/social isolation at 22°C for 7 days or at 28°C for 7 days. f and g, Sleep profile of flies expressing UAS-dTRPA1 under the control of P2-GAL4 after group enrichment/social isolation at 22°C for 7 days or at 28°C for 7 days. h, Quantification (Mean±SEM with individual data points) of daily total sleep, daytime sleep and ZT0-4 sleep for experimental and heterozygous control flies grouped or isolated for 7 days with (28°C) or without (22°C) thermal activation of P2-GAL4 labelled neurons. Sleep profiles are displayed as the average proportion of time spent sleeping in consecutive 30min segments during a 24hr LD cycle; solid line, Mean; shaded area, ±SEM. For h, two-way ANOVA were used for detecting interactions between temperature treatment and group/isolation status. Šidák multiple comparisons tests were used for post-hoc analyses between group treated and isolated animals of the same genotype and temperature treatment, *P<0.05, **P<0.01, ***P<0.001, ****P<0.0001; b–h, N=29–32 animals. For N and P values, see the Source Data.
Fig. 1:
Fig. 1:. Sleep is reduced by chronic but not acute social isolation in Drosophila
a, Schematics of measuring sleep using Drosophila Activity Monitors after 1, 3, 5 or 7 days of group enrichment/social isolation. b–e, Sleep profiles (displayed as the average proportion of time spent sleeping in consecutive 30min segments during a 24hr LD cycle; solid line, Mean; shaded area, ±SEM) of flies after 1 (b), 3 (c), 5 (d) and 7(e) days of group enrichment/social isolation. f–i, Quantification (Mean±SEM with individual data points) of daily total sleep, daytime sleep and ZT0-4 sleep for flies after 1 (f), 3 (g), 5 (h) and 7(i) days of group enrichment/social isolation. j–m, Plots of cumulative relative frequency for distributions of daytime sleep bouts for flies after 1(j), 3 (k), 5 (l) and 7(m) days of group enrichment/social isolation. (See Extended Data Fig. 2a–d for density plots of the same dataset). n–p, Normalized (Mean±SEM) daily total sleep (n), daytime sleep (o), and ZT0-4 sleep (p) along social isolation/group enrichment process of up to 7 days. For each group enrichment/social isolation duration, sleep parameters for socially isolated animals were normalized to its group-treated counterparts. For b–i and n-p, N=29–32 animals; two-sided unpaired t-tests with Welch’s correction; *P<0.05, **P<0.01, ***P<0.001, ****P<0.0001. For N and P values, see the Source Data.
Fig. 2:
Fig. 2:. Chronic social isolation induces a starvation gene expression program and results in excessive feeding
a–c, Raster plot of sleep bouts of individual animals after group enrichment (Grp) (a), 1 day acute social isolation (Iso_1D) (c) and 7 days chronic social isolation (Iso_7D) (b). Each row is an individual animal, with each colored bar representing sleep bouts within a 24hr LD cycle (blue for group enrichment, red for chronic social isolation and light red for acute social isolation). Gray vertical bars indicate a ~1.5hr time window (ZT0.5-ZT2) used for collecting fly heads for RNA-Seq. 29–32 representative animals are shown for each condition. Differential gene expressions were conducted between “Iso_7D vs. Grp” and “Iso_7D vs. Iso_1D”. 274 genes were identified within the intersection of these two comparisons. 214 candidate genes were identified using a clustering approach (Extended Data Fig. 5 and Supplemental Information). d, Fold changes (Mean±SEM) of normalized counts of the top 20 candidate genes (ranked by adjusted P-value in the comparison of “Iso7 vs. Grp”) (N=3 samples). Arrows indicate genes that are regulated after 24hr starvation. e–f, Sleep (e) and feeding (f) measured by ARC (Activity Recording Capillary Feeder) assay in flies following 7 days of group enrichment/social isolation. Sleep profile is presented as the average proportion of time spent sleeping in consecutive 30min segments during a 24hr LD; Solid line, Mean; Shaded area, ±SEM. Matching average feeding profile is presented as average food consumption (μL) in consecutive 30min segments during a 24hr LD cycle; Solid line, Mean; Shaded area, ±SEM. g, Quantification (Mean±SEM with individual data points) of daily total sleep, daytime sleep, nighttime sleep and ZT0-4 sleep for flies after 7 days of group/social isolation treatment. h, Quantification (Mean±SEM with individual data points) of daily total food consumption, daytime food consumption, nighttime food consumption and ZT0-4 food consumption for flies after 7 days of group enrichment/social isolation. For e-h, N=28–30 animals; two-sided unpaired t-tests with Welch’s correction; *P<0.05, **P<0.01, ***P<0.001, ****P<0.0001. For N and P values, see the Source Data.
Fig. 3:
Fig. 3:. P2 neurons are required for chronic social isolation-induced sleep loss
a, LST-immunoreactivity-positive cells overlaps NPF-GAL4-labelled fan-shaped body neurons at fan layer and cell bodies levels. Arrowheads: LST-immunoreactivity-positive cell bodies (magenta) that are also NPF-GAL4 positive (green). Triangles: NPF P1 neurons. b, LST-immunoreactivity-positive cells overlap P2-GAL4(SS0020-split-GAL4)-labelled NPF P2 neurons at fan layer and cell bodies levels. Arrowheads indicate the majority of LST-immunoreactivity-positive cell bodies (magenta) are also P2-GAL4-positive (green), consistent with previous report that P2-GAL4 labels ~85% NPF P2 neurons. c, Expression pattern of R23E10-GAL4 (dashed ovals: cell bodies) and distribution of LST-immunoreactivity-positive cells (dashed square: cell bodies) (a–d, blue: N-cadherin, scale bar: 50μm). d, Fan-shaped body projections of three P2 neurons are decorated by FLAG tag (magenta). Each arborizes at a column of the lower layer of the FB (thinner dashed line) and projects to a different column of the higher layer of the FB (thicker dashed line, projections: 1->1’, 2->2’, 3->3’). These three neurons also arborize at the ellipsoid body level (donut-shaped area) (blue: Bruchpilot, scale bar: 50μm). e–h, Sleep profile (e), sleep bouts distributions (f) and sleep bouts raster plots (g and h) of flies expressing UAS-Kir2.1 with P2-GAL4 after group enrichment/social isolation for 7 days (N=48–56 animals). i–l, Sleep profile (i, k) and sleep bouts distributions (j, l) of parental control flies after group enrichment/social isolation for 7 days (N=19–32 animals). m, Quantification (Mean±SEM with individual data points) of daily total sleep, daytime sleep and ZT0-4 sleep for all experimental and heterozygous control flies. n, Quantification (Mean±SEM with individual data points) of daily total, daytime, and ZT0-4 food consumption for all experimental and heterozygous control flies (N=27–30 animals). Sleep profiles are displayed as the average proportion of time spent sleeping in consecutive 30min segments during a 24hr LD cycle; solid line, Mean; shaded area, ±SEM. For m–n, two-sided unpaired t-tests with Welch’s correction; *P<0.05, **P<0.01, ***P<0.001, ****P<0.0001. For N and P values, see the Source Data.
Fig. 4:
Fig. 4:. Activation of P2 neurons during acute social isolation induces sleep loss and over consumption of food.
a, Schematics of activating P2 neurons for 1 day of group enrichment/social isolation. 22°C treatments (no thermoactivation) were used as controls. Flies in group enrichment/social isolation were kept at 28°C for 1 day to thermally activate P2 neurons. After 1 day of thermal activation (or no activation), sleep or feeding behavior was measured at 22°C. b, Quantification (Mean±SEM with individual data points) of daily total sleep, daytime sleep and ZT0-4 sleep for experimental and heterozygous control flies grouped or isolated for 1 day with (28°C) or without (22°C) thermal activation of P2-GAL4 labelled neurons (N= 28–32 animals). c, Quantification (Mean±SEM with individual data points) of daily total food consumption, daytime food consumption, and ZT0-4 food consumption for experimental and heterozygous control flies grouped or isolated for 7 days with (28°C) or without (22°C) thermal activation of P2-GAL4 labelled neurons (N=22–57 animals). For b–c, two-way ANOVA were used for detecting interactions between temperature treatment and group/isolation status. Šidák multiple comparisons tests were used for post-hoc analyses between group treated and isolated animals of the same genotype and temperature treatment, *P<0.05, **P<0.01, ***P<0.001, ****P<0.0001. For N and P values, see the Source Data.

Comment in

References

    1. Cacioppo JT & Cacioppo S The growing problem of loneliness. Lancet 391, 426, doi:10.1016/S0140-6736(18)30142-9 (2018). - DOI - PMC - PubMed
    1. Steptoe A, Shankar A, Demakakos P & Wardle J Social isolation, loneliness, and all-cause mortality in older men and women. Proc Natl Acad Sci U S A 110, 5797–5801, doi:10.1073/pnas.1219686110 (2013). - DOI - PMC - PubMed
    1. Holt-Lunstad J, Smith TB & Layton JB Social relationships and mortality risk: a meta-analytic review. PLoS Med 7, e1000316, doi:10.1371/journal.pmed.1000316 (2010). - DOI - PMC - PubMed
    1. Holt-Lunstad J, Smith TB, Baker M, Harris T & Stephenson D Loneliness and social isolation as risk factors for mortality: a meta-analytic review. Perspect Psychol Sci 10, 227–237, doi:10.1177/1745691614568352 (2015). - DOI - PubMed
    1. Cacioppo JT et al.Loneliness and health: potential mechanisms. Psychosom Med 64, 407–417, doi:10.1097/00006842-200205000-00005 (2002). - DOI - PubMed

Publication types

MeSH terms