. 2021 Aug 11:14:3781-3795.
doi: 10.2147/JIR.S323026. eCollection 2021.

Characterization of Virus Replication, Pathogenesis, and Cytokine Responses in Syrian Hamsters Inoculated with SARS-CoV-2

Affiliations

Characterization of Virus Replication, Pathogenesis, and Cytokine Responses in Syrian Hamsters Inoculated with SARS-CoV-2

Shiu-Ju Yang et al. J Inflamm Res. .

Abstract

Background: Severe acute respiratory syndrome coronavirus 2 (SARS-CoV-2) is a novel coronavirus which caused a global respiratory disease pandemic beginning in December 2019. Understanding the pathogenesis of infection and the immune responses in a SARS-CoV-2-infected animal model is urgently needed for vaccine development.

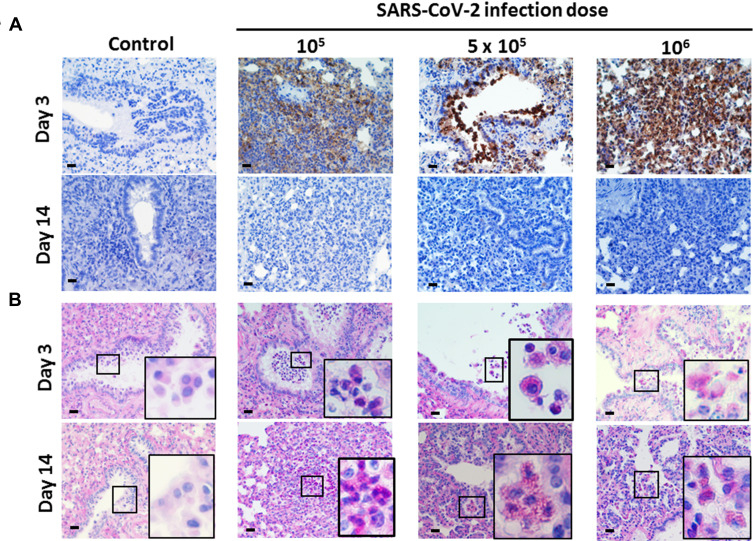
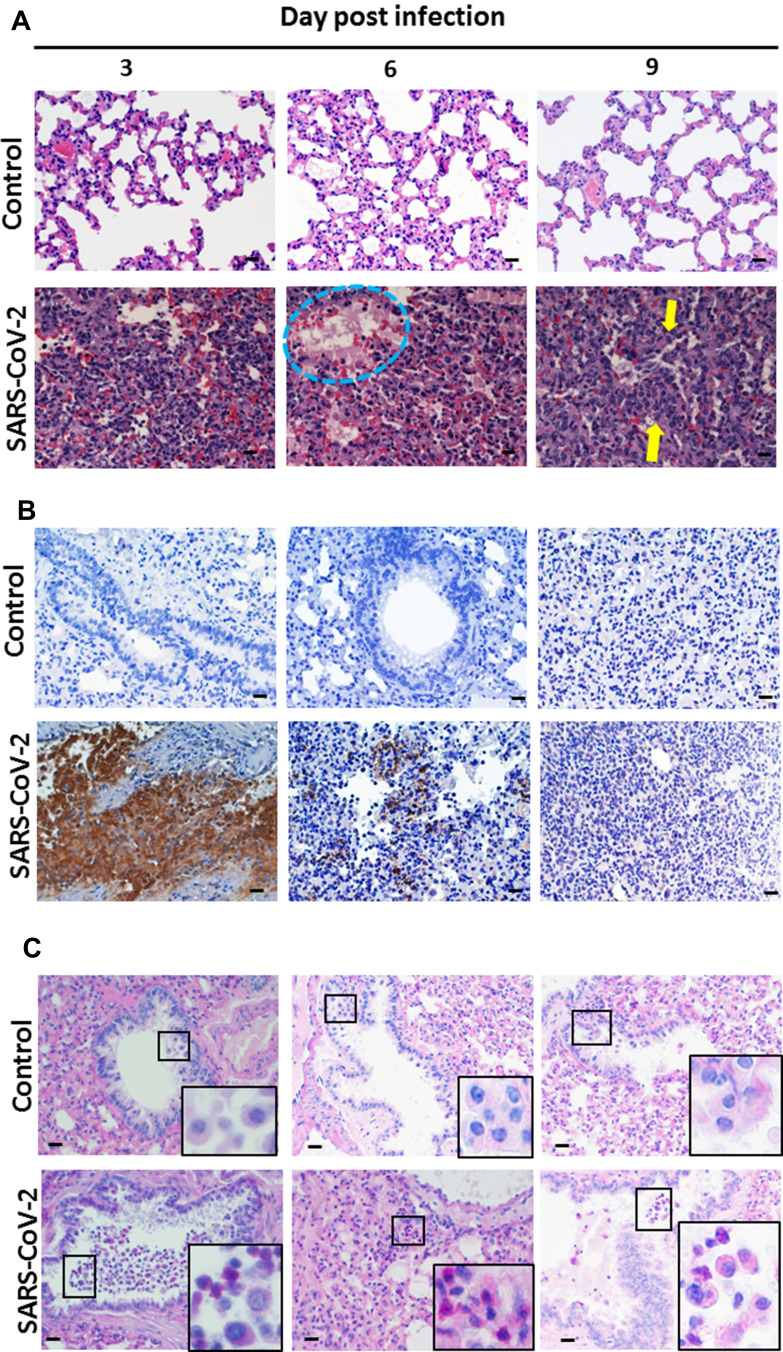
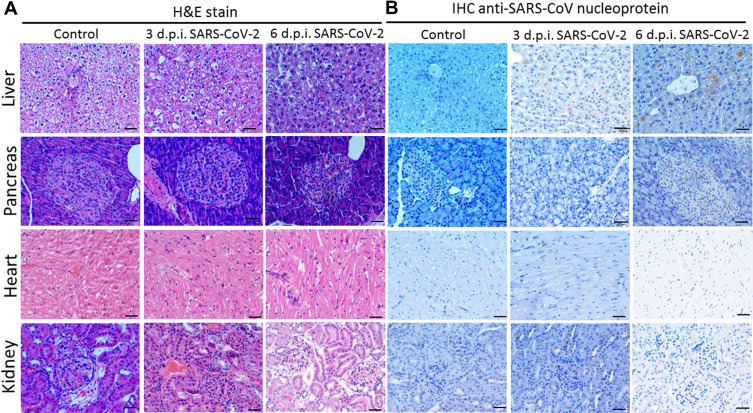
Methods: Syrian hamsters (Mesocricetus auratus) were intranasally inoculated with 105, 5×10⁵, and 106 TCID50 of SARS-CoV-2 per animal and studied for up to 14 days. Body weight, viral load and real-time PCR amplification of the SARS-CoV-2 N gene were measured. On days 3, 6 and 9, lung, blood, liver, pancreas, heart, kidney, and bone marrow were harvested and processed for pathology, viral load, and cytokine expression.

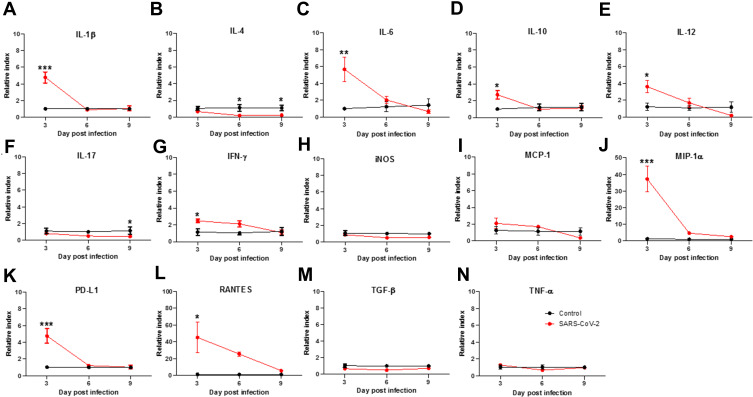
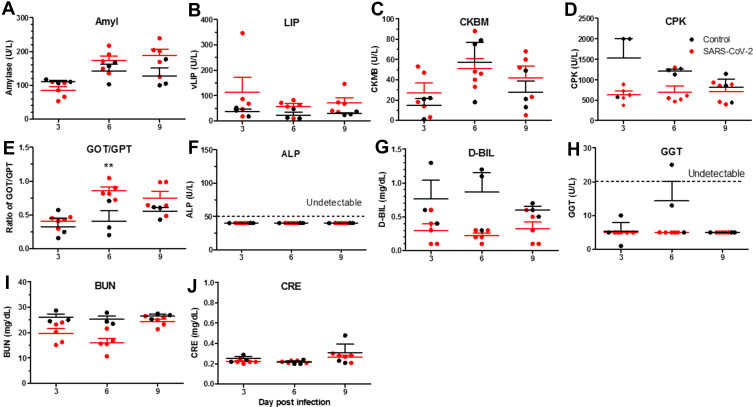
Results: Body weight loss, increased viral load, immune cell infiltration, upregulated cytokine expression, viral RNA, SARS-CoV-2 nucleoprotein, and mucus were detected in the lungs, particularly on day 3 post-infection. Extremely high expression of the pro-inflammatory cytokines MIP-1 and RANTES was detected in lung tissue, as was high expression of IL-1β, IL-6, IL-12, and PD-L1. The glutamic oxalacetic transaminase/glutamic pyruvic transaminase (GOT/GPT) ratio in blood was significantly increased at 6 days post-infection, and plasma amylase and lipase levels were also elevated in infected hamsters.

Conclusion: Our results provide new information on immunological cytokines and biological parameters related to the pathogenesis and immune response profile in the Syrian hamster model of SARS-CoV-2 infection.

Keywords: SARS-CoV-2; hamster; immune response; pathogenesis.


Conflict of interest statement

The authors report no conflicts of interest in this work.

Figures

Figure 1
Figure 1
Body weight change, viral load, and pathological changes of SARS-CoV-2-infected Syrian hamsters following different challenge doses. (A) Body weights of hamsters infected with 105, 5 × 10⁵, and 106 TCID50 of SARS-CoV-2 (n=5 per group, and non-infected control, n=5) over 14 days (compared with the weight on day 0). Differences among groups were determined using two-way ANOVA with a Bonferroni post hoc test (*P<0.05; **P < 0.01; ***P < 0.001, control vs all infected groups). (B) Viral loads (TCID50/lung) of hamsters infected with 105, 5×10⁵, and 106 TCID50 of SARS-CoV-2 (n=5 per group, and non-infected control, n=5) on day 3. Differences among groups were determined using one-way ANOVA with a Tukey post hoc test (**P < 0.01, control vs 106). (C) Quantitative PCR of the SARS-CoV-2 N gene in hamsters infected with 105, 5×10⁵, and 106 TCID50 of SARS-CoV-2 on day 3. Differences among groups were determined by using one-way ANOVA with a Tukey post hoc test (**P < 0.01, control vs 106). (D) On days 3 and 14, samples of lung tissue were fixed in formalin and embedded in paraffin using routine methods, and the sections were then stained with H&E. Yellow dotted circle outlines several foci of inflammatory cell infiltration, with predominantly mononuclear cells, neutrophils and some macrophages. Green arrow presents macrophage aggregates in the airway and alveolar spaces. The panels show representative results from the 5×10⁵ TCID50 infection dose. Scale bar for 400× panels = 20 µm. (E) In situ hybridization. The sections were hybridized with N gene RNA probe (anti-nucleoprotein). The panels show representative results from the 5×10⁵ TCID50 infection dose. Scale bar for 200× panels = 50 µm.
Figure 2
Figure 2
SARS-CoV-2 nucleoprotein expression and mucosal mucus levels in SARS-CoV-2-infected Syrian hamsters following different challenge doses. Hamsters aged 6 to 8 weeks (n=5) were infected with 105, 5×10⁵, and 106 TCID50 of SARS-CoV-2 on day 0. (A) On days 3 and 14, samples of lung tissue were dissected, fixed in formalin and embedded in paraffin using routine methods, and the sections were then stained with anti-SARS-CoV nucleoprotein antibody. (B) PAS staining was performed on the same paraffin-embedded sections. The small box frame in each panel shows the macrophages that scavenged the extra mucus near the trachea. The large box frame shows an enlargement of macrophage phagocytosis. Scale bar for the 100× panels = 200 µm, for the 400× panels = 20 µm.
Figure 3
Figure 3
Viral load changes and tissue tropism in SARS-CoV-2-infected Syrian hamsters on days 3, 6, and 9 post-infection. (A) Viral loads (TCID50/lung) of hamsters infected with 5×10⁵ TCID50 of SARS-CoV-2 (n=5 for SARS-CoV-2, and n=3 for non-infected controls) on days 3, 6, and 9 (B, EH). N=4 for panel (C and D). Quantitative PCR of hamster lung (B), liver (C), pancreas (D), heart (E), kidney (F), PBMC (G), and bone marrow (BM) (H) of the SARS-CoV-2 N gene (from CCDC) on days 3, 6, and 9 post-infection. Differences among groups were determined using two-way ANOVA with a Bonferroni post hoc test (*P<0.05, control vs SARS-CoV-2 at 6 d.p.i.; **P < 0.01, control vs SARS-CoV-2 at 3 d.p.i.; ***P < 0.001, control vs SARS-Cov-2 at 3 d.p.i.) in panels (A–H), p value is not shown for no significance among groups.
Figure 4
Figure 4
Pathological changes in SARS-CoV-2-infected hamster lung on days 3, 6, and 9 post-infection. Syrian hamsters aged 6 to 8 weeks (n=5 for SARS-CoV-2, and n=3 for non-infected control) were infected with 5×10⁵ TCID50 of SARS-CoV-2 on day 0. On days 3, 6, and 9, samples of lung and trachea tissue were removed, fixed in formalin and embedded in paraffin using routine methods, and then processed for staining. (A) Samples of lung sections stained with H&E. The blue dotted circle outlines hyaline membrane formation. The yellow arrows present macrophage aggregates in the airway and alveolar spaces. (B) Lung sections immunostained with anti-SARS-CoV nucleoprotein antibody. (C) PAS staining showing mucus expression in hamster lung. Small box frames show macrophages that scavenged the extra mucus near the trachea. Large box frames show enlargements of macrophage phagocytosis. Scale bar for the 400× panels = 20 µm.
Figure 5
Figure 5
SARS-CoV nucleoprotein expression in SARS-CoV-2-infected hamsters post-infection day 3 and 6. (A) Syrian hamsters aged 6 to 8 weeks (n=5 for SARS-CoV-2, and n=3 for non-infected control) were infected with 5×10⁵ TCID50 of SARS-CoV-2. Liver, pancreas, heart and kidney sections were stained by H&E on day 3 and 6. (B) IHC staining for SARS-CoV nucleoprotein expression in the tissue sections. Scale bar for 400× panels = 20 µm.
Figure 6
Figure 6
Anti-spike neutralizing antibody in SARS-CoV-2-infected hamsters. (A) Syrian hamsters aged 6 to 8 weeks (n=5 for SARS-CoV-2, and n=3 for non-infected control) were infected with 105, 5×10⁵, and 106 TCID50 of SARS-CoV-2 on day 0. Anti-spike neutralizing antibody of plasma was detected by ELISA following the manufacturer’s protocol. Differences among groups were determined using one-way ANOVA with a Tukey post hoc test, P>0.05, no significant among all groups. (B) Syrian hamsters aged 6 to 8 weeks (n=5 for SARS-CoV-2, and n=3 for non-infected control) were infected with 5×10⁵ TCID50 of SARS-CoV-2 on days 3, 6, and 9. Anti-spike neutralizing antibody of plasma was detected by ELISA following the manufacturer’s protocol. Differences among groups were determined using two-way ANOVA with a Bonferroni post hoc test (***P < 0.001, control vs SARS-CoV-2 at 9 d.p.i.).
Figure 7
Figure 7
Cytokine expression in lungs of SARS-CoV-2-infected hamsters on days 3, 6, and 9 post-infection. Hamsters were infected with 5×10⁵ TCID50 of SARS-CoV-2 (n=5 for SARS-CoV-2, and n=3 for non-infected control). On days 3, 6, and 9 post-infection, the hamsters were sacrificed, lung RNA was extracted, and cytokine gene expression profiles were determined by using qPCR. Relative index is presented as 2−ΔΔCT and the mean ± SEM of the numeric values in each SARS-CoV-2 group is also presented below at 3, 6, and 9 d.p.i., respectively. (A) IL-1β (4.787±0.592, 0.892±0.159, 1.054±0.270), (B) IL-4 (0.665±0.157, 0.190±0.043, 0.238±0.082), (C) IL-6 (5.682±1.304, 2.038±0.368, 0.666±0.198), (D) IL-10 (2.701±0.466, 1.004±0.143, 1.112±0.251), (E) IL-12 (3.610±0.653, 1.684±0.499, 0.198±0.024), (F) IL-17 (0.804±0.087, 0.493±0.0455, 0.456±0.0792), (G) IFN-γ (2.479±0.209, 2.106±0.328, 1.094±0.242), (H) iNOS (0.883±0.128, 0.513±0.024, 0.560±0.054), (I) MCP-1 (2.097±0.543, 1.696±0.171, 0.362±0.049), (J) MIP-1α (37.216±6.960, 4.745±0.496, 2.589±0.409), (K) PD-L1 (4.754±0.775, 1.221±0.168, 1.025±0.201), (L) RANTES (45.247±16.554, 25.458±2.261, 5.574±0.834, (M) TGF-β (0.672±0.073, 0.507±0.0231, 0.716±0.1228), (N) TNF-α (1.288±0.1220, 0.68±0.0517, 0.968±0.1251). Differences among groups were determined using two-way ANOVA with a Bonferroni post hoc test in panels (A–N) (*P < 0.05; **P < 0.01; ***P < 0.001), no significance among groups is not shown.
Figure 8
Figure 8
Blood biological and chemistry parameters in SARS-CoV-2-infected hamsters on days 3, 6, and 9 post-infection. Hamsters were infected with 5×10⁵ TCID50 of SARS-CoV-2 (n=5 for SARS-CoV-2, and n=3 for non-infected control). On days 3, 6, and 9 post-infection, plasma was collected and stored at −80°C until use. Multiple biological and chemistry parameters were analyzed with Fuji Dri-Chem slides on a Fujifilm Dri-Chem 4000 analyzer. (A) Amylase (Amyl). (B) Lipase (LIP). (C) Creatine phosphokinase isozyme KB (CKMB). (D) Creatine phosphokinase (CPK). (E) Ratio of glutamic oxalacetic transaminase/glutamic pyruvic transaminase (GOT/GPT). (F) Alkaline phosphatase (ALP). (G) Direct Bilirubin (D-BIL). (H) γ-Glutamyltransferase (GGT). (I) Urea nitrogen (BUN). (J) Creatinine (CRE). Differences among groups were determined using two-way ANOVA with a Bonferroni post hoc test in panels (A–J) (**P < 0.01), no significance among groups is not shown.

Similar articles

Cited by

References

    1. Zhu N, Zhang D, Wang W, et al. A novel coronavirus from patients with pneumonia in China, 2019. New Engl J Med. 2020;382(8):727–733. doi:10.1056/NEJMoa2001017 - DOI - PMC - PubMed
    1. WHO. Coronavirus Disease (COVID-19) Pandemic; 2020. - PubMed
    1. Li W, Moore MJ, Vasilieva N, et al. Angiotensin-converting enzyme 2 is a functional receptor for the SARS coronavirus. Nature. 2003;426(6965):450–454. doi:10.1038/nature02145 - DOI - PMC - PubMed
    1. Chan JF-W, Zhang AJ, Yuan S, et al. Simulation of the clinical and pathological manifestations of Coronavirus Disease 2019 (COVID-19) in golden Syrian hamster model: implications for disease pathogenesis and transmissibility. Clin Infect Dis. 2020:ciaa325. doi:10.1093/cid/ciaa325. - DOI - PMC - PubMed
    1. Jia HP, Look DC, Shi L, et al. ACE2 receptor expression and severe acute respiratory syndrome coronavirus infection depend on differentiation of human airway epithelia. J Virol. 2005;79(23):14614–14621. doi:10.1128/JVI.79.23.14614-14621.2005 - DOI - PMC - PubMed