. 2021 Aug 2:15:657884.
doi: 10.3389/fnsys.2021.657884. eCollection 2021.

Chronic Ethanol Exposure Enhances Facial Stimulation-Evoked Mossy Fiber-Granule Cell Synaptic Transmission via GluN2A Receptors in the Mouse Cerebellar Cortex

Affiliations

Chronic Ethanol Exposure Enhances Facial Stimulation-Evoked Mossy Fiber-Granule Cell Synaptic Transmission via GluN2A Receptors in the Mouse Cerebellar Cortex

Bing-Xue Li et al. Front Syst Neurosci. .

Abstract

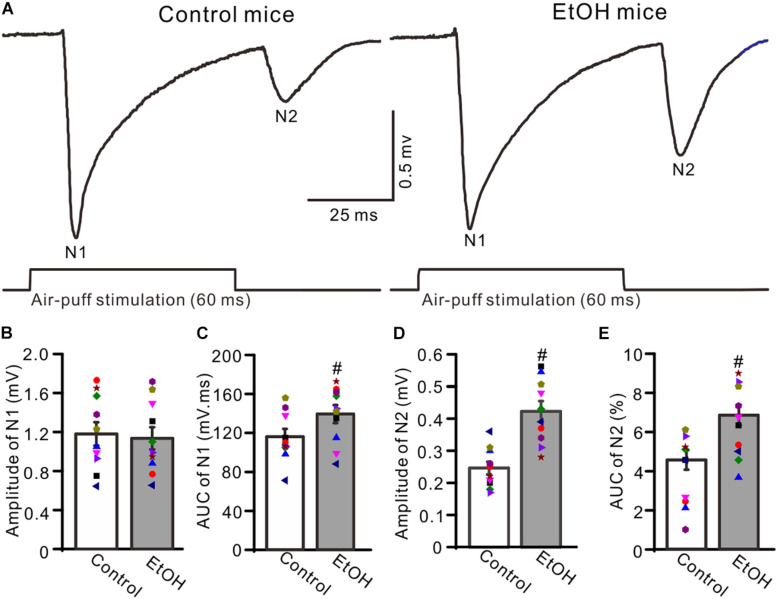
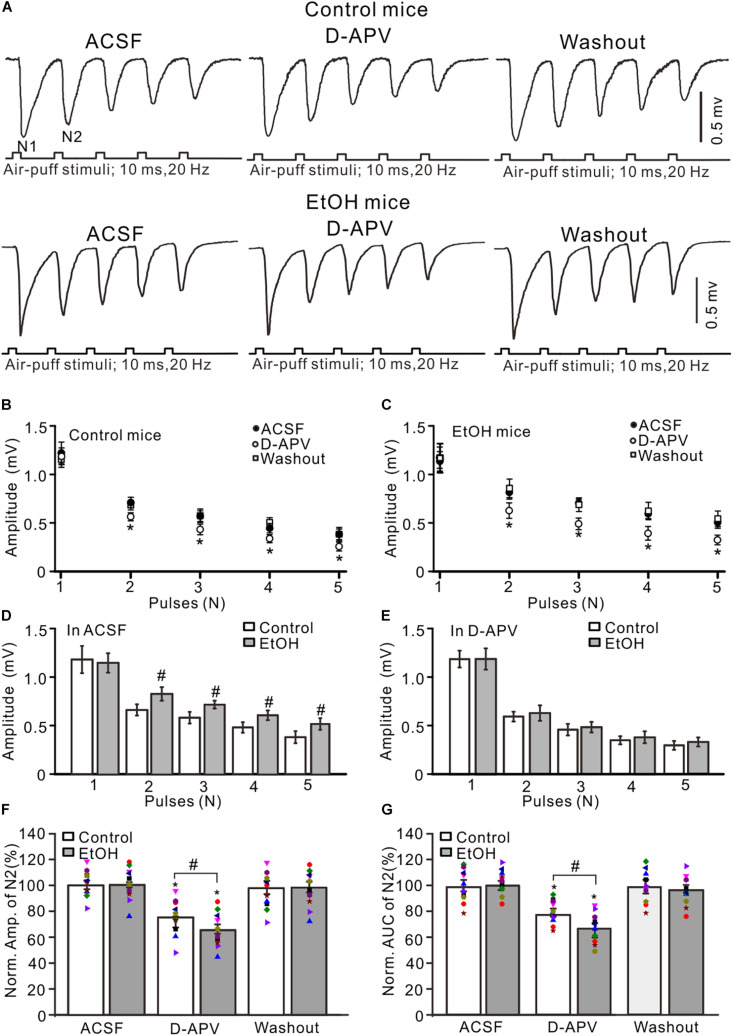
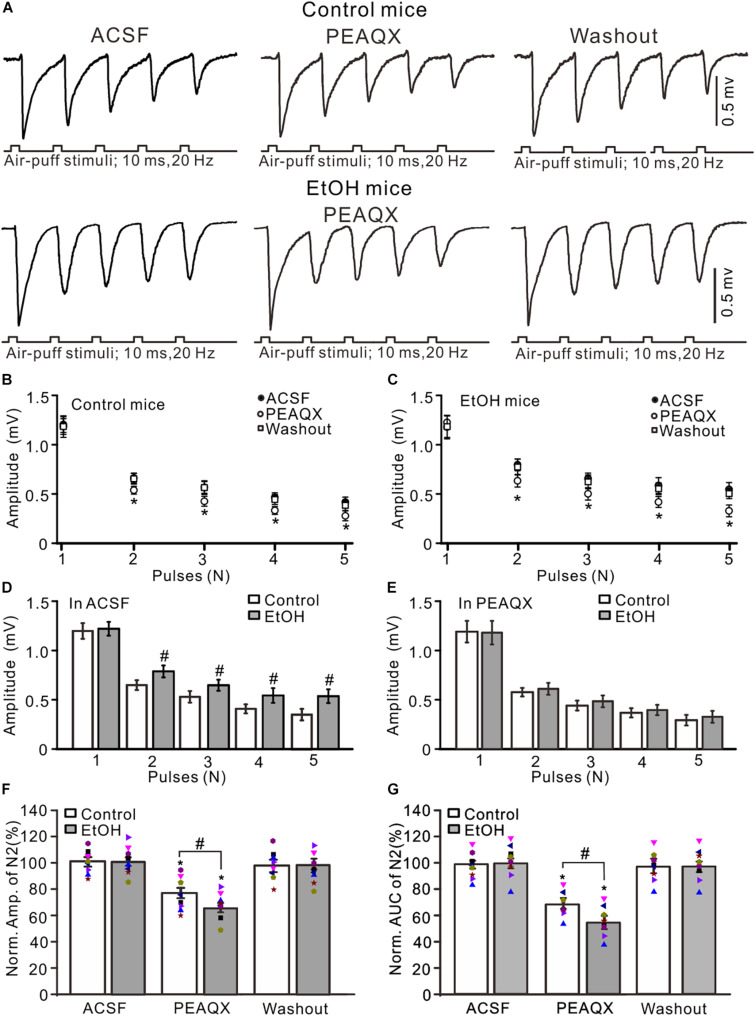
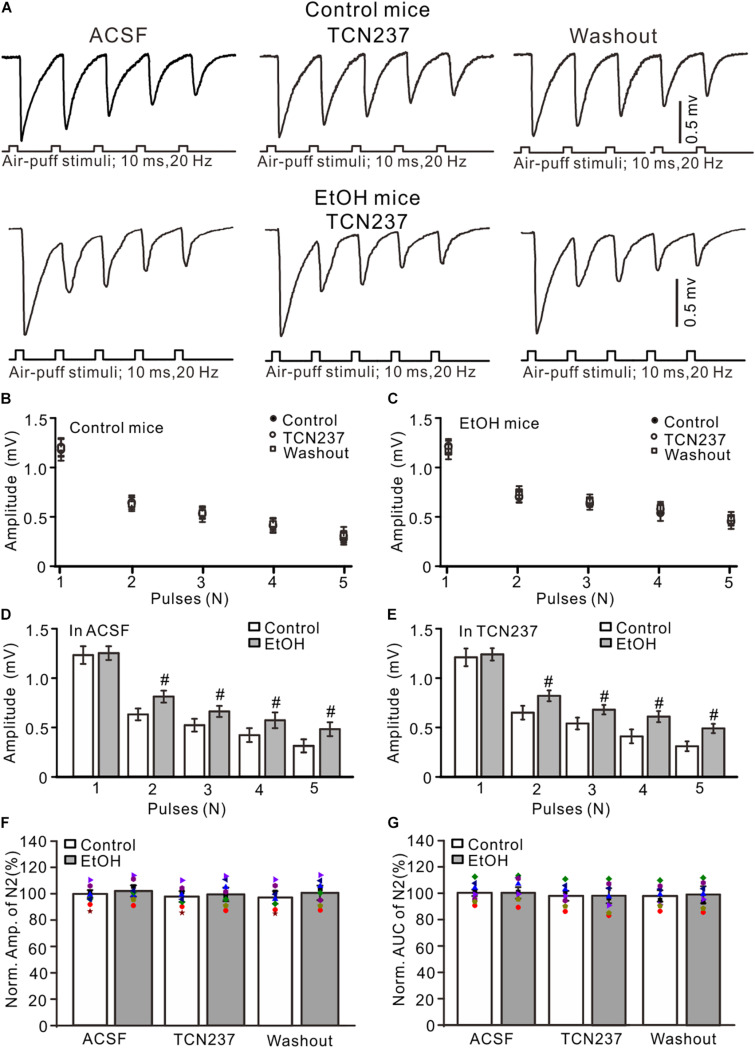
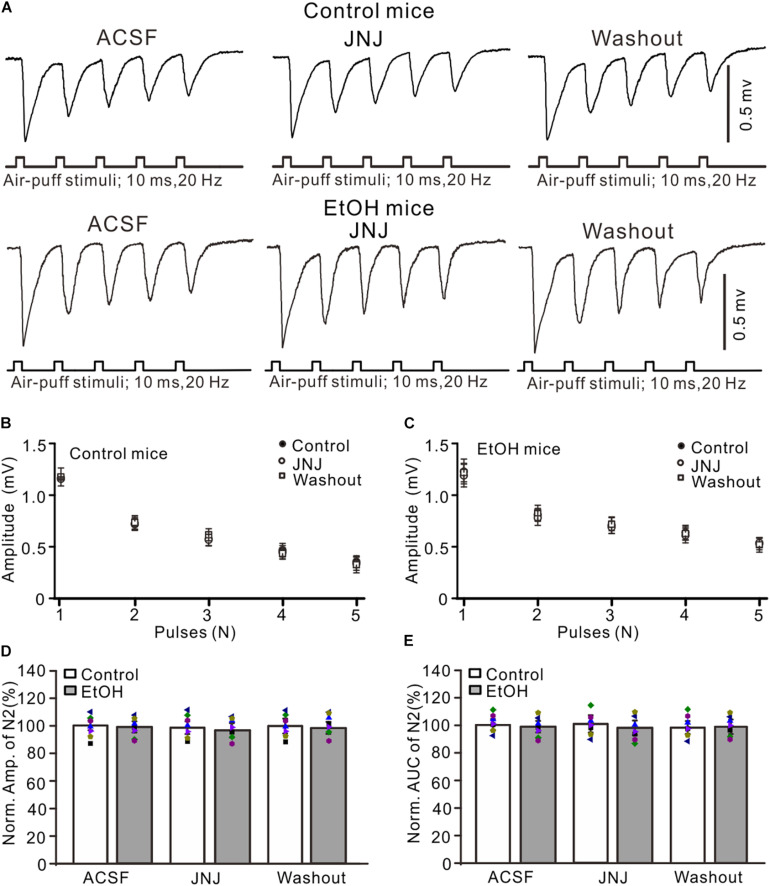
Sensory information is transferred to the cerebellar cortex via the mossy fiber-granule cell (MF-GC) pathway, which participates in motor coordination and motor learning. We previously reported that chronic ethanol exposure from adolescence facilitated the sensory-evoked molecular layer interneuron-Purkinje cell synaptic transmission in adult mice in vivo. Herein, we investigated the effect of chronic ethanol exposure from adolescence on facial stimulation-evoked MF-GC synaptic transmission in the adult mouse cerebellar cortex using electrophysiological recording techniques and pharmacological methods. Chronic ethanol exposure from adolescence induced an enhancement of facial stimulation-evoked MF-GC synaptic transmission in the cerebellar cortex of adult mice. The application of an N-methyl-D-aspartate receptor (NMDAR) antagonist, D-APV (250 μM), induced stronger depression of facial stimulation-evoked MF-GC synaptic transmission in chronic ethanol-exposed mice compared with that in control mice. Chronic ethanol exposure-induced facilitation of facial stimulation evoked by MF-GC synaptic transmission was abolished by a selective GluN2A antagonist, PEAQX (10 μM), but was unaffected by the application of a selective GluN2B antagonist, TCN-237 (10 μM), or a type 1 metabotropic glutamate receptor blocker, JNJ16259685 (10 μM). These results indicate that chronic ethanol exposure from adolescence enhances facial stimulation-evoked MF-GC synaptic transmission via GluN2A, which suggests that chronic ethanol exposure from adolescence impairs the high-fidelity transmission capability of sensory information in the cerebellar cortex by enhancing the NMDAR-mediated components of MF-GC synaptic transmission in adult mice in vivo.

Keywords: N-methyl-D-aspartate receptors; cerebellar cortex; chronic ethanol exposure; in vivo electrophysiological recording; mossy fiber-granule cell synaptic transmission; sensory stimulation.


Conflict of interest statement

The authors declare that the research was conducted in the absence of any commercial or financial relationships that could be construed as a potential conflict of interest.

Figures

FIGURE 1
FIGURE 1
Chronic ethanol exposure enhanced the facial stimulation-evoked mossy fiber-granule cell (MF–GC) synaptic transmission in the mouse cerebellar cortex. (A) Representative field potential recording traces showing the facial stimulation (60 ms, 50 psi)-evoked responses in the granular layer (GL) of control and ethanol-exposed mice. (B) The mean and individual data (Symbols of different colors) show the amplitude of N1 in control and ethanol-exposed (EtOH) mice. (C) A bar graph with individual data showing the area under the curve (AUC) of N1 in control and ethanol-exposed (EtOH) mice. (D,E) Bar graphs and individual data showing the amplitude (D) and AUC (E) of N2 in control and ethanol-exposed (EtOH) mice. n = 10 in each group. #P < 0.05 vs. control.
FIGURE 2
FIGURE 2
Blockade of N-methyl-D-aspartate receptors (NMDARs) prevented the chronic ethanol exposure-induced enhancement of facial stimulation-evoked MF–GC synaptic transmission. (A) Representative field potential traces showing that the air-puff stimuli (10 ms, 60 psi; 5 pulse, 20 Hz) on the ipsilateral whisker pad evoked field potential responses recorded from the GL of control (upper) and ethanol-exposed (lower) mice in treatments with artificial cerebrospinal fluid (ACSF), D-APV (250 μM), and recovery (washout). (B) Summary of data showing the absolute amplitudes of N1–N5 in treatments with ACSF, D-APV, and recovery (washout) in control mice. (C) Summary of data showing the absolute amplitudes of N1–N5 in treatments with ACSF, D-APV (250 μM), and recovery (washout) in ethanol-exposed mice. (D) A bar graph showing the mean amplitude of peaks recorded in the presence of ACSF in control and ethanol-exposed mice. (E) A bar graph showing the mean amplitude of peaks recorded in the presence of D-APV in control and ethanol-exposed mice. (F) A bar graph with individual data (Symbols of different colors) showing the normalized amplitude of N2 in control and ethanol-exposed (EtOH) mice in treatments with ACSF, D-APV, and recovery (washout). (G) A bar graphs with individual data (Symbols of different colors) showing the normalized AUC of N2 in control and ethanol-exposed (EtOH) mice in treatments with ACSF, D-APV, and recovery (washout). n = 10 in each group. *P < 0.05 vs. ACSF; #P < 0.05 vs. control.
FIGURE 3
FIGURE 3
Blockade of GluN2A abolished the chronic ethanol exposure-induced enhancement of facial stimulation-evoked MF–GC synaptic transmission. (A) Representative field potential traces showing that the air-puff stimuli (10 ms, 60 psi; 5 pulse, 20 Hz) on the ipsilateral whisker pad evoked field potential responses, recorded from the GL of control (upper) and ethanol-exposed mice in treatments of ACSF, PEAQX (10 μM), and recovery (washout). (B) Summary of data showing the absolute (±SEM) amplitudes of N1–N5 in treatments with ACSF, PEAQX, and recovery (washout) in control mice. (C) Summary of data showing the absolute amplitudes of N1–N5 in treatments with ACSF, PEAQX, and recovery (washout) in ethanol-exposed mice. (D) Bar graph showing the mean amplitude of peaks recorded in the presence of ACSF in control and ethanol-exposed mice. (E) A bar graph showing the mean amplitude of peaks recorded in the presence of PEAQX in control and ethanol-exposed mice. (F) A bar graph with individual data (Symbols of different colors) showing the normalized amplitude of N2 in each treatment. (G) A bar graph with individual data (Symbols of different colors) showing the normalized AUC of N2 in treatments with ACSF, PEAQX, and recovery (washout). n = 8 in each group. *P < 0.05 vs. ACSF; #P < 0.05 vs. control.
FIGURE 4
FIGURE 4
GluN2B blockade failed to prevent the ethanol exposure-induced enhancement of facial stimulation-evoked MF–GC synaptic transmission. (A) Representative field potential traces showing that the air-puff stimuli (10 ms, 60 psi; 5 pulse, 20 Hz) on the ipsilateral whisker pad evoked field potential responses, recorded from the GL of control (upper) and ethanol-exposed mice in treatments of ACSF, TCN (10 μM), and recovery (washout). (B) Summary of data showing the absolute amplitudes of N1–N5 in treatments with ACSF, TCN (10 μM), and recovery (washout) in control mice. (C) Summary of data showing the absolute amplitudes of N1–N5 in treatments with ACSF, TCN, and recovery (washout) in ethanol-exposed mice. (D,E) Bar graphs with individual data showing the normalized amplitude of N2 in ACSF (D) and in TCN237 mice. (F,G) Bar graphs with individual data (Symbols of different colors) showing the normalized amplitude (F) and AUC (G) of N2 in control and ethanol-exposed mice. n = 8 in each group. #P < 0.05 vs. control.
FIGURE 5
FIGURE 5
Blockade of mGluR1 failed to prevent the ethanol exposure-induced enhancement of facial stimulation-evoked MF–GC synaptic transmission. (A) Representative field potential traces showing that the air-puff stimuli (10 ms, 60 psi; 5 pulse, 20 Hz) on the ipsilateral whisker pad evoked field potential responses, recorded from the GL of control and ethanol-exposed mice in treatments of ACSF, JNJ (10 μM), and recovery (washout). (B) Summary of data showing the absolute amplitudes of N1–N5 in treatments with ACSF, JNJ, and recovery (washout) in control mice. (C) Pooled data showing the absolute values of N1–N5 in treatments with ACSF, JNJ, and recovery (washout) in ethanol-exposed mice. (D) A bar graph with individual data (Symbols of different colors) showing the normalized amplitude of N2 in treatments with ACSF, JNJ, and recovery (washout). (E) A bar graph with individual data (Symbols of different colors) showing the normalized AUC of N2 for each treatment. n = 7 in each group.

References

    1. Akazawa C., Shigemoto R., Bessho Y., Nakanishi S., Mizuno N. (1994). Differential expression of five N-methyl-D-aspartate receptor subunit mRNAs in the cerebellum of developing and adult rats. J. Comp. Neurol. 347 150–160. 10.1002/cne.903470112 - DOI - PubMed
    1. Arenz A., Silver R. A., Schaefer A. T., Margrie T. W. (2008). The contribution of single synapses to sensory representation in vivo. Science 321 977–980. 10.1126/science.1158391 - DOI - PMC - PubMed
    1. Best J. R., Miller P. H. (2010). A developmental perspective on executive function. Child Dev. 81 1641–1660. 10.1111/j.1467-8624.2010.01499.x - DOI - PMC - PubMed
    1. Bhattacharya S., Khatri A., Swanger S. A., DiRaddo J. O., Yi F., Hansen K. B., et al. (2018). Triheteromeric GluN1/GluN2A/GluN2C NMDARs with unique single-channel properties are the dominant receptor population in cerebellar granule cells. Neuron 99 315–328.e5. 10.1016/j.neuron.2018.06.010 - DOI - PMC - PubMed
    1. Billings G., Piasini E., Lorincz A., Nusser Z., Silver R. A. (2014). Network structure within the cerebellar input layer enables lossless sparse encoding. Neuron 83 960–974. 10.1016/j.neuron.2014.07.020 - DOI - PMC - PubMed