

Neural Conduction Along Postretinal Visual Pathways in Glaucoma
- PMID: 34408643
- PMCID: PMC8365149
- DOI: 10.3389/fnagi.2021.697425
Neural Conduction Along Postretinal Visual Pathways in Glaucoma
Abstract
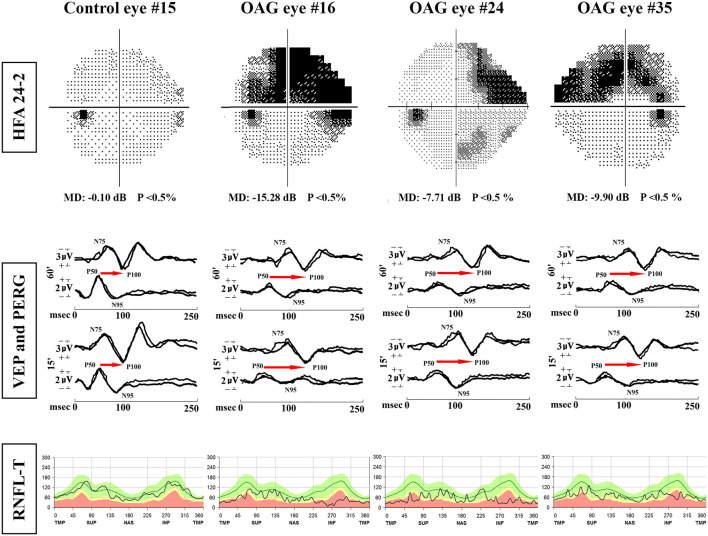
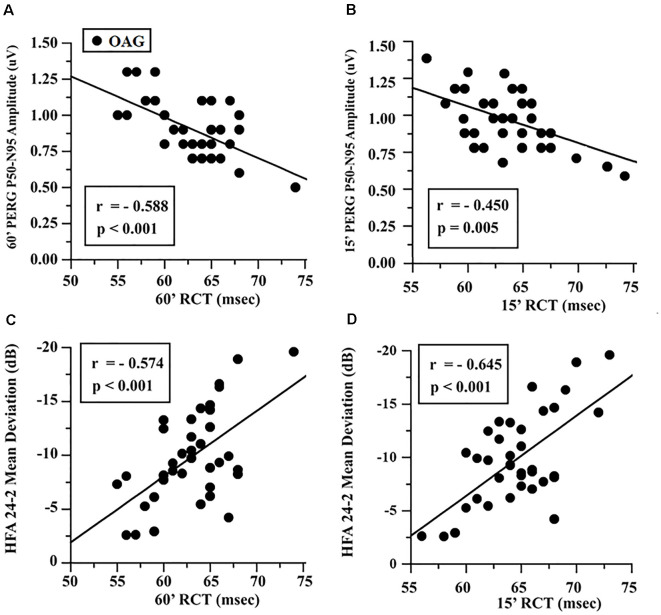
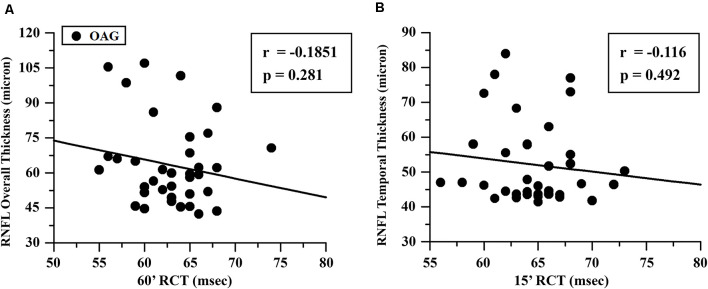
Purpose: This study was conducted in order to evaluate retinal ganglion cell (RCG) function and the neural conduction along the postretinal large and small axons and its correlation with retinal nerve fiber layer thickness (RNFL-T) in open-angle glaucoma (OAG) eyes. Methods: Thirty-seven OAG patients (mean age: 51.68 ± 9.83 years) with 24-2 Humphrey mean deviation (MD) between -2.5 and -20 dB and IOP <21 mmHg on pharmacological treatment (OAG group) and 20 age-matched controls (control group) were enrolled. In both groups, simultaneous pattern electroretinograms (PERG) and visual evoked potentials (VEP), in response to checks stimulating macular or extramacular areas (the check edge subtended 15' and 60' of visual arc, respectively), and RNFL-T (measured in superior, inferior, nasal, and temporal quadrants) were assessed. Results: In the OAG group, a significant (ANOVA, p < 0.01) reduction of 60' and 15' PERG P50-N95 and VEP N75-P100 amplitudes and of RNFL-T [overall (average of all quadrants) or temporal] with respect to controls was found; the values of 60' and 15' PERG P50 and VEP P100 implicit times and of retinocortical time (RCT; difference between VEP P100 and PERG P50 implicit times) were significantly (p < 0.01) increased with respect to control ones. The observed increased RCTs were significantly linearly correlated (Pearson's test, p < 0.01) with the reduced PERG amplitude and MD values, whereas no significant linear correlation (p < 0.01) with RNFL-T (overall or temporal) values was detected. Conclusions: In OAG, there is an impaired postretinal neural conduction along both large and small axons (increased 60' and 15' RCTs) that is related to RGC dysfunction, but independent from the RNFL morphology. This implies that, in OAG, the impairment of postretinal neural structures can be electrophysiologically identified and may contribute to the visual field defects, as suggested by the linear correlation between the increase of RCT and MD reduction.
Keywords: OCT imaging; PERG; VEP; glaucoma; visual pathways.
Copyright © 2021 Parisi, Ziccardi, Tanga, Roberti, Barbano, Carnevale, Manni and Oddone.
Conflict of interest statement
The authors declare that the research was conducted in the absence of any commercial or financial relationships that could be construed as a potential conflict of interest.
Figures
References
-
- Arden G. B., O’Sullivan F. (1992). Longitudinal follow up of glaucoma suspects tested with pattern electroretinogram. Bull. Soc. Belge. Ophtalmol. 244, 147–154. - PubMed
-
- Celesia G. G., Kaufmann D. (1985). Pattern ERG and visual evoked potentials in maculopathies and optic nerve disease. Invest. Ophthalmol. Vis. Sci. 26, 726–735. - PubMed
LinkOut - more resources
Full Text Sources
Research Materials
Miscellaneous