. 2021 Aug 2:12:710093.
doi: 10.3389/fpls.2021.710093. eCollection 2021.

Iron Deficiency Leads to Chlorosis Through Impacting Chlorophyll Synthesis and Nitrogen Metabolism in Areca catechu L

Affiliations

Iron Deficiency Leads to Chlorosis Through Impacting Chlorophyll Synthesis and Nitrogen Metabolism in Areca catechu L

Jia Li et al. Front Plant Sci. .

Abstract

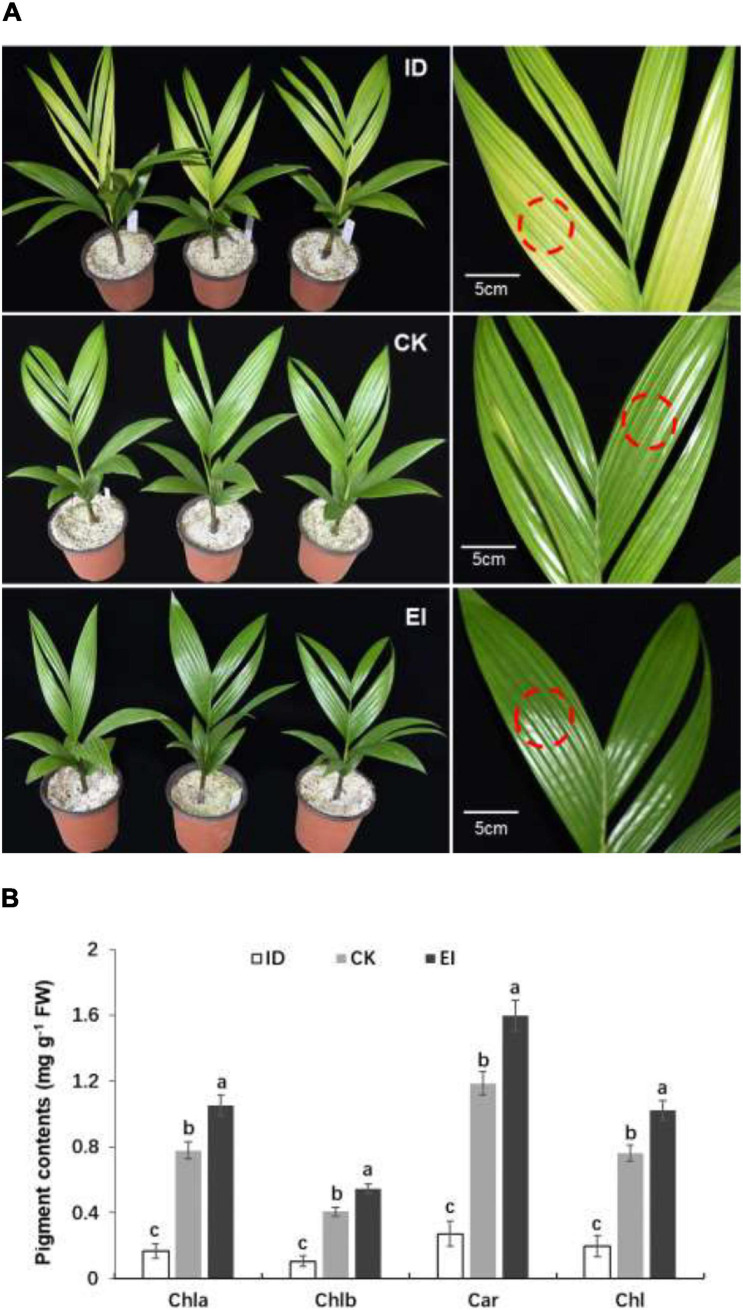
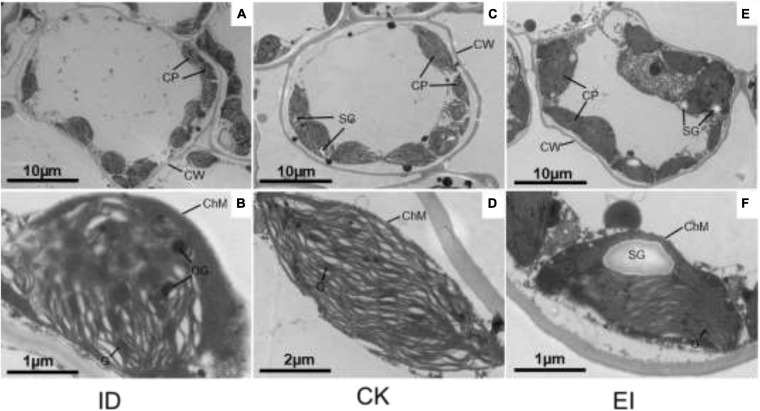
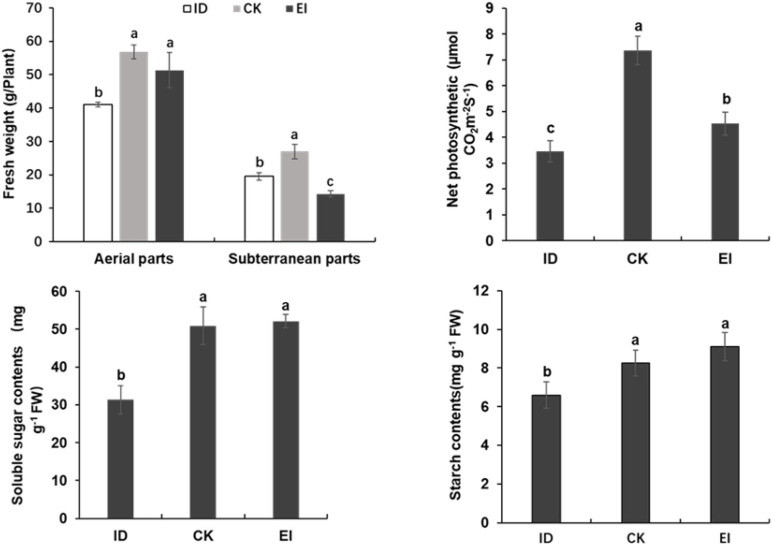
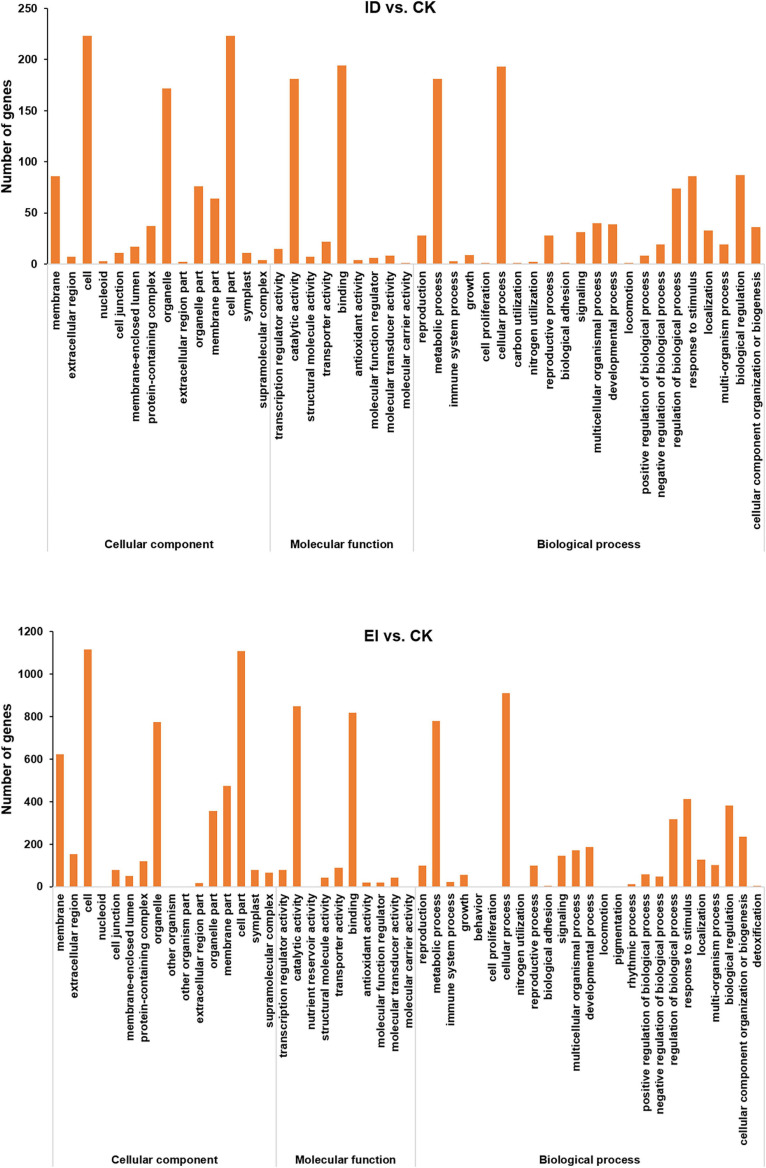
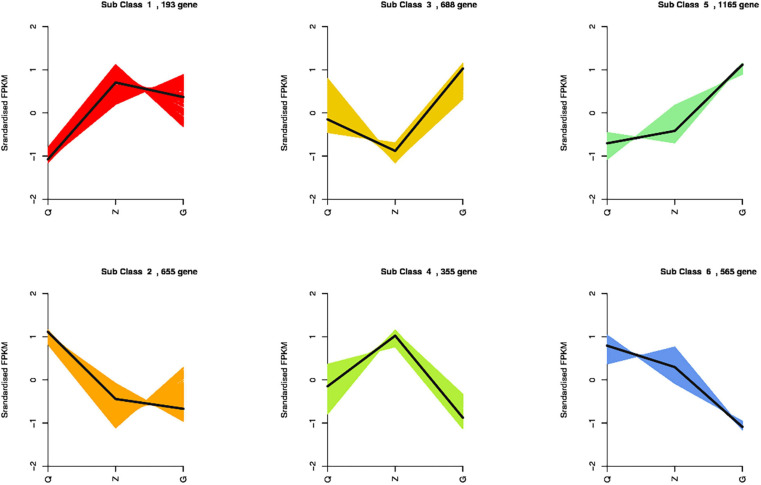
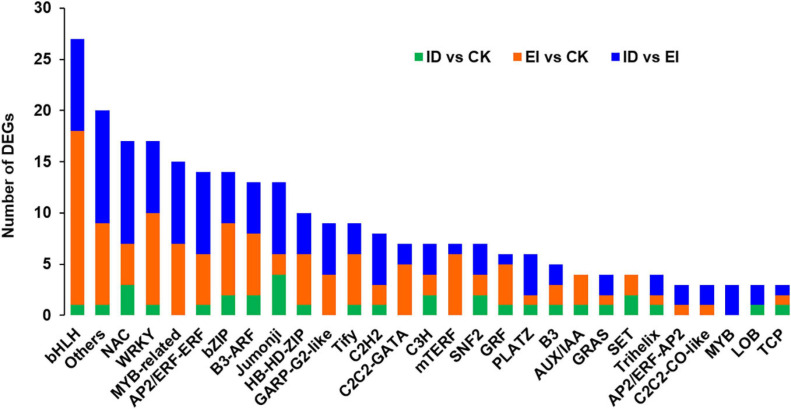
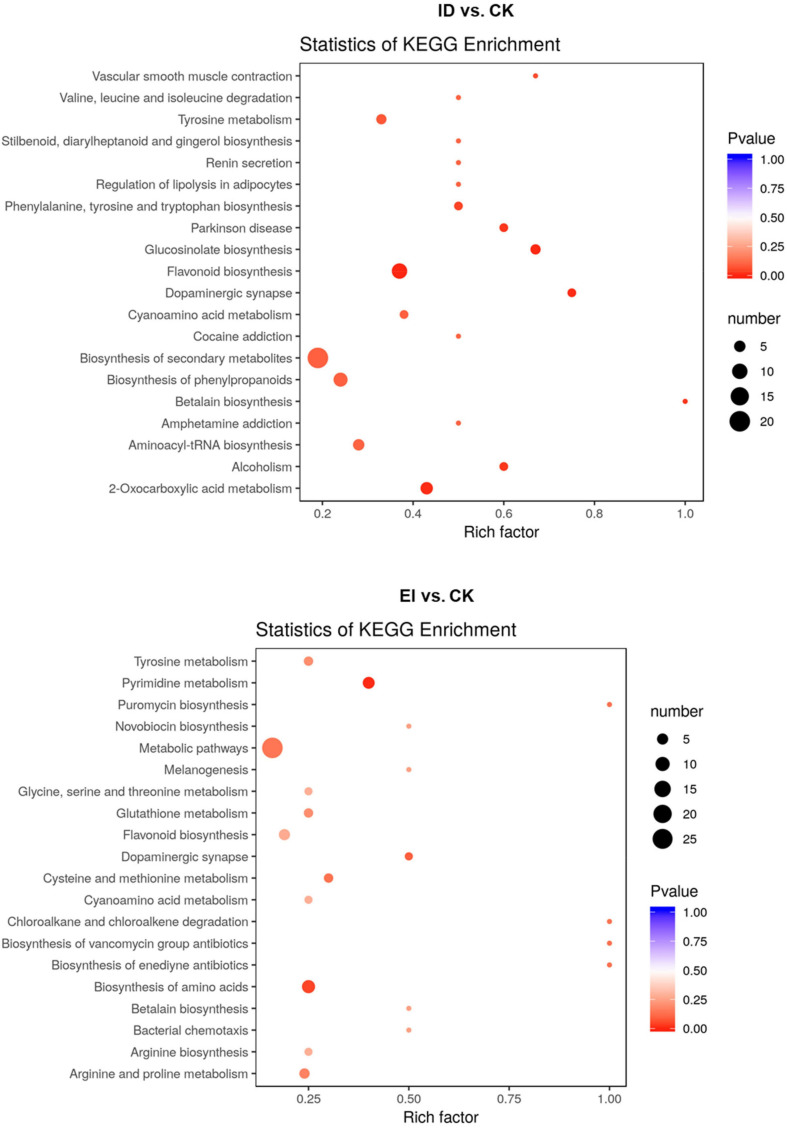
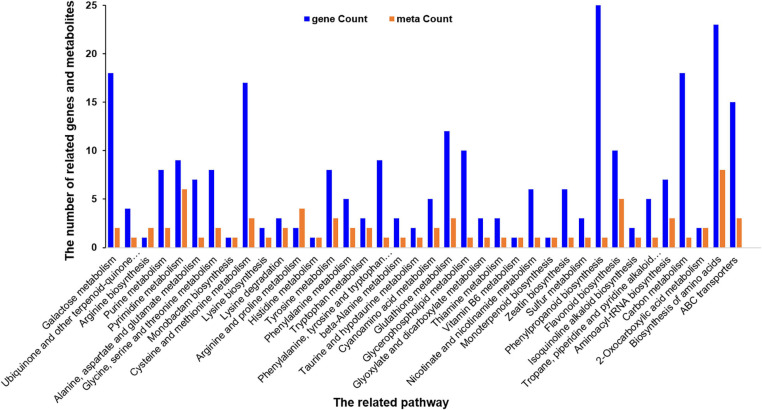
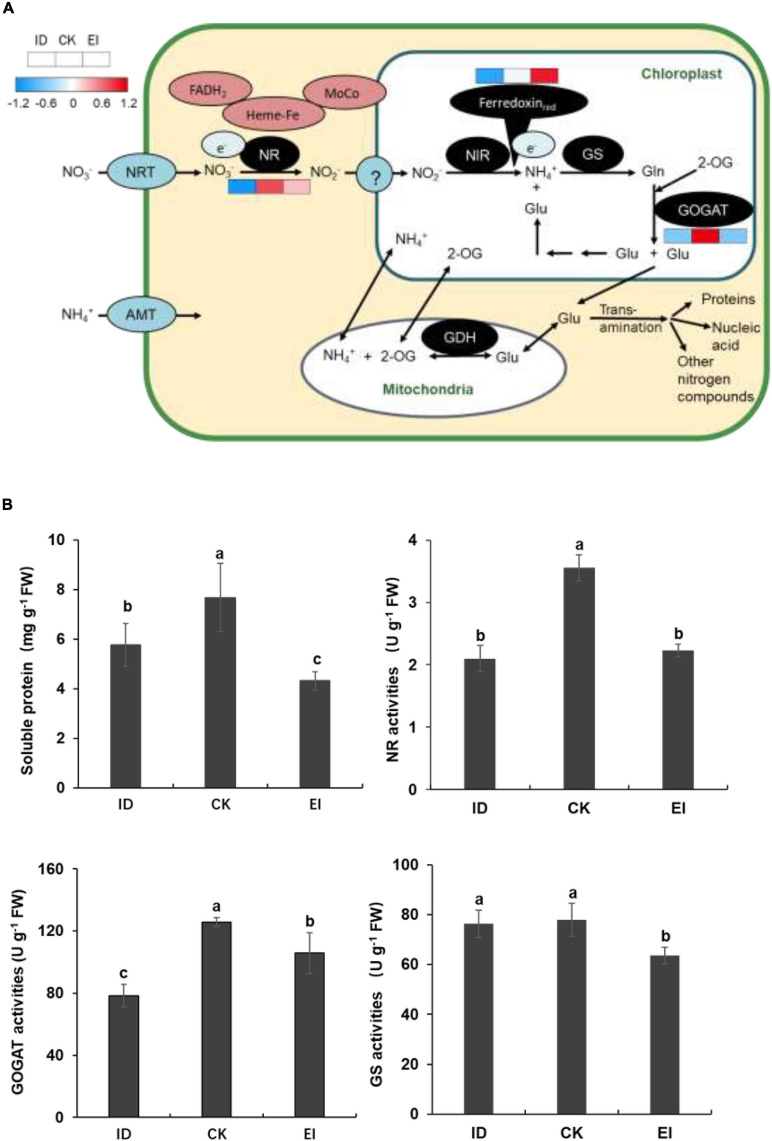
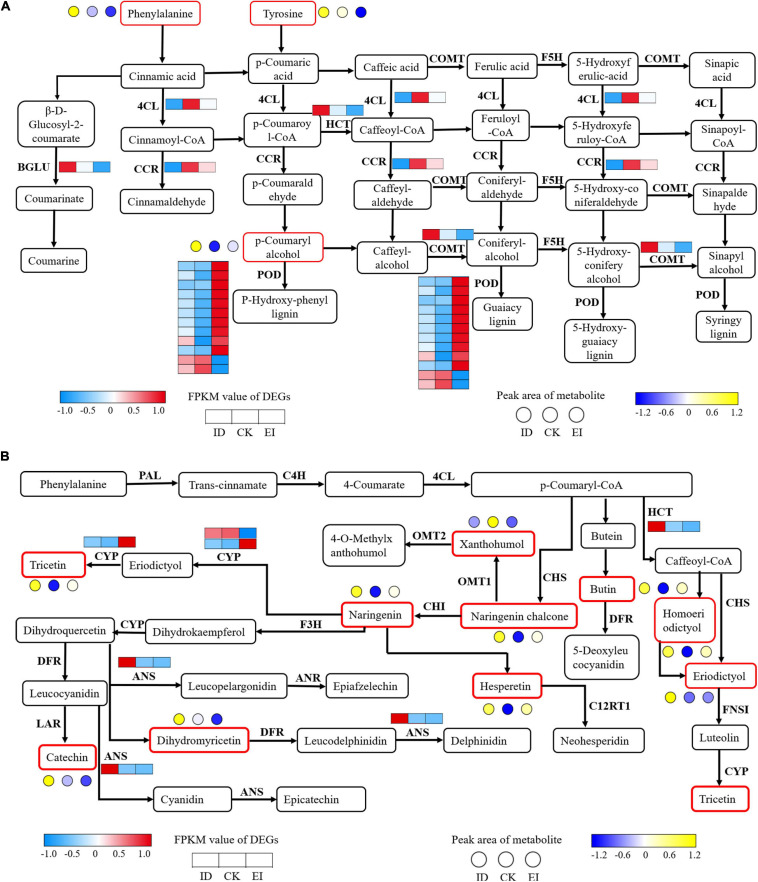
Deficiency of certain elements can cause leaf chlorosis in Areca catechu L. trees, which causes considerable production loss. The linkage between nutrient deficiency and chlorosis phenomenon and physiological defect in A. catechu remains unclear. Here, we found that low iron supply is a determinant for chlorosis of A. catechu seedling, and excessive iron supply resulted in dark green leaves. We also observed morphological characters of A. catechu seedlings under different iron levels and compared their fresh weight, chlorophyll contents, chloroplast structures and photosynthetic activities. Results showed that iron deficiency directly caused chloroplast degeneration and reduced chlorophyll synthesis in chlorosis leaves, while excessive iron treatment can increase chlorophyll contents, chloroplasts sizes, and inflated starch granules. However, both excessive and deficient of iron decreases fresh weight and photosynthetic rate in A. catechu seedlings. Therefore, we applied transcriptomic and metabolomic approaches to understand the effect of different iron supply to A. catechu seedlings. The genes involved in nitrogen assimilation pathway, such as NR (nitrate reductase) and GOGAT (glutamate synthase), were significantly down-regulated under both iron deficiency and excessive iron. Moreover, the accumulation of organic acids and flavonoids indicated a potential way for A. catechu to endure iron deficiency. On the other hand, the up-regulation of POD-related genes was assumed to be a defense strategy against the excessive iron toxicity. Our data demonstrated that A. catechu is an iron-sensitive species, therefore the precise control of iron level is believed to be the key point for A. catechu cultivation.

Keywords: Areca catechu L.; chloroplast; chlorosis; iron; nitrogen metabolism.


Conflict of interest statement

The authors declare that the research was conducted in the absence of any commercial or financial relationships that could be construed as a potential conflict of interest.

Figures

FIGURE 1
FIGURE 1
Morphological characteristics (A) and pigment content (B) of A. catechu seedlings grown under ID (0.5 μM Fe-EDTA), CK (50 μM Fe-EDTA), and EI (150 μM Fe-EDTA). ID, iron-deficiency treatment; CK, normal conditions; EI, excessive-iron treatment. Chla, chlorophyll a; Chlb, chlorophyll b; Car, carotenoid; Chl, chlorophyll a + chlorophyll b; red dashed circles represent the sampling areas. The small bars show standard deviation. Different letters represent significant differences at P < 0.05 according to Duncan’s multiple range tests.
FIGURE 2
FIGURE 2
Chloroplast structures in ID, CK and EI leaves of A. catechu. (A,B) chloroplasts in ID leaf cells; (C,D) chloroplasts in CK leaf cells; (E,F) chloroplasts in EI leaf cells; CW, Cell wall; CP, Chloroplast; ChM, Chloroplast membrane; OG, Osmiophilic granule; SG, Starch grains.
FIGURE 3
FIGURE 3
Fresh weight, photosynthetic efficiency and carbon hydrate in ID, CK and EI leaves. The small bars show standard deviation. Different letters represent significant differences at P < 0.05 according to Duncan’s multiple range tests.
FIGURE 4
FIGURE 4
Summary of GO (gene ontology) categories of DEGs. The numerals beside the histogram indicate the number of DEGs.
FIGURE 5
FIGURE 5
K-means clustering analysis of the DEGs into six clusters according to their expression profiles. The cluster names and the number of unigenes for each cluster are indicated.
FIGURE 6
FIGURE 6
Analysis of transcription factors (TFs) and transcriptional regulators (TRs) in ID, CK and EI.
FIGURE 7
FIGURE 7
Scatter plot analysis of the DAMs in response to the ID and EI treatment in A. catechu seedlings leaves.
FIGURE 8
FIGURE 8
Histogram of the differentially expressed related genes and metabolites in response to ID in A. catechu seedlings leaves.
FIGURE 9
FIGURE 9
Nitrogen assimilation pathway and activities of key enzymes related with N metabolism in ID, CK, and EI leaves. (A) Pathway viewer of main N metabolism in A. catechu leaf. Heat maps were drawn using log2-transformed FPKM values. (B) Comparison of soluble protein, Nitrate reductase (NR), glutamate synthase (GOGAT), and glutamine synthetase (GS). The small bars show standard deviation. Different letters represent significant differences at P < 0.05 according to Duncan’s multiple range tests.
FIGURE 10
FIGURE 10
Transcriptomic and metabolomic variation related to phenylpropanoid (A) and flavonoid (B) metabolism. 4CL, 4-coumarate CoA ligase; BGLU, beta-glucosidase; CCR, cinnamoyl-CoA reductase; COMT, caffeic acid 3-O-methyltransferase; F5H, flavanone 5-hydroxylase; PAL, phenylalanine ammonia-lyase; C4H, cinnamic acid 4-hydroxylase; CHS, chalcone synthase; CHI, chalcone isomerase; F3H, flavanone 3-hydroxylase; DFR, dihydroflavonol 4-reductase; ANS, anthocyanidin synthase; FLS, flavonol synthesis; ANR, anthocyanin reductase.

References

    1. Arnon D. I. (1949). Copper enzymes in isolated chloroplasts. Polyphenoloxidase in beta vulgaris. Plant Physiol. 24 1–15. 10.1104/pp.24.1.1 - DOI - PMC - PubMed
    1. Blum U., Staman K. L., Flint L. J., Shafer S. R. (2000). Induction and/or selection of phenolic acid-utilizing bulk-soil and rhizosphere bacteria and their influence on phenolic acid phytotoxicity. J. Chem. Ecol. 26 2059–2078. 10.1023/A:1005560214222 - DOI
    1. Borlotti A., Vigani G., Zocchi G. (2012). Iron deficiency affects nitrogen metabolism in cucumber (Cucumis sativus L.) plants. BMC Plant Biol. 12:189. 10.1186/1471-2229-12-189 - DOI - PMC - PubMed
    1. Brumbarova T., Bauer P., Ivanov R. (2014). Molecular mechanisms governing Arabidopsis iron uptake. Trends Plant Sci. 20 124–133. 10.1016/j.tplants.2014.11.004 - DOI - PubMed
    1. Campbell W. H. (1999). Nitrate reductase structure, function and regulation: bridging the gap between biochemistry and physiology. Ann. Rev. Plant Physiol. Plant Mol. Biol. 50 277–277. 10.1146/annurev.arplant.50.1.277 - DOI - PubMed

LinkOut - more resources