

Magnetic resonance imaging for non-invasive clinical evaluation of normal and regenerated cartilage
- PMID: 34408910
- PMCID: PMC8369076
- DOI: 10.1093/rb/rbab038
Magnetic resonance imaging for non-invasive clinical evaluation of normal and regenerated cartilage
Abstract
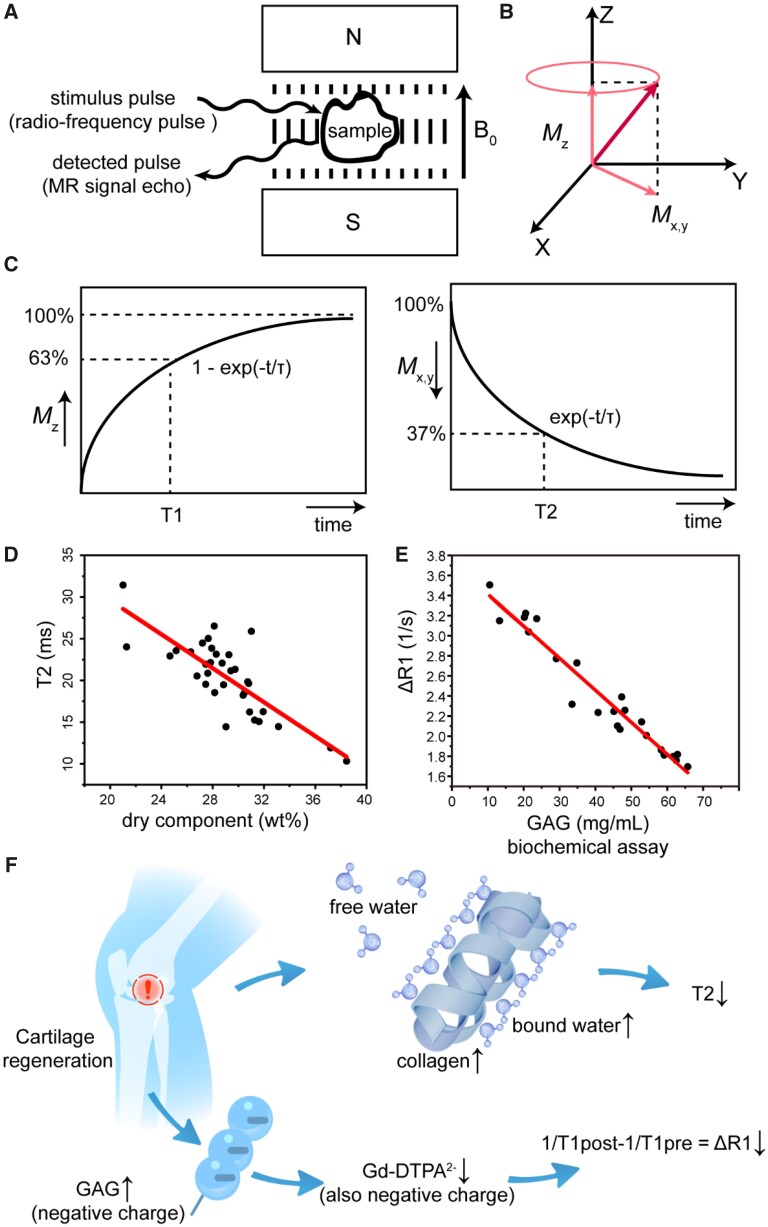
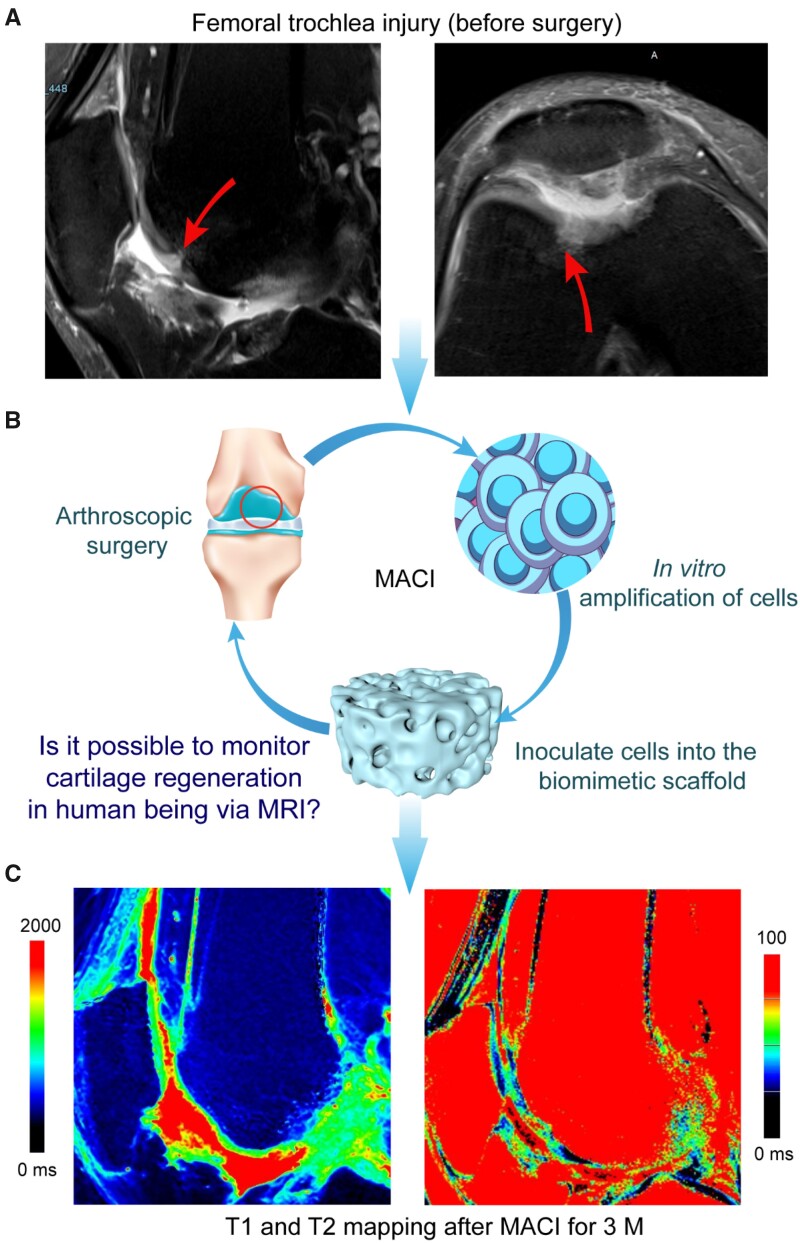
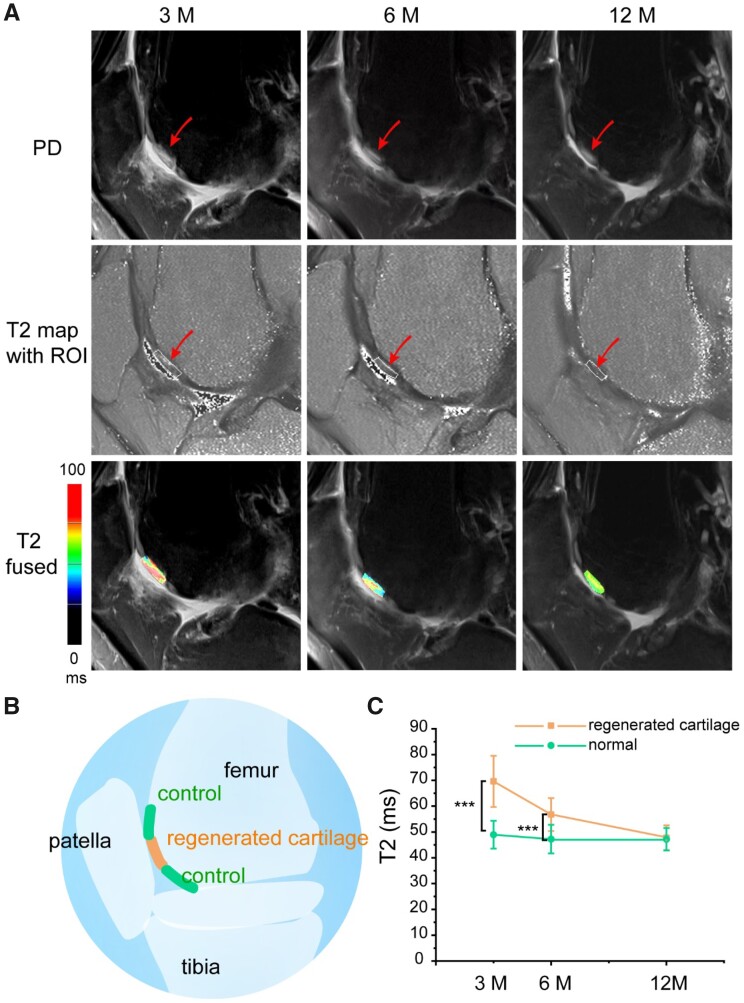
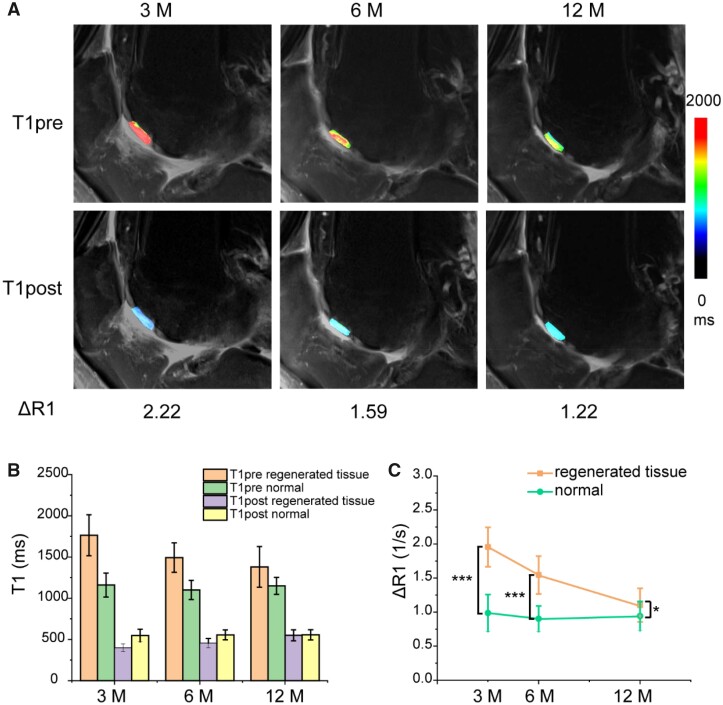
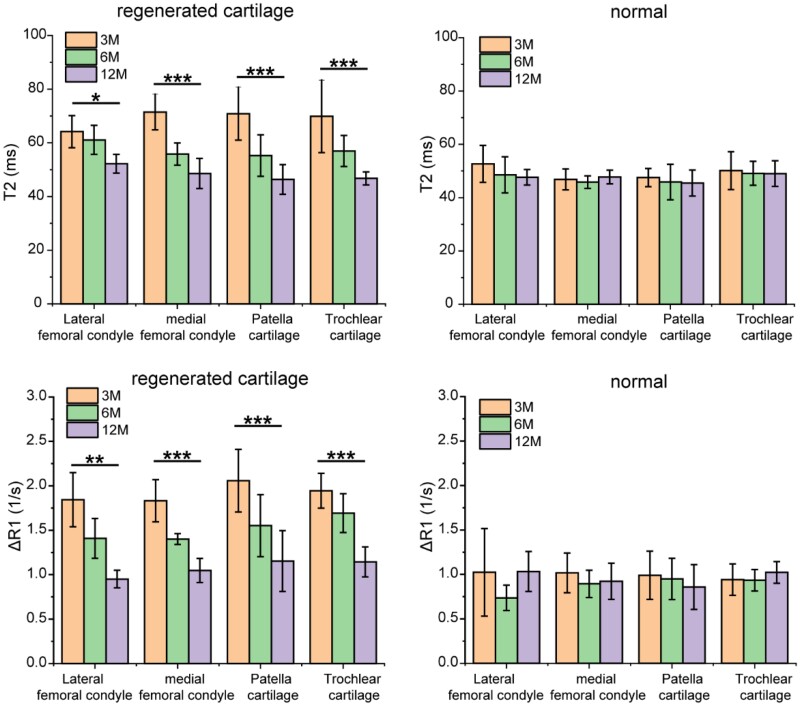
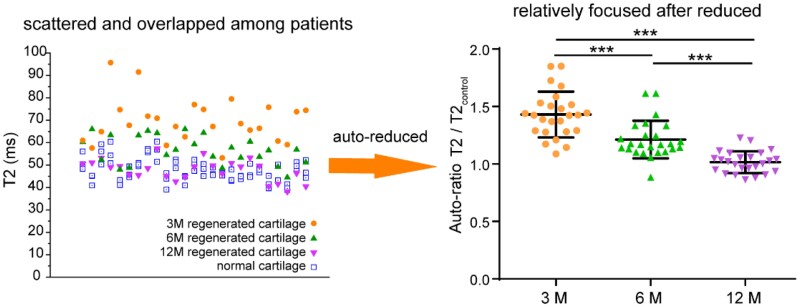
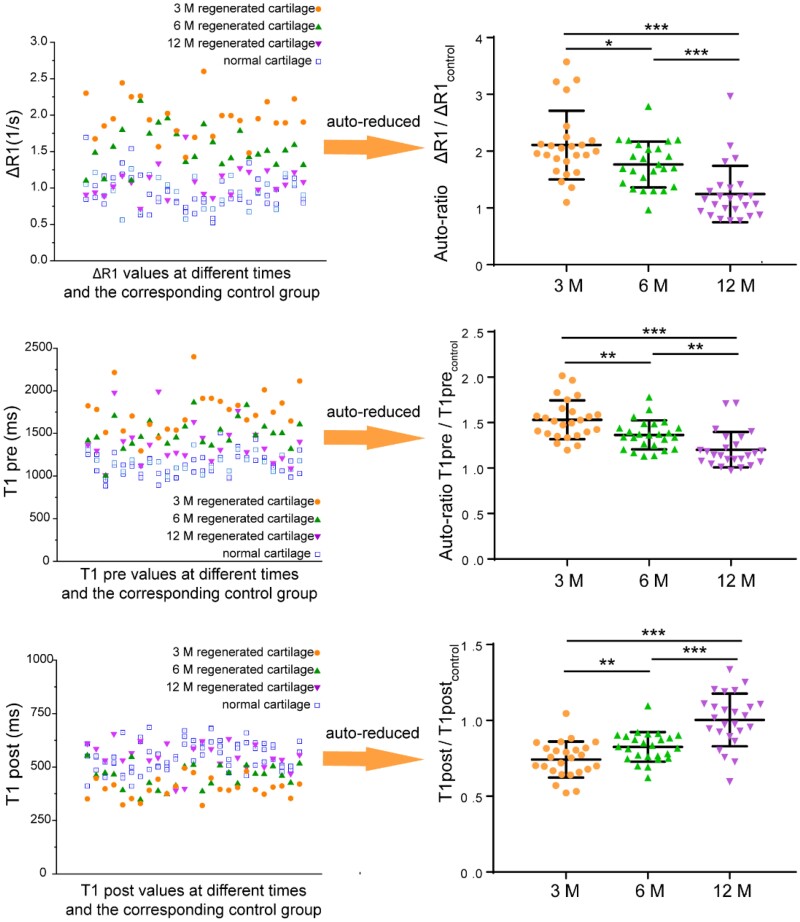
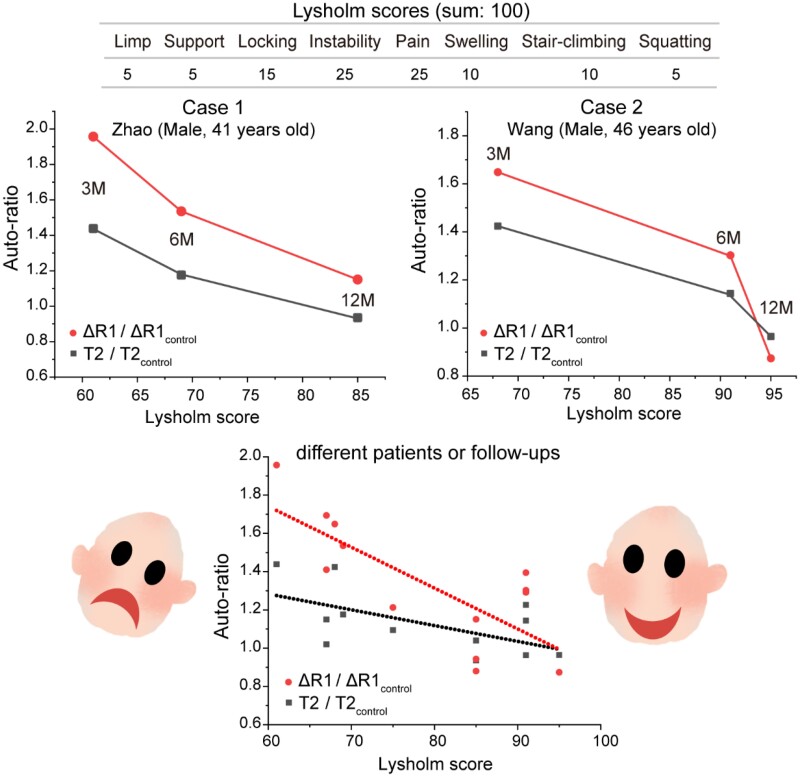
With the development of tissue engineering and regenerative medicine, it is much desired to establish bioimaging techniques to monitor the real-time regeneration efficacy in vivo in a non-invasive way. Herein, we tried magnetic resonance imaging (MRI) to evaluate knee cartilage regeneration after implanting a biomaterial scaffold seeded with chondrocytes, namely, matrix-induced autologous chondrocyte implantation (MACI). After summary of the T2 mapping and the T1-related delayed gadolinium-enhanced MRI imaging of cartilage (dGEMRIC) in vitro and in vivo in the literature, these two MRI techniques were tried clinically. In this study, 18 patients were followed up for 1 year. It was found that there was a significant difference between the regeneration site and the neighboring normal site (control), and the difference gradually diminished with regeneration time up to 1 year according to both the quantitative T1 and T2 MRI methods. We further established the correlation between the quantitative evaluation of MRI and the clinical Lysholm scores for the first time. Hence, the MRI technique was confirmed to be a feasible semi-quantitative yet non-invasive way to evaluate the in vivo regeneration of knee articular cartilage.
Keywords: T2 mapping; cartilage regeneration; delayed gadolinium-enhanced MRI imaging; magnetic resonance imaging; tissue engineering.
© The Author(s) 2021. Published by Oxford University Press.
Figures
Similar articles
-
Prospective Long-term Follow-up of Autologous Chondrocyte Implantation With Periosteum Versus Matrix-Associated Autologous Chondrocyte Implantation: A Randomized Clinical Trial.Am J Sports Med. 2020 Jul;48(9):2230-2241. doi: 10.1177/0363546520928337. Am J Sports Med. 2020. PMID: 32667270 Clinical Trial.
-
In vivo biochemical 7.0 Tesla magnetic resonance: preliminary results of dGEMRIC, zonal T2, and T2* mapping of articular cartilage.Invest Radiol. 2008 Sep;43(9):619-26. doi: 10.1097/RLI.0b013e31817e9122. Invest Radiol. 2008. PMID: 18708855
-
Delayed gadolinium-enhanced MRI of cartilage and T2 mapping for evaluation of reparative cartilage-like tissue after autologous chondrocyte implantation associated with Atelocollagen-based scaffold in the knee.Skeletal Radiol. 2016 Oct;45(10):1357-63. doi: 10.1007/s00256-016-2438-z. Epub 2016 Aug 2. Skeletal Radiol. 2016. PMID: 27484703
-
Relationship Between Quantitative MRI Biomarkers and Patient-Reported Outcome Measures After Cartilage Repair Surgery: A Systematic Review.Orthop J Sports Med. 2018 Apr 10;6(4):2325967118765448. doi: 10.1177/2325967118765448. eCollection 2018 Apr. Orthop J Sports Med. 2018. PMID: 29662912 Free PMC article. Review.
-
Advances in autologous chondrocyte implantation and related techniques for cartilage repair.Dan Med J. 2013 Apr;60(4):B4600. Dan Med J. 2013. PMID: 23651721 Review.
Cited by
-
Research and clinical translation of trilayer stent-graft of expanded polytetrafluoroethylene for interventional treatment of aortic dissection.Regen Biomater. 2022 Jul 22;9:rbac049. doi: 10.1093/rb/rbac049. eCollection 2022. Regen Biomater. 2022. PMID: 35958517 Free PMC article.
-
Establishment of coverage-mass equation to quantify the corrosion inhomogeneity and examination of medium effects on iron corrosion.Regen Biomater. 2023 Feb 1;10:rbad007. doi: 10.1093/rb/rbad007. eCollection 2023. Regen Biomater. 2023. PMID: 36817974 Free PMC article.
-
Integration of PEG-conjugated gadolinium complex and superparamagnetic iron oxide nanoparticles as T 1-T 2 dual-mode magnetic resonance imaging probes.Regen Biomater. 2021 Nov 12;8(6):rbab064. doi: 10.1093/rb/rbab064. eCollection 2021 Dec. Regen Biomater. 2021. PMID: 34881046 Free PMC article.
-
Effects of serum proteins on corrosion rates and product bioabsorbability of biodegradable metals.Regen Biomater. 2023 Dec 12;11:rbad112. doi: 10.1093/rb/rbad112. eCollection 2024. Regen Biomater. 2023. PMID: 38173765 Free PMC article.
-
Nanomaterials based on hollow gold nanospheres for cancer therapy.Regen Biomater. 2024 Oct 24;11:rbae126. doi: 10.1093/rb/rbae126. eCollection 2024. Regen Biomater. 2024. PMID: 39664940 Free PMC article. Review.
References
-
- Weissleder R.Molecular imaging: exploring the next frontier. Radiology 1999;212:609–14. - PubMed
-
- Liu G, Xia CC, Wang ZY. et al.Magnetic resonance imaging probes for labeling of chondrocyte cells. J Mater Sci: Mater Med 2011;22:601–6. - PubMed
-
- Mannil M, Andreisek G, Weishaupt D. et al.Chronic sports injuries of the knee joint. Radiologe 2016;56:445–56. - PubMed
-
- Lusse S, Claassen H, Gehrke T. et al.Evaluation of water content by spatially resolved transverse relaxation times of human articular cartilage. Magn Reson Imaging 2000;18:423–30. - PubMed
LinkOut - more resources
Full Text Sources
