. 2021 Aug 10;10(1):1962591.
doi: 10.1080/2162402X.2021.1962591. eCollection 2021.

IFN-γ-induced ER stress impairs autophagy and triggers apoptosis in lung cancer cells

Affiliations

IFN-γ-induced ER stress impairs autophagy and triggers apoptosis in lung cancer cells

Can Fang et al. Oncoimmunology. .

Abstract

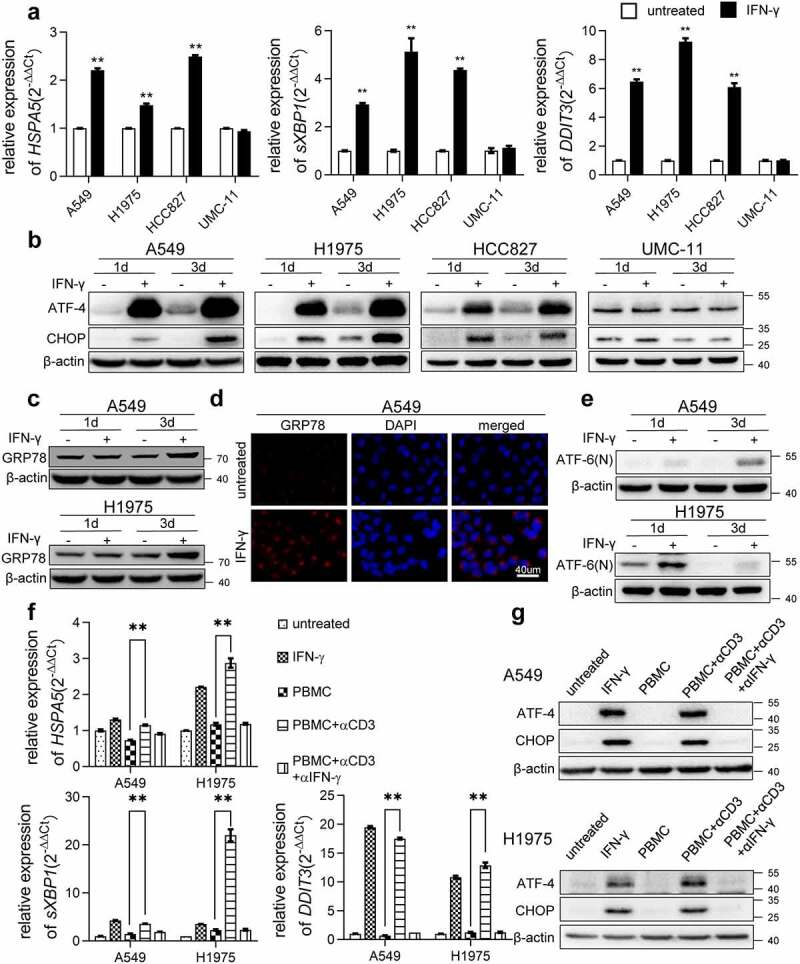
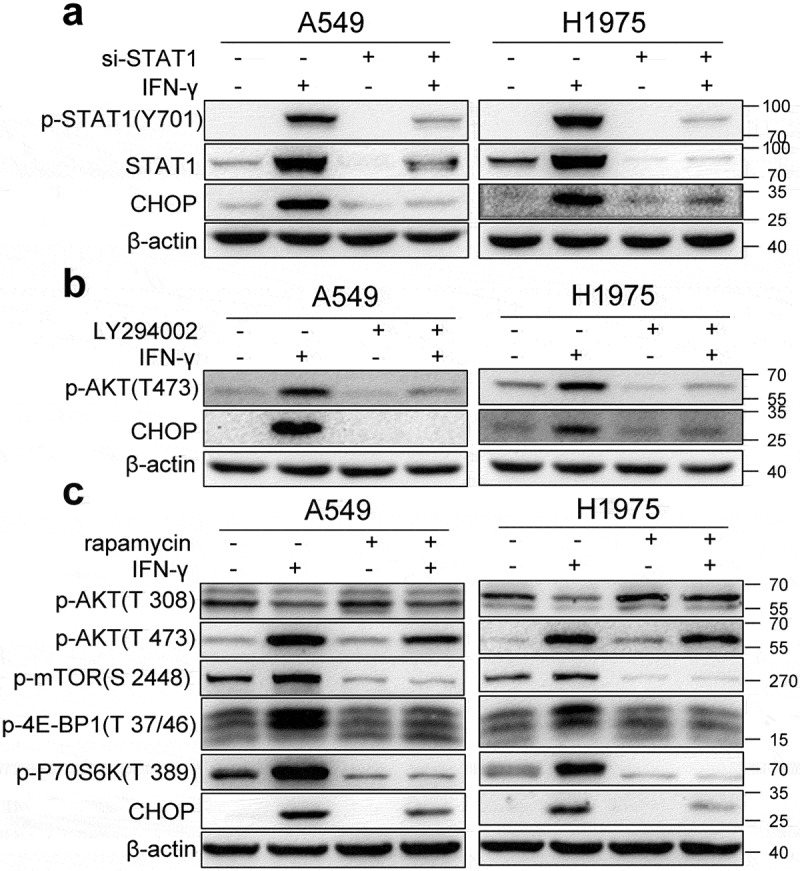
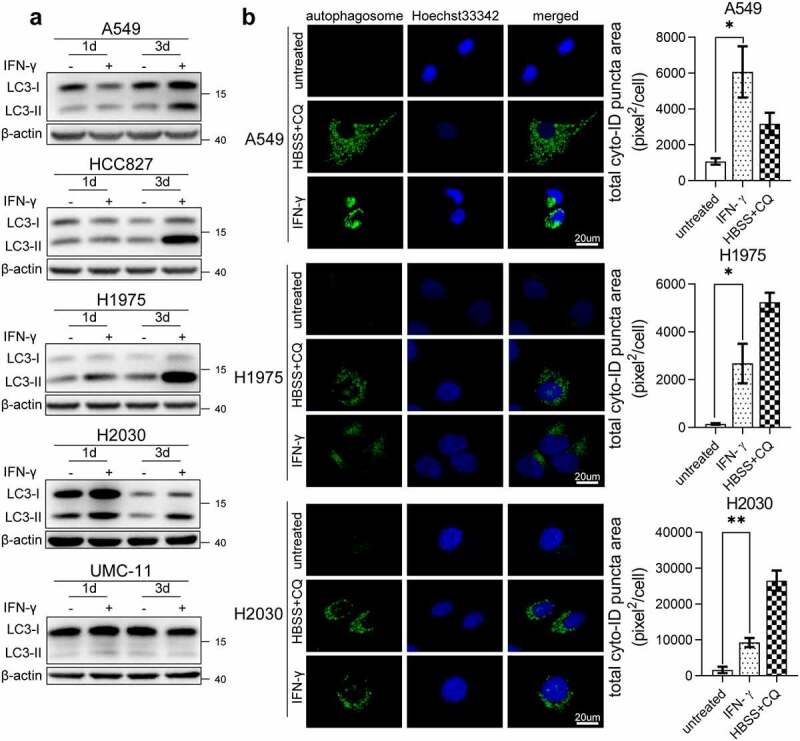
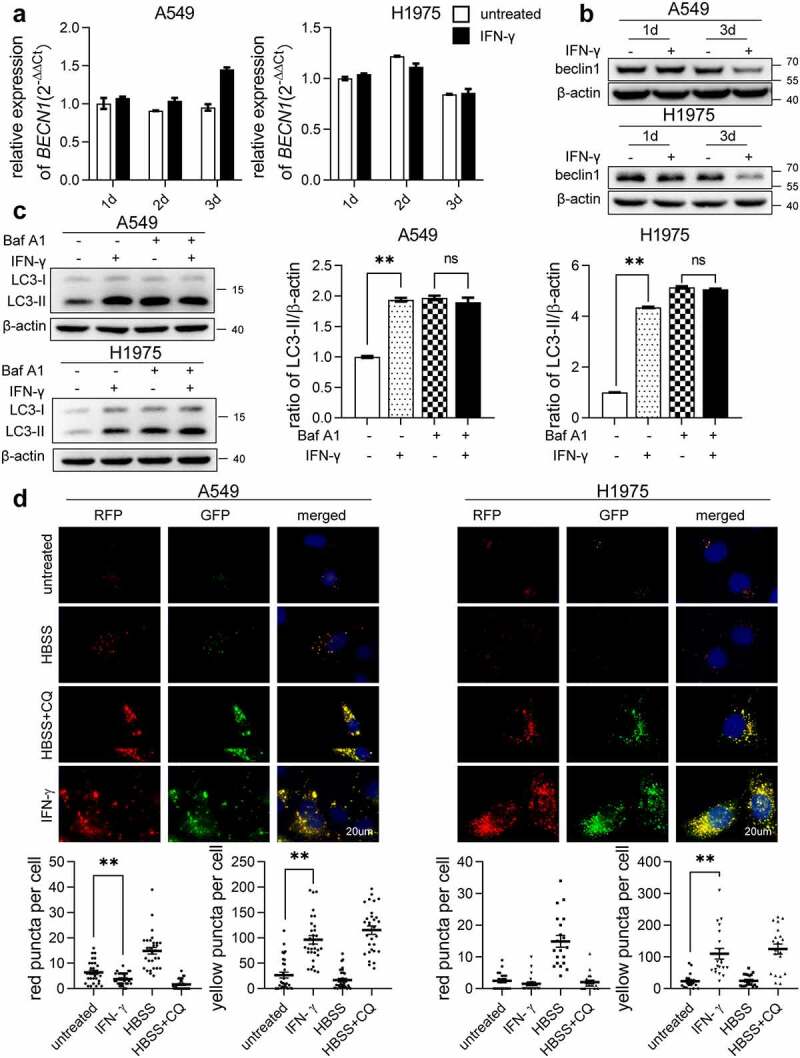
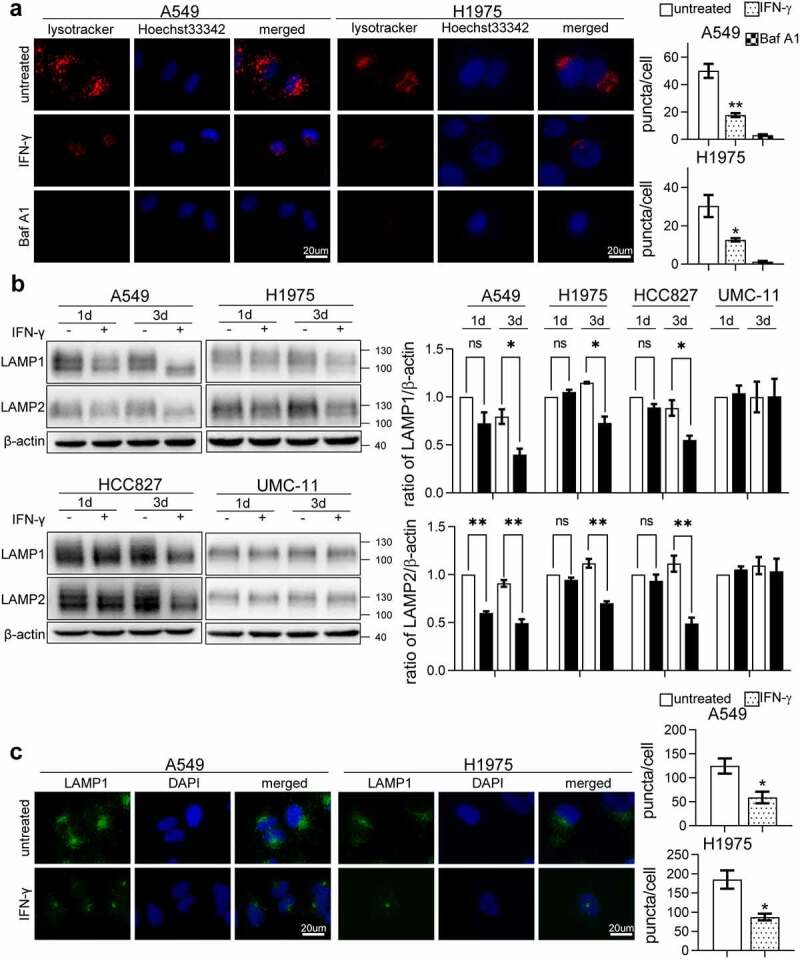
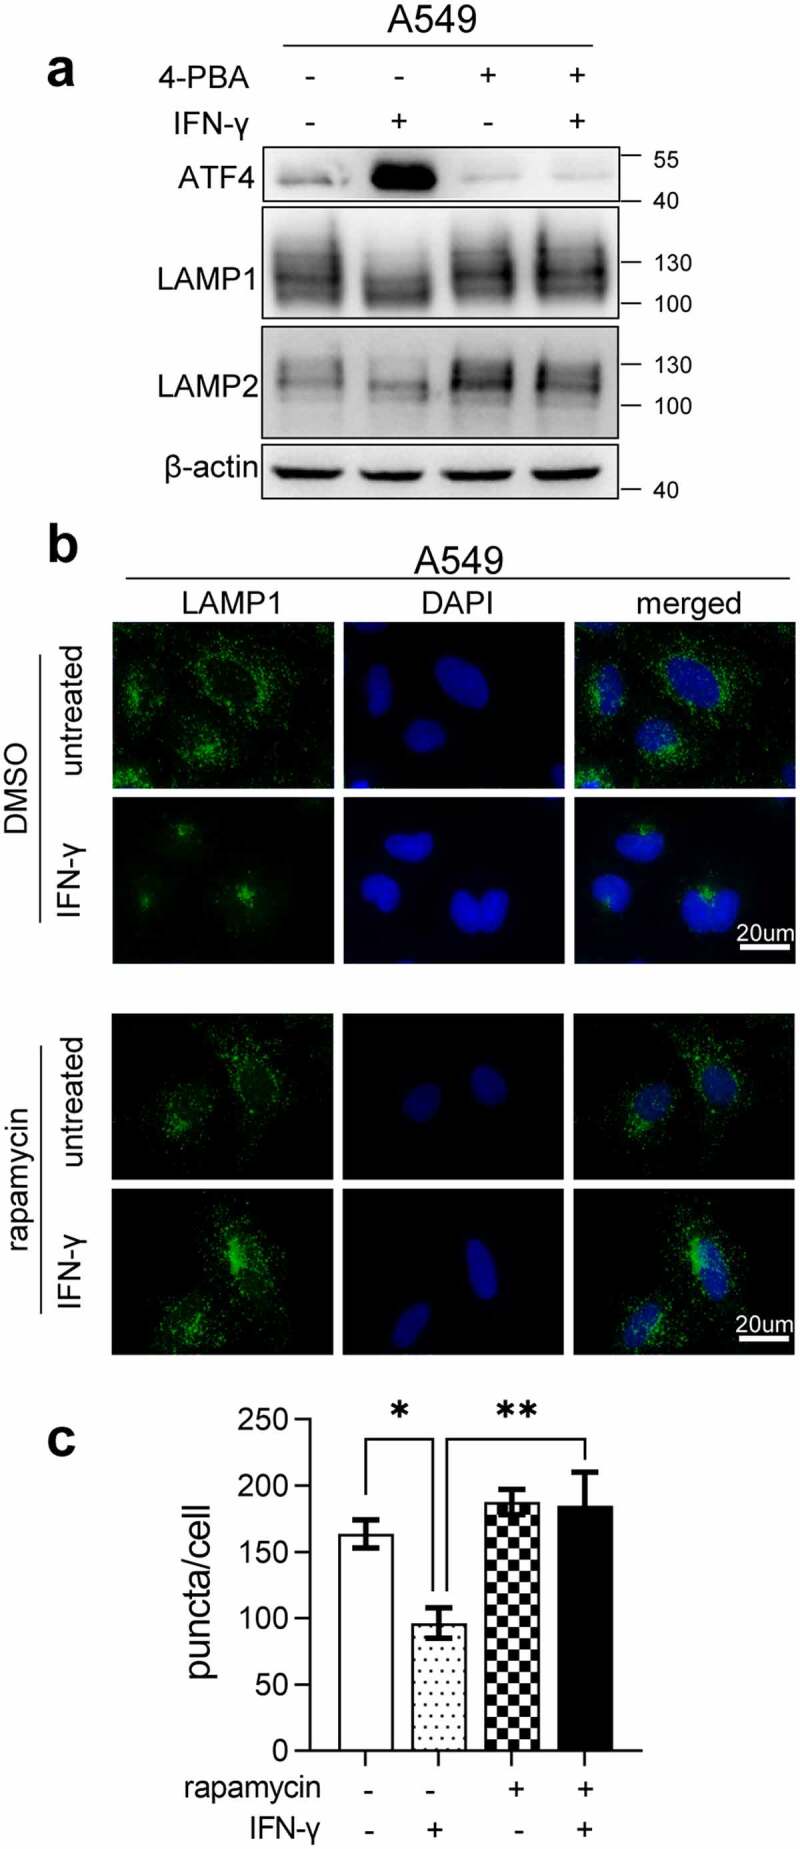
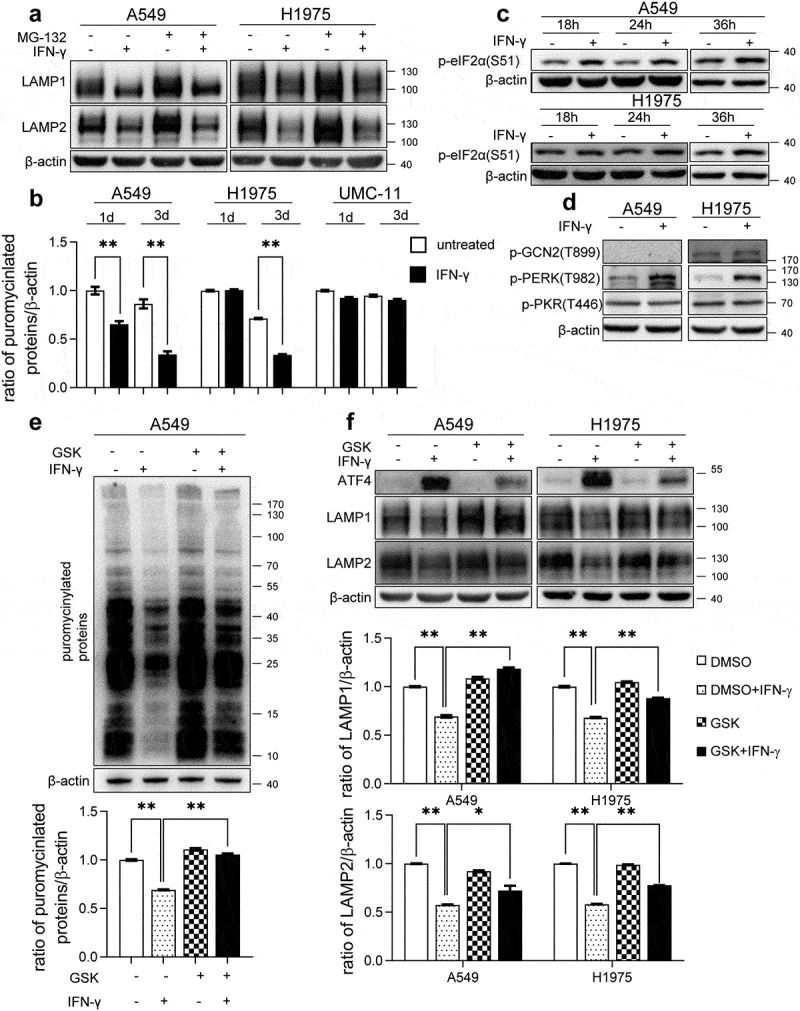
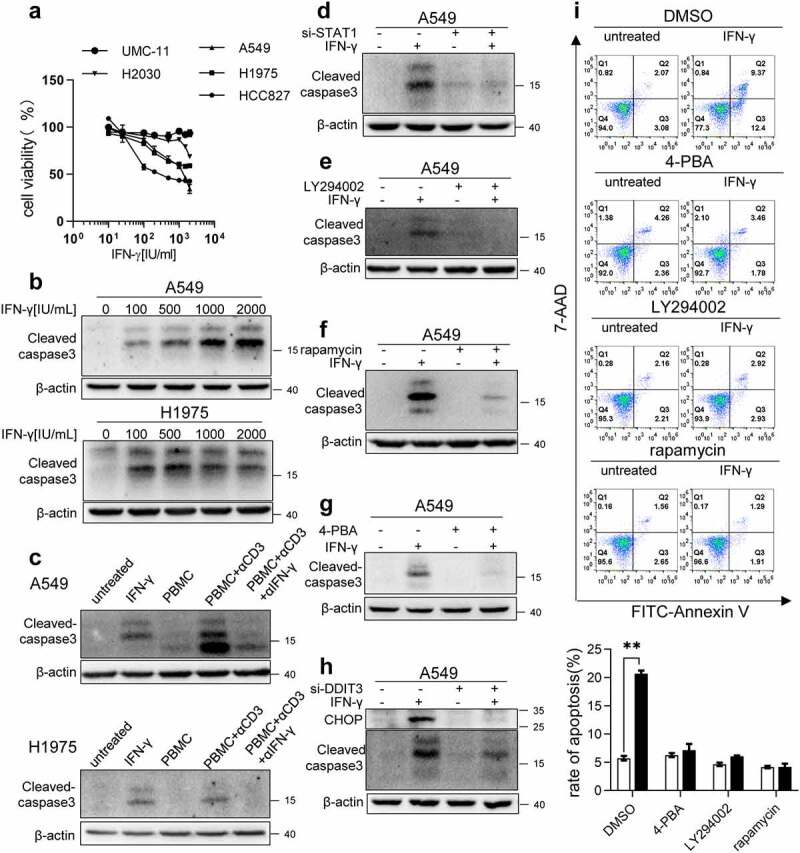
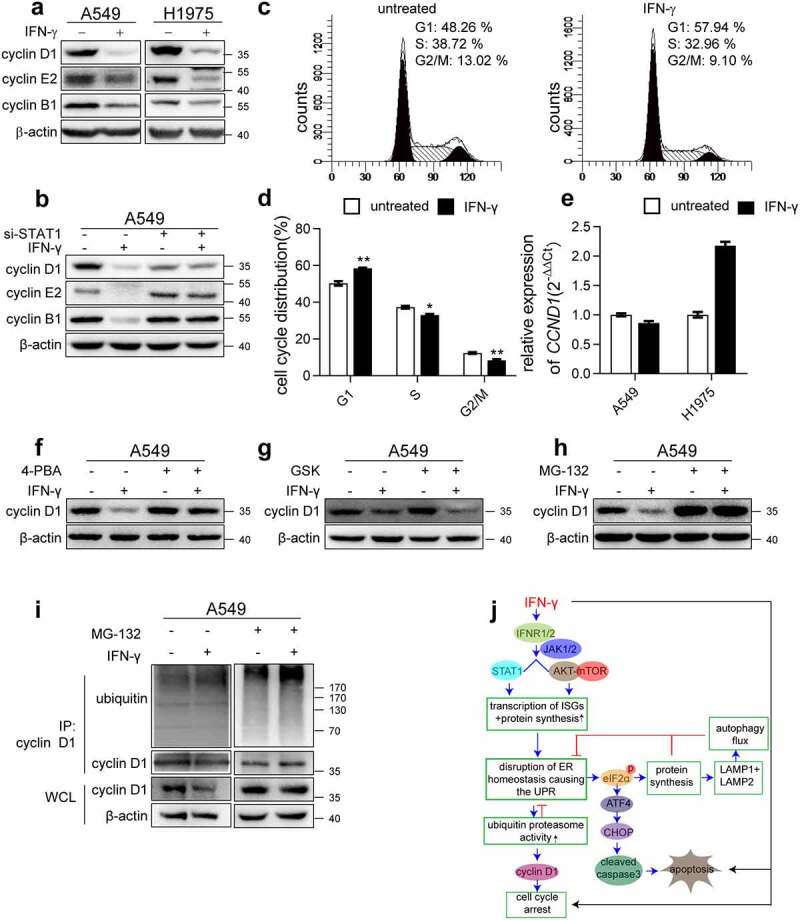
Interferon-gamma (IFN-γ) is a major effector molecule of immunity and a common feature of tumors responding to immunotherapy. Active IFN-γ signaling can directly trigger apoptosis and cell cycle arrest in human cancer cells. However, the mechanisms underlying these actions remain unclear. Here, we report that IFN-γ rapidly increases protein synthesis and causes the unfolded protein response (UPR), as evidenced by the increased expression of glucose-regulated protein 78, activating transcription factor-4, and c/EBP homologous protein (CHOP) in cells treated with IFN-γ. The JAK1/2-STAT1 and AKT-mTOR signaling pathways are required for IFN-γ-induced UPR. Endoplasmic reticulum (ER) stress promotes autophagy and restores homeostasis. Surprisingly, in IFN-γ-treated cells, autophagy was impaired at the step of autophagosome-lysosomal fusion and caused by a significant decline in the expression of lysosomal membrane protein-1 and -2 (LAMP-1/LAMP-2). The ER stress inhibitor 4-PBA restored LAMP expression in IFN-γ-treated cells. IFN-γ stimulation activated the protein kinase-like ER kinase (PERK)-eukaryotic initiation factor 2a subunit (eIF2α) axis and caused a reduction in global protein synthesis. The PERK inhibitor, GSK2606414, partially restored global protein synthesis and LAMP expression in cells treated with IFN-γ. We further investigated the functional consequences of IFN-γ-induced ER stress. We show that inhibition of ER stress significantly prevents IFN-γ-triggered apoptosis. CHOP knockdown abrogated IFN-γ-mediated apoptosis. Inhibition of ER stress also restored cyclin D1 expression in IFN-γ-treated cells. Thus, ER stress and the UPR caused by IFN-γ represent novel mechanisms underlying IFN-γ-mediated anticancer effects. This study expands our understanding of IFN-γ-mediated signaling and its cellular actions in tumor cells.

Keywords: ER stress; IFN-γ; LAMP; apoptosis; autophagy; lung adenocarcinoma.


Conflict of interest statement

The authors declare no competing interests.

Figures

Figure 1.
Figure 1.
IFN-γ induces UPR in lung adenocarcinoma. (a) The indicated cells were treated with IFN-γ (1000 IU/mL) or untreated for 2 days. qRT-PCR was used to detect the expression of selected genes involved in ER stress. The expression of each gene of interest was corrected for ACTB expression. **, p < .01. (b) Immunoblots showing ATF-4 and CHOP protein expression in IFN-γ treated and untreated cells. β-actin was used as a loading control. (c) Western blot analysis showing increased expression of GRP78 in IFN-γ treated cells vs. untreated cells. (d) Immunofluorescence images of GRP78 in A549 cells treated with IFN-γ or untreated for 3 days (scale bar = 40 µm). (e) Western blot analysis for ATF-6(n) in IFN-γ treated A549 and H1975 cells vs. untreated cells. (f and g) Peripheral blood mononuclear cells (PBMCs) were stimulated with anti-CD3 monoclonal antibody (mAb) in the presence or absence of anti-IFN-γ antibody for 48 h. Subsequently, the supernatants were collected and cultured with A549 and H1975 cells for 2 days. qRT-PCR was used to assess the transcription of HSPA5, sXBP1, and DDIT3 (f). Western blot analysis was used to detect the expression of ATF-4 and CHOP (g)
Figure 2.
Figure 2.
IFN-γ-mediated JAK1/2-STAT1 and PI3K-AKT-mTOR signaling pathways are required for the induction of the UPR. (a) A549 and H1975 cells were transfected with control siRNA or si-STAT1 for 24 h and then treated with IFN-γ (1000 IU/mL) for 3 days. The expression of STAT1 and CHOP was determined using western blotting. (b) A549 and H1975 cells were pretreated with 10 µM of LY294002 for 1 h and then treated with IFN-γ (1000 IU/mL) for 36 h. The expression levels of phosphorylated AKT and CHOP was determined using western blotting. (c) A549 and H1975 cells were pretreated with 500 nM of rapamycin for 1 h and then treated with IFN-γ (1000 IU/mL) for 36 h. Western blot analyses were used to determine the expression of p-AKT, p-mTOR, p-4E-BP1, p-70S6K, and CHOP
Figure 3.
Figure 3.
Accumulation of autophagosomes in IFN-γ-treated cells. (a) Immunoblots showing LC3 protein expression in IFN-γ treated and untreated cells. (b) The indicated cells were treated with IFN-γ (1000 IU/mL) or untreated for 3 days. At the end of the treatment, the cells were labeled with CYTO-ID® green detection reagent to detect autophagosomes. Cells treated with HBSS in the presence of CQ (60 µM) for 3 h were used as a positive control for the accumulation of autophagosomes. Puncta areas per cell from three random images for each culture condition are shown. *, p < .05; **, p < .01
Figure 4.
Figure 4.
IFN-γ impairs autophagic flux in lung cancer cells. (a and b) The expression of Beclin 1 was assessed at the transcriptional level by qRT-PCR (a) and at the protein level by western blot analysis (b) in A549 and H1975 cells after treatment with IFN-γ (1000 IU/mL) or mock treated for the indicated duration. (c) LC3 expression was determined using western blotting. The bar graphs show a densitometric analysis of changes in the abundance of LC3-II normalized to β-actin level for loading variability. **, p <.01; ns, not significant. (d) The indicated cells were transfected with the Premo™ Autophagy Tandem Sensor RFP-GFP-LC3B and cultured under the indicated conditions. Red puncta (RFP puncta only) and yellow puncta (RFP puncta colocalized with GFP puncta) were detected using fluorescence microscopy (scale bar = 20 µm). The number of LC3 yellow puncta and red puncta per cell was calculated from at least 20 cells from each culture condition. The bar graphs represent the mean ± SEM. **, p < .01
Figure 5.
Figure 5.
LAMP-1 and LAMP-2 expression is reduced in cells treated with IFN-γ. (a) The indicated cells treated or untreated with IFN-γ were loaded with LysoTracker Red DND-99 for 30 min and analyzed using fluorescence microscope. Cells treated with Baf A1 alone were used as an experimental control. (b) Representative immunoblots showing LAMP-1 and LAMP-2 expression in IFN-γ treated and untreated cells. The bar graphs show a densitometric analysis of 3–4 individual experiments in the abundance of LAMP after normalization to β-actin for loading variability. *, p < .05; **, p < .01; ns, not significant. (c) The expression of LAMP-1 was assessed using fluorescence microscopy (scale bar = 20 µm). The number of puncta per cell was counted from three random images from each culture condition. The bar graphs represent the mean ± SEM. *, p < .05; **, p <.01
Figure 6.
Figure 6.
Inhibition of ER stress restores IFN-γ-mediated downregulation of LAMP. (a) A549 cells treated with IFN-γ or mock treated in the presence or absence of 1 mM 4-PBA for 3 days were subjected to western blot analyses of the expression of ATF-4, LAMP-1, and LAMP-2. (b and c) Immunofluorescence images of LAMP-1 in A549 cells treated with IFN-γ or mock treated in the presence or absence of rapamycin (b). Quantification of LAMP-1 puncta per cell is shown (c). *, p < .05; **, p < .01
Figure 7.
Figure 7.
IFN-γ-induced activation of PERK-eIF2α is responsible for the reduction in the expression of LAMP. (a) The indicated cells were treated with IFN-γ or mock treated for 3 days followed by culturing with 10 μM MG132 for an additional 4 h. Immunoblots showing LAMP-1 and LAMP-2 expression. (b) The indicated cells were treated with IFN-γ or mock treated. Puromycin (10 µg/mL) was added during the last 10 min of incubation. Puromycinylated proteins were detected using western blotting and the bar graphs show densitometric analysis of the changes in the abundance of puromycinylated proteins normalized to β-actin for loading variability. **, p < .01. (c) Phosphorylated eIF2α was determined using western blot analyses of A549 and H1975 cells treated with or without IFN-γ (1000 IU/mL) for the indicated time intervals. (d) A549 and H1975 cells were treated with or without IFN-γ (1000 IU/mL) for 12 h. The expression levels of phosphorylated PERK, GCN2, and PKR were determined using western blot analysis. (e) A549 cells were treated with 1000 IU/mL of IFN-γ in the presence of 500 nM GSK2606414 for 24 h. Puromycin (10 µg/mL) was added during the last 10 min of incubation. Puromycinylated proteins were detected using western blotting and the bar graphs show densitometric analysis of the changes in the abundance of puromycinylated proteins normalized to β-actin for loading variability. **, p < .01. (f) The indicated cells were treated with 1000 IU/mL of IFN-γ in the presence of 500 nM GSK2606414 for 2 days. Immunoblots showing ATF-4, LAMP-1, and LAMP-2 expression. LAMP-1 and LAMP-2 expression was normalized to β-actin level for densitometric analyses and is presented as the mean ± SEM. *, p < .05; **, p < .01
Figure 8.
Figure 8.
ER stress contributes to IFN-γ-induced apoptosis. (a) The indicated cells were treated with IFN-γ for 3 days followed by a CCK-8 assay. The untreated cells were used as controls (100%). (b) The indicated cells were treated with doses of IFN-γ (100–2000 IU/mL) for 3 days. The expression of cleaved caspase-3 was determined using western blotting. (c) PBMCs were stimulated with anti-CD3 mAb in the presence or absence of anti-IFN-γ antibody for 48 h. Subsequently, the supernatants were collected and cultured with A549 and H1975 cells for 2 days. Western blot analysis was performed to detect cleaved caspase-3. (d) A549 cells transfected with control siRNA or si-STAT1 were treated with IFN-γ (1000 IU/mL) for 3 days. Immunoblots showing cleaved caspase-3 expression. (e and f) A549 cells treated with IFN-γ in the presence or absence of LY294002 (e) or rapamycin (f) were subjected to western blotting to detect cleaved caspase-3 expression. (g) A549 cells treated with IFN-γ in the presence or absence of 4-PBA was subjected to western blot analysis to assess cleaved caspase-3 expression. (h) A549 cells transfected with control siRNA or si-DDIT3 were treated with IFN-γ for 3 days. Immunoblots showing CHOP and cleaved caspase-3 expression. (i) A549 cells were treated with IFN-γ (1000 IU/mL) for 3 days. Apoptotic cell death was evaluated using annexin V and 7-AAD staining assay followed by flow cytometry analysis. The data are presented as the means ± SEM from 3–4 individual experiments
Figure 9.
Figure 9.
ER stress is involved in IFN-γ-mediated suppression of cell cycle progression. (a) Immunoblots showing cyclin D1, cyclin E2, and cyclin B1 expression in the indicated cells treated with IFN-γ vs. mock treated for 3 days. (b) The indicated cells transfected with control siRNA or si-STAT1 were treated with IFN-γ (1000 IU/mL) for 3 days. Immunoblots showing cyclin D1, cyclin E2, and cyclin B1 expression. (c) A549 cells were treated with IFN-γ (1000 IU/mL) for 24 h, and PI staining was performed to determine cell cycle progression, and (d) the data are presented as the means ± SEM from 3–4 individual experiments. (e) The expression of CCND1 was assessed using qRT-PCR in the indicated cells after treatment with IFN-γ (1000 IU/mL) or mock-treated for 24 h. (f) Cyclin D1 expression was assessed in A549 cells treated with IFN-γ in the presence or absence of 4-PBA. (g) A549 cells were treated with IFN-γ (1000 IU/mL) for 3 days in the presence of GSK2606414. Cyclin D1 expression was determined using western blotting. (h) A549 cells were treated with IFN-γ (1000 IU/mL) for 3 days followed by culturing with MG132 (10 μM) for an additional 4 h. Cyclin D1 expression was determined using western blotting. (i) Cell lysates were immunoprecipitated with anti-cyclin D1 antibody, and ubiquitination was detected using western blotting. (j) Schematic depicting the effect of IFN-γ signaling on lung adenocarcinoma cells. IFN-γ induces ER stress and UPR in lung adenocarcinoma cells through the activation of JAK1/2-STAT1 and AKT-mTOR signaling. This UPR consequently reduced LAMP-1 and LAMP-2 expression and led to impairment of autophagic flux. We also demonstrated that IFN-γ-induced ER stress contributes to IFN-γ-triggered apoptotic cell death and cell cycle arrest

References

    1. Sharma P, Pachynski R, Narayan V.. Nivolumab plus ipilimumab for metastatic castration-resistant prostate cancer: preliminary analysis of patients in the checkMate 650 trial. Cancer Cell. 2020;38(4):489–499.e483. doi:10.1016/j.ccell.2020.08.007. - DOI - PubMed
    1. Ayers M, Lunceford J, Nebozhyn M. IFN-γ-related mRNA profile predicts clinical response to PD-1 blockade. J Clin Invest. 2017;127(8):2930–18. doi:10.1172/JCI91190. - DOI - PMC - PubMed
    1. Gao J, Shi L, Zhao H. Loss of IFN-γ pathway genes in tumor cells as a mechanism of resistance to anti-CTLA-4 therapy. Cell. 2016;167(2):397–404.e399. doi:10.1016/j.cell.2016.08.069. - DOI - PMC - PubMed
    1. Thibaut R, Bost P, Milo I. Bystander IFN-γ activity promotes widespread and sustained cytokine signaling altering the tumor microenvironment. Nature Cancer. 2020;1(3):302–314. doi:10.1038/s43018-020-0038-2. - DOI - PMC - PubMed
    1. Hoekstra M, Bornes L, Dijkgraaf F. Long-distance modulation of bystander tumor cells by CD8 T cell-secreted IFNγ. Nature Cancer. 2020;1(3):291–301. doi:10.1038/s43018-020-0036-4. - DOI - PMC - PubMed

Publication types

MeSH terms