. 2021 Aug 2:9:726656.
doi: 10.3389/fcell.2021.726656. eCollection 2021.

Identification of Claudin-6 as a Molecular Biomarker in Pan-Cancer Through Multiple Omics Integrative Analysis

Affiliations

Identification of Claudin-6 as a Molecular Biomarker in Pan-Cancer Through Multiple Omics Integrative Analysis

Chiyuan Zhang et al. Front Cell Dev Biol. .

Abstract

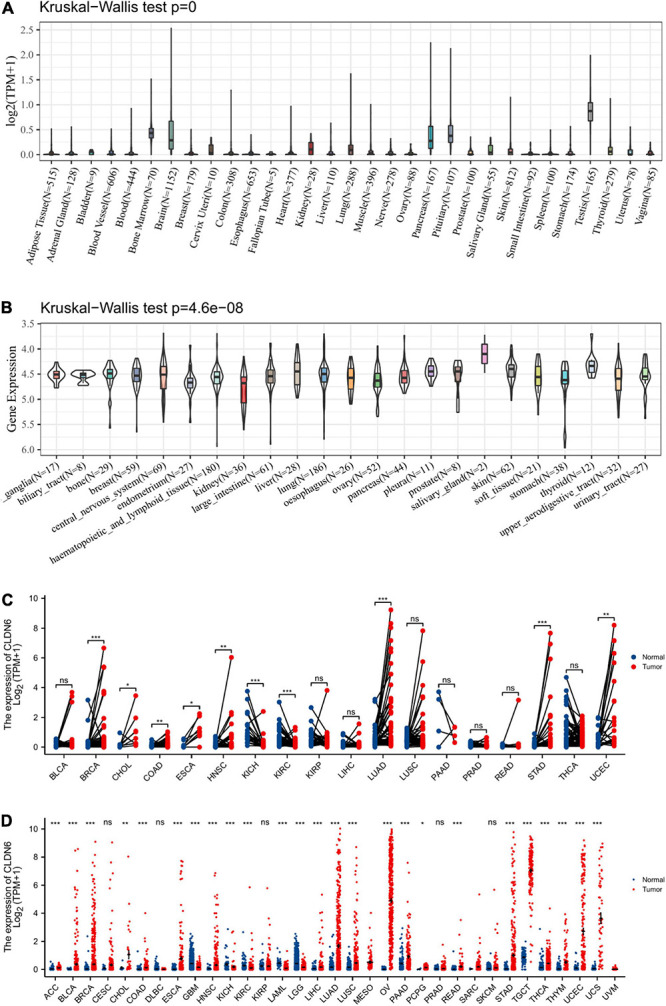
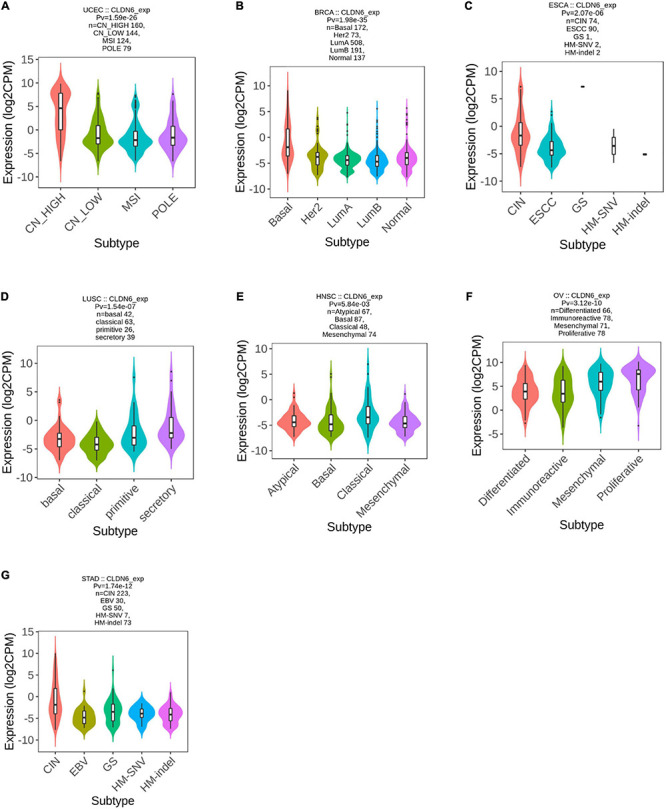
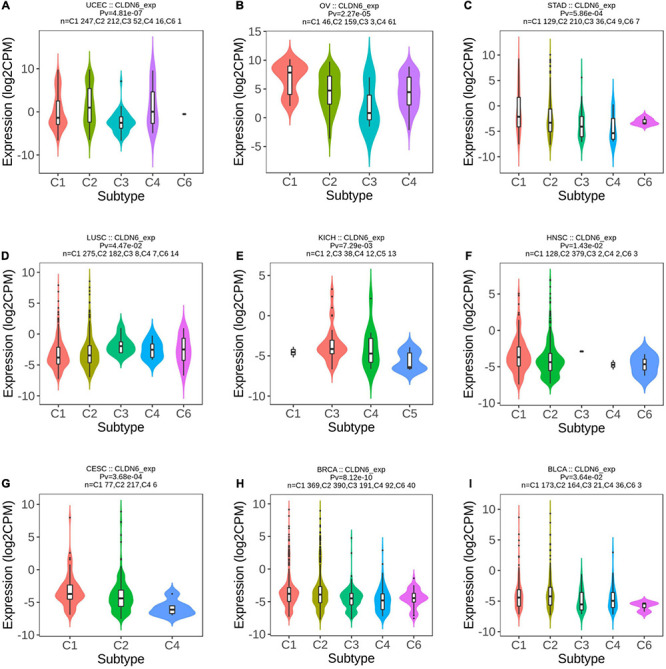
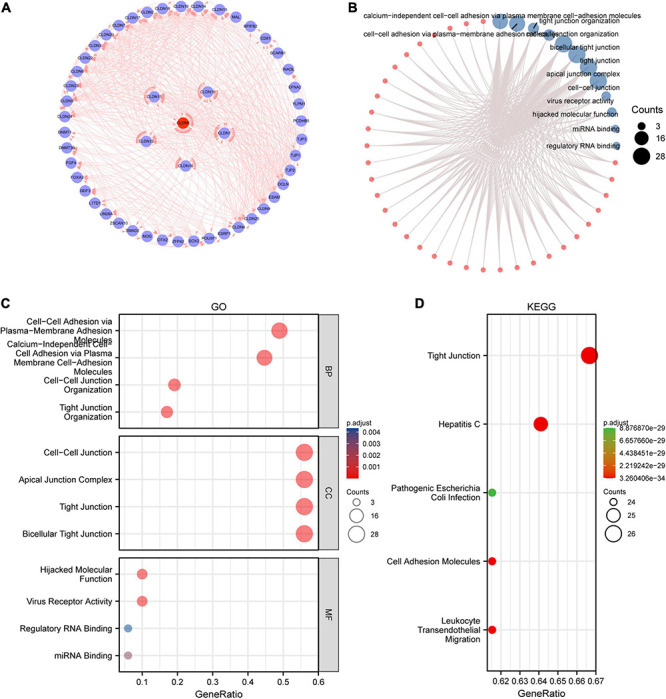
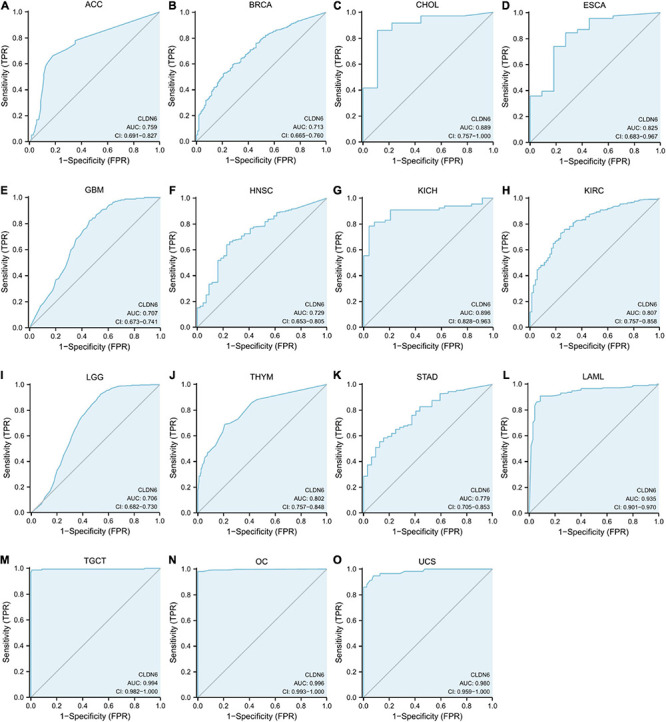
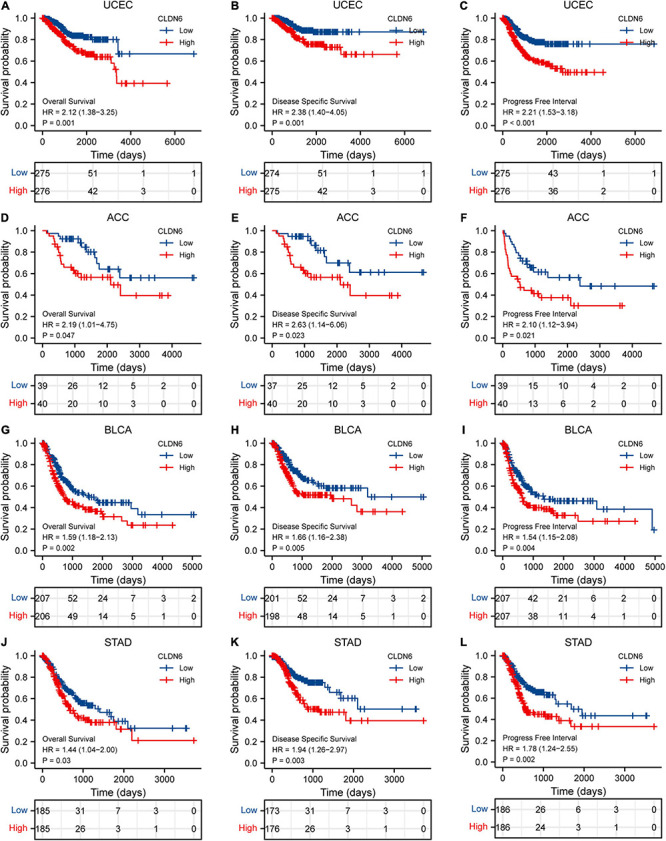
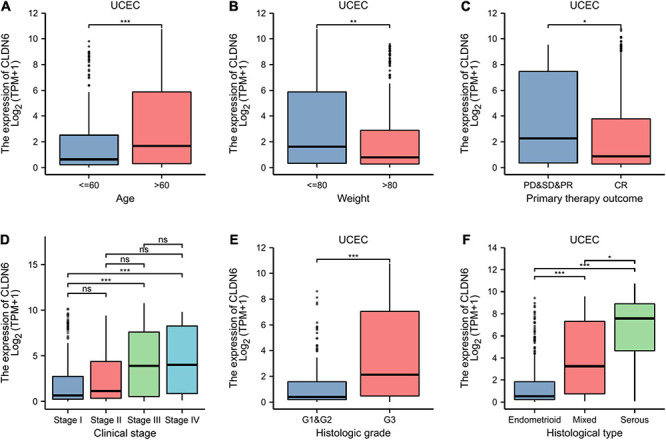
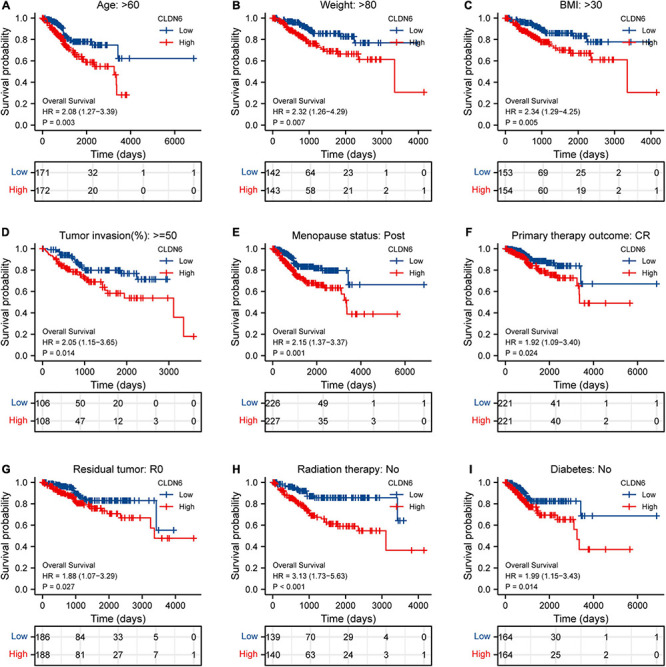
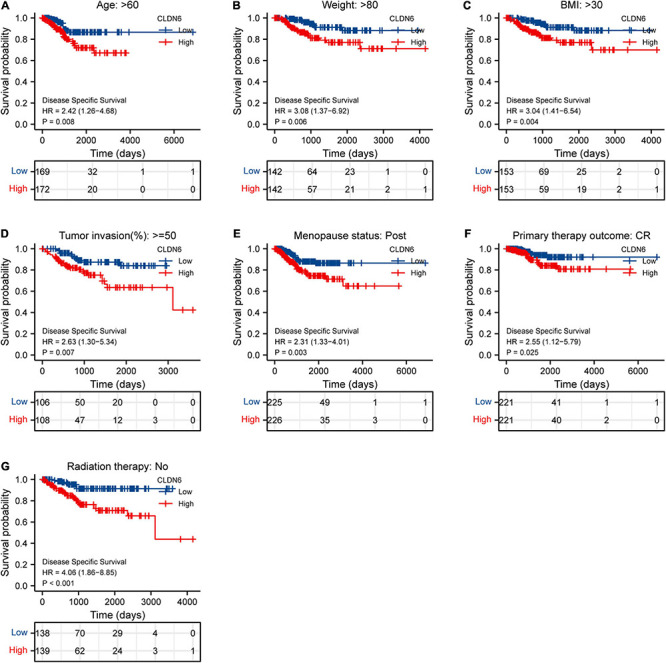
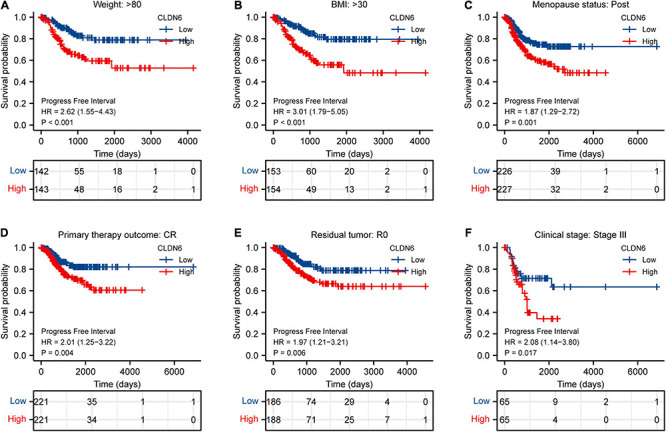
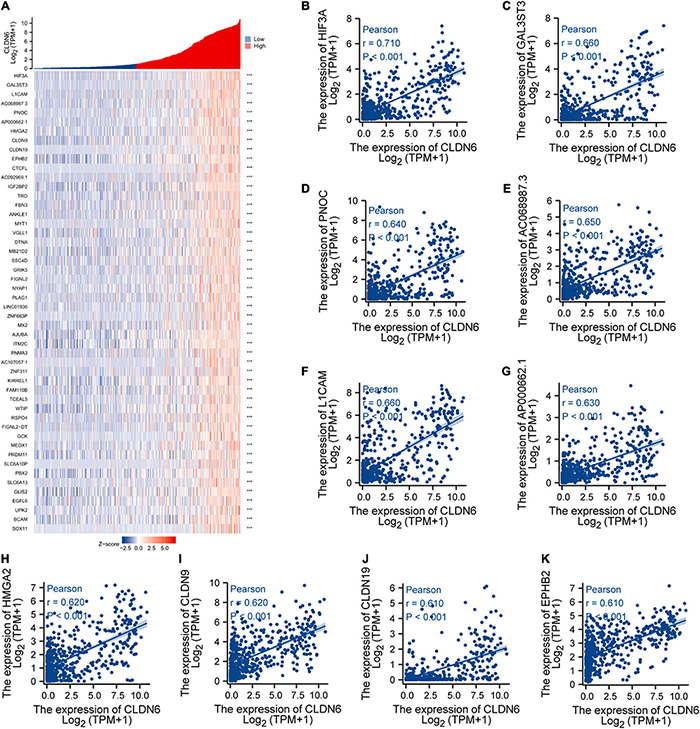
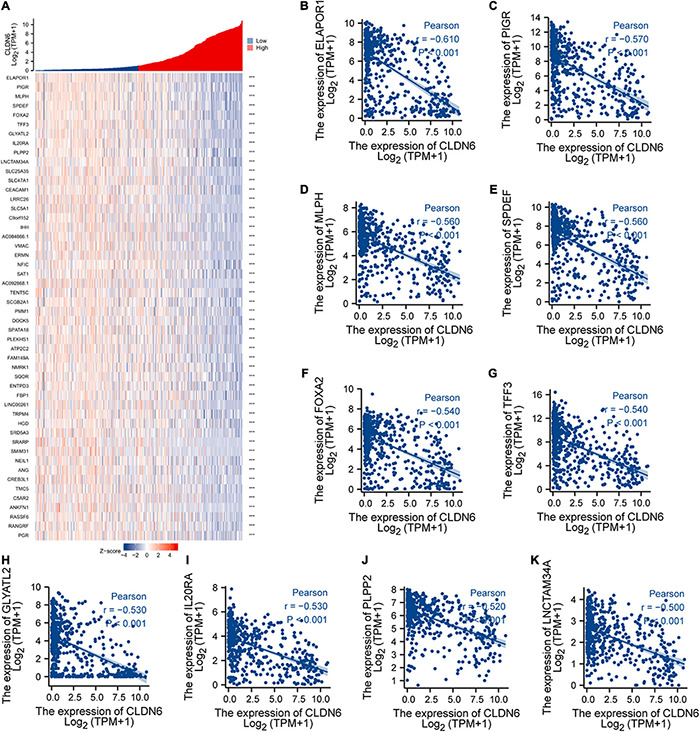
Claudin-6 (CLDN6) is one of the 27 family members of claudins and majorly involved in the tight junction and cell-to-cell adhesion of epithelial cell sheets, playing a significant role in cancer initiation and progression. To provide a more systematic and comprehensive dimension of identifying the diverse significance of CLDN6 in a variety of malignant tumors, we explored CLDN6 through multiple omics data integrative analysis, including gene expression level in pan-cancer and comparison of CLDN6 expression in different molecular subtypes and immune subtypes of pan-cancer, targeted protein, biological functions, molecular signatures, diagnostic value, and prognostic value in pan-cancer. Furthermore, we focused on uterine corpus endometrial carcinoma (UCEC) and further investigated CLDN6 from the perspective of the correlations with clinical characteristics, prognosis in different clinical subgroups, co-expression genes, and differentially expressed genes (DEGs), basing on discussing the validation of its established monoclonal antibody by immunohistochemical staining and semi-quantification reported in the previous study. As a result, CLDN6 expression differs significantly not only in most cancers but also in different molecular and immune subtypes of cancers. Besides, high accuracy in predicting cancers and notable correlations with prognosis of certain cancers suggest that CLDN6 might be a potential diagnostic and prognostic biomarker of cancers. Additionally, CLDN6 is identified to be significantly correlated with age, stage, weight, histological type, histologic grade, and menopause status in UCEC. Moreover, CLDN6 high expression can lead to a worse overall survival (OS), disease-specific survival (DSS), and progression-free interval (PFI) in UCEC, especially in different clinical subgroups of UCEC. Taken together, CLDN6 may be a remarkable molecular biomarker for diagnosis and prognosis in pan-cancer and an independent prognostic risk factor of UCEC, presenting to be a promising molecular target for cancer therapy.

Keywords: Cldn-6; molecular biomarker; omics integrative analysis; pan-cancer analysis; prognostic biomarker.


Conflict of interest statement

The authors declare that the research was conducted in the absence of any commercial or financial relationships that could be construed as a potential conflict of interest.

Figures

FIGURE 1
FIGURE 1
Expression level of CLDN6 gene in tumors and normal tissues. (A) CLDN6 expression in normal tissues; (B) CLDN6 expression in tumor cell lines; (C) CLDN6 expression in TCGA tumors and adjacent normal tissues; (D) CLDN6 expression in TCGA tumors and normal tissues with the data of the GTEx database as controls (*p < 0.05, **p < 0.01, ***p < 0.001).
FIGURE 2
FIGURE 2
Correlations between CLDN6 expression and molecular subtypes across TCGA tumors. (A) UCEC; (B) BRCA; (C) ESCA; (D) LUSC; (E) HNSC; (F) OV; (G) STAD.
FIGURE 3
FIGURE 3
Correlations between CLDN6 expression and immune subtypes across TCGA tumors. (A) UCEC; (B) OV; (C) STAD; (D) LUSC; (E) KICH; (F) HNSC; (G) CESC; (H) BRCA; (I) BLCA.
FIGURE 4
FIGURE 4
Protein–protein interaction (PPI) network, GO analysis, and KEGG analysis of 50 targeted binding proteins of CLDN6. (A) PPI network; (B) visual network of GO and KEGG analyses; (C) GO analysis; (D) KEGG analysis.
FIGURE 5
FIGURE 5
Receiver operating characteristic (ROC) curve for CLDN6 expression in pan-cancer. (A) ACC; (B) BRCA; (C) CHOL; (D) ESCA; (E) GBM; (F) HNSC; (G) KICH; (H) KIRC; (I) LGG; (J) THYM; (K) STAD; (L) LAML; (M) TGCT; (N) OC; (O) UCS.
FIGURE 6
FIGURE 6
Correlations between CLDN6 expression and the prognosis (OS, DSS, and PFI) of cancers. (A–C) UCEC; (D–F) ACC; (G–I) BLCA; (J–L) STAD.
FIGURE 7
FIGURE 7
Associations between CLDN6 expression and different clinical characteristics in UCEC. (A) Age; (B) weight; (C) primary therapy outcome; (D) clinical stage; (E) histologic grade; (F) histological type. ns, p ≥ 0.05; *p < 0.05; **p < 0.01; ***p < 0.001.
FIGURE 8
FIGURE 8
Associations between CLDN6 expression and the OS in different clinical subgroups of UCEC. (A) Age > 60; (B) weight > 80; (C) BMI > 30; (D) tumor invasion ≥ 50%; (E) postmenopause; (F) primary therapy outcome (CR); (G) residual tumor (R0); (H) radiation therapy (No); (I) diabetes (No).
FIGURE 9
FIGURE 9
Associations between CLDN6 expression and the DSS in different clinical subgroups of UCEC. (A) Age > 60; (B) weight > 80; (C) BMI > 30; (D) tumor invasion ≥ 50%; (E) postmenopause; (F) primary therapy outcome (CR); (G) radiation therapy (No).
FIGURE 10
FIGURE 10
Associations between CLDN6 expression and the PFI in different clinical subgroups of UCEC. (A) Weight > 80; (B) BMI > 30; (C) postmenopause; (D) primary therapy outcome (CR); (E) residual tumor (R0); (F) stage III.
FIGURE 11
FIGURE 11
Top 50 genes positively correlated with CLDN6 expression in UCEC. (A) The gene co-expression heatmap of the top 50 genes positively correlated with CLDN6 in UCEC; (B–K) correlation analysis of the top 10 genes and CLDN6 in the heatmap.
FIGURE 12
FIGURE 12
Top 50 genes negatively correlated with CLDN6 expression in UCEC. (A) The gene co-expression heatmap of the top 50 genes negatively correlated with CLDN6 in UCEC; (B–K) correlation analysis of the top 10 genes and CLDN6 in the heatmap.
FIGURE 13
FIGURE 13
Protein–protein interaction (PPI) network building and GO and KEGG analyses of DEGs between CLDN6 high expression and low expression groups in UCEC. (A) The volcano map of DEGs (red: upregulation; blue: downregulation); (B,C) GO and KEGG analyses of DEGs; (D–F) hub genes of PPI network and MCODE2 components identified in the gene lists.

References

    1. Auguste A., Blanc-Durand F., Deloger M., Le Formal A., Bareja R., Wilkes D. C., et al. (2020). Small cell carcinoma of the ovary, hypercalcemic type (SCCOHT) beyond SMARCA4 mutations: a comprehensive genomic analysis. Cells 9:1496. 10.3390/cells9061496 - DOI - PMC - PubMed
    1. Barmeyer C., Schulzke J. D., Fromm M. (2015). Claudin-related intestinal diseases. Semin. Cell Dev. Biol. 42 30–38. 10.1016/j.semcdb.2015.05.006 - DOI - PubMed
    1. Baumholtz A. I., Gupta I. R., Ryan A. K. (2017). Claudins in morphogenesis: forming an epithelial tube. Tissue Barriers 5:e1361899. 10.1080/21688370.2017.1361899 - DOI - PMC - PubMed
    1. Birks D. K., Kleinschmidt-Demasters B. K., Donson A. M., Barton V. N., Mcnatt S. A., Foreman N. K., et al. (2010). Claudin 6 is a positive marker for atypical teratoid/rhabdoid tumors. Brain Pathol. 20 140–150. 10.1111/j.1750-3639.2008.00255.x - DOI - PMC - PubMed
    1. Cherradi S., Martineau P., Gongora C., Del Rio M. (2019). Claudin gene expression profiles and clinical value in colorectal tumors classified according to their molecular subtype. Cancer Manag. Res. 11 1337–1348. 10.2147/CMAR.S188192 - DOI - PMC - PubMed