. 2021 Jun 29;3(3):fcab141.
doi: 10.1093/braincomms/fcab141. eCollection 2021.

Amyotrophic lateral sclerosis transcriptomics reveals immunological effects of low-dose interleukin-2

Affiliations

Amyotrophic lateral sclerosis transcriptomics reveals immunological effects of low-dose interleukin-2

Ilaria Giovannelli et al. Brain Commun. .

Abstract

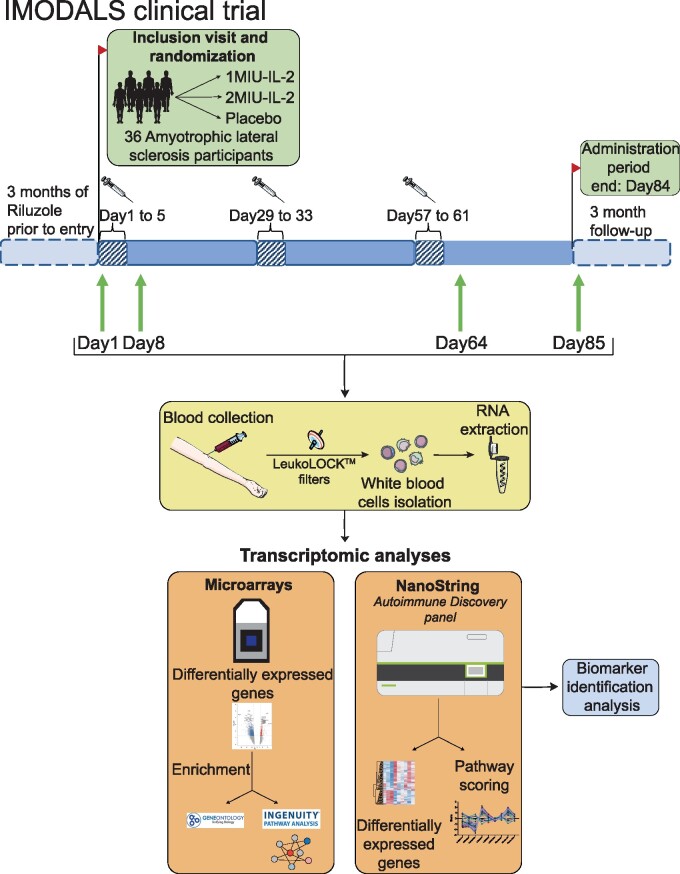
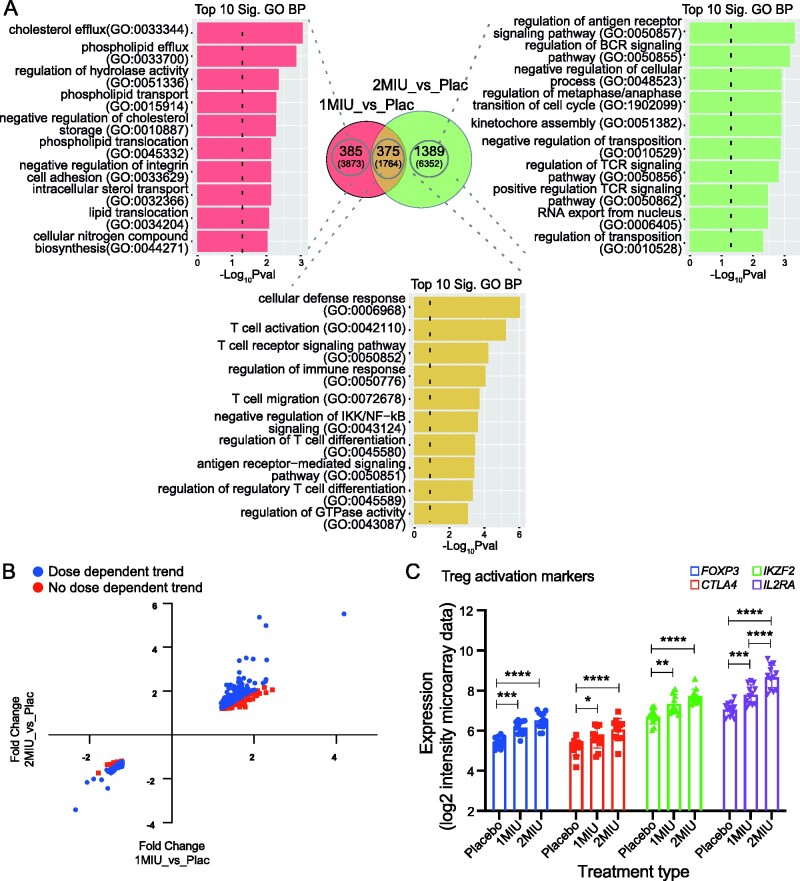
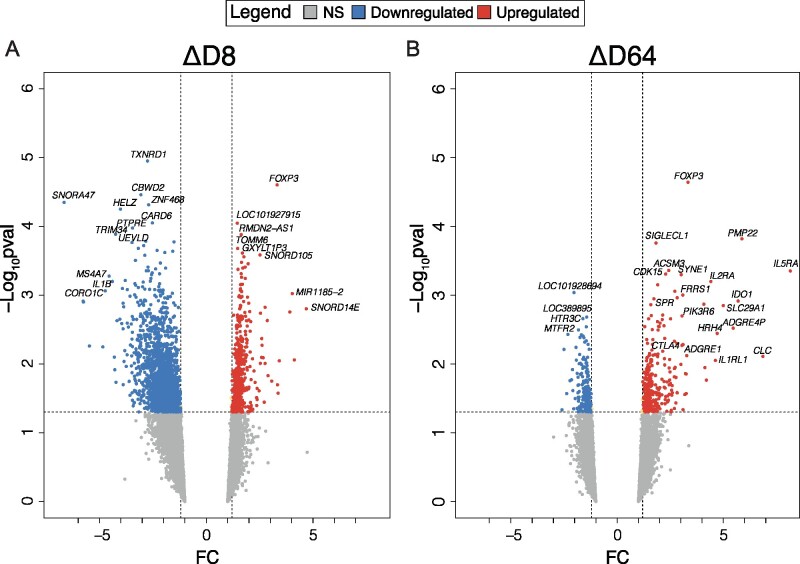
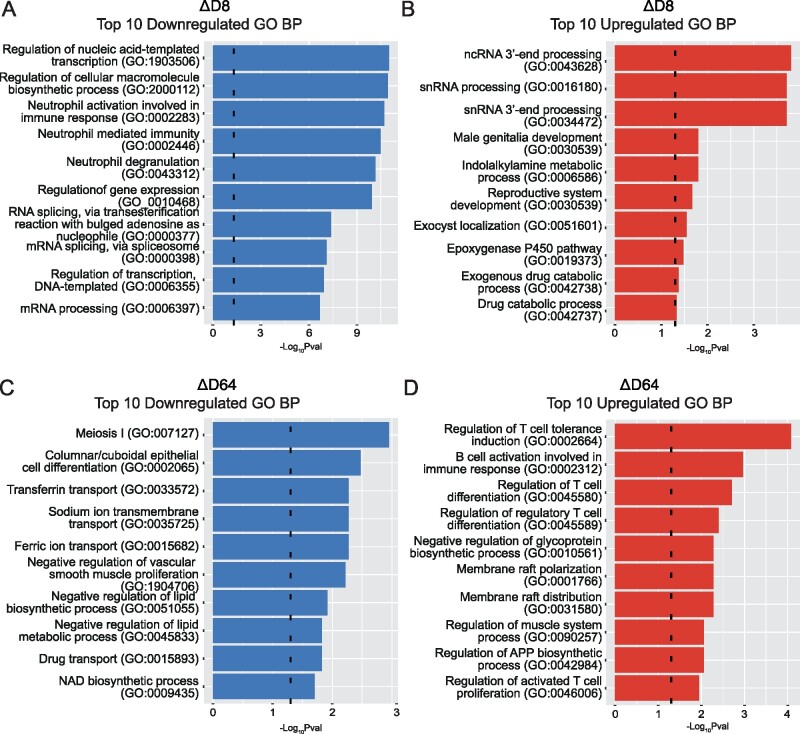
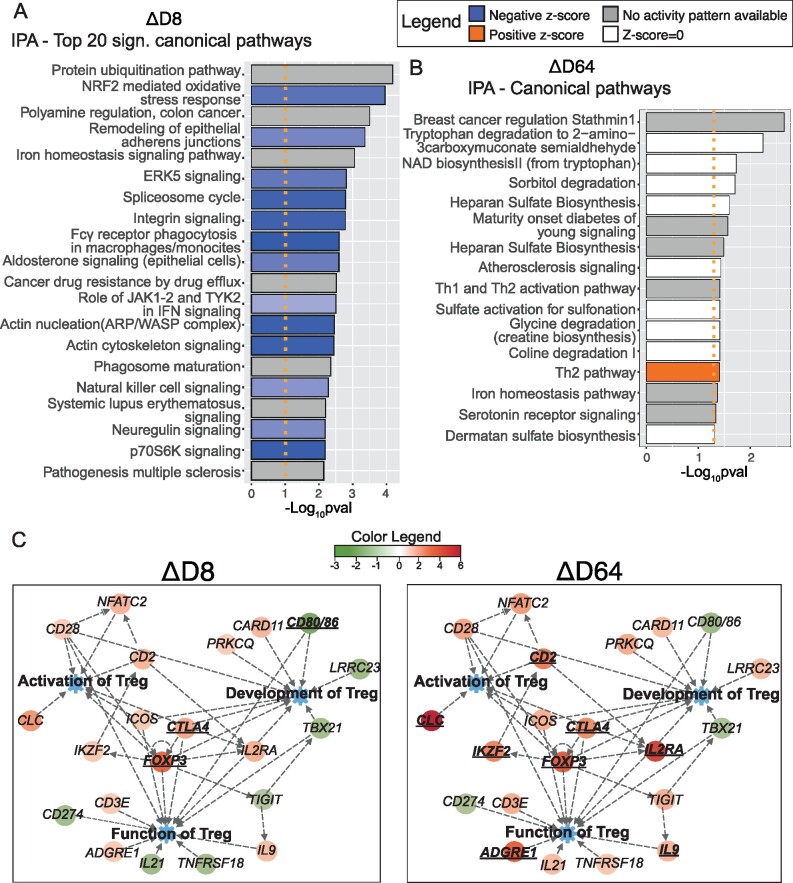
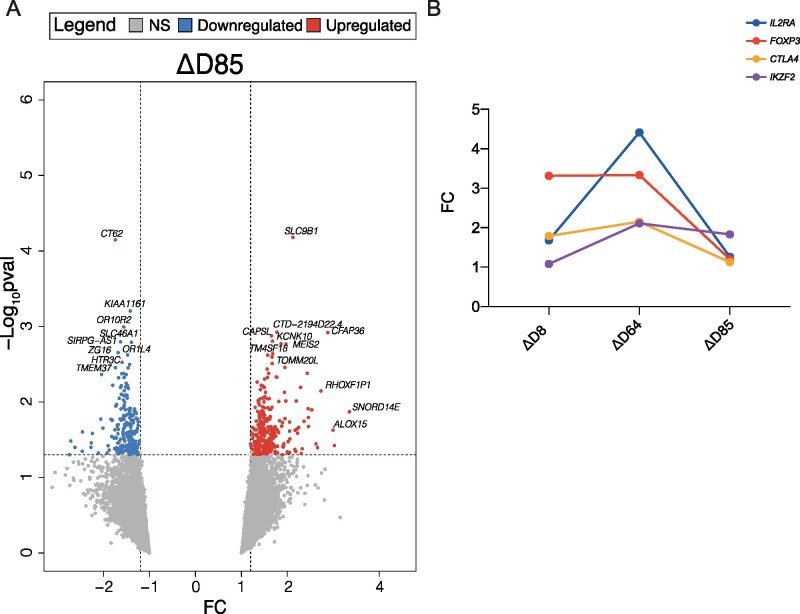
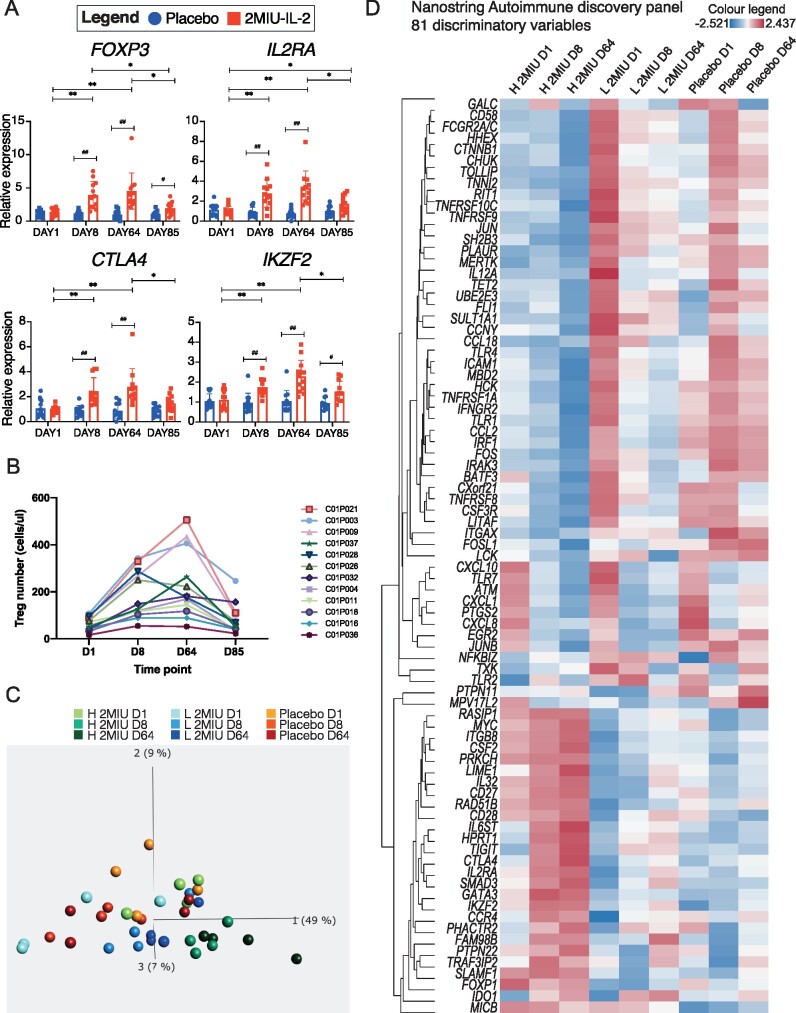
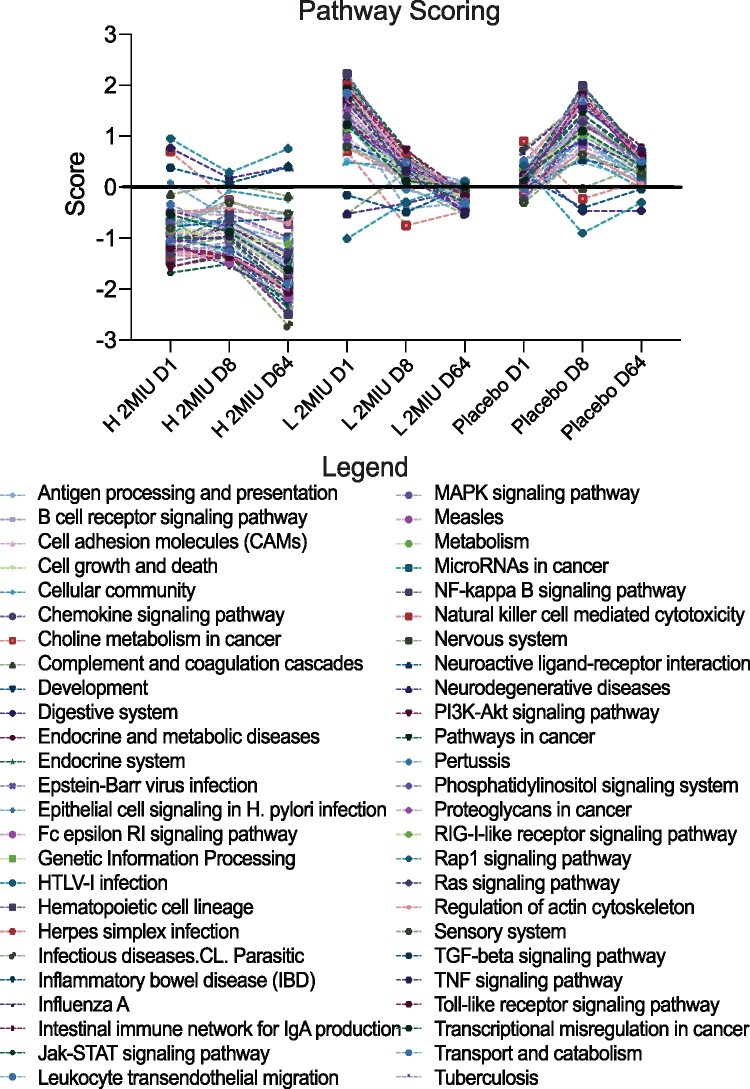
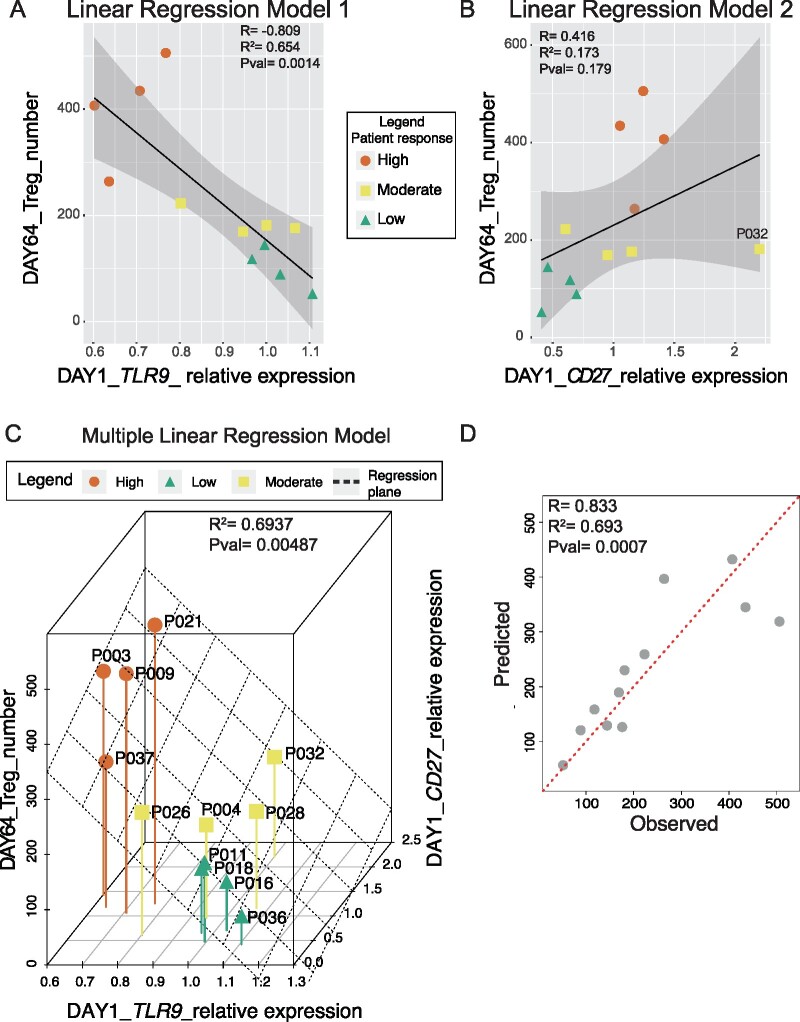
Amyotrophic lateral sclerosis is a fatal neurodegenerative disease causing upper and lower motor neuron loss and currently no effective disease-modifying treatment is available. A pathological feature of this disease is neuroinflammation, a mechanism which involves both CNS-resident and peripheral immune system cells. Regulatory T-cells are immune-suppressive agents known to be dramatically and progressively decreased in patients with amyotrophic lateral sclerosis. Low-dose interleukin-2 promotes regulatory T-cell expansion and was proposed as an immune-modulatory strategy for this disease. A randomized placebo-controlled pilot phase-II clinical trial called Immuno-Modulation in Amyotrophic Lateral Sclerosis was carried out to test safety and activity of low-dose interleukin-2 in 36 amyotrophic lateral sclerosis patients (NCT02059759). Participants were randomized to 1MIU, 2MIU-low-dose interleukin-2 or placebo and underwent one injection daily for 5 days every 28 days for three cycles. In this report, we describe the results of microarray gene expression profiling of trial participants' leukocyte population. We identified a dose-dependent increase in regulatory T-cell markers at the end of the treatment period. Longitudinal analysis revealed an alteration and inhibition of inflammatory pathways occurring promptly at the end of the first treatment cycle. These responses are less pronounced following the end of the third treatment cycle, although an activation of immune-regulatory pathways, involving regulatory T-cells and T helper 2 cells, was evident only after the last cycle. This indicates a cumulative effect of repeated low-dose interleukin-2 administration on regulatory T-cells. Our analysis suggested the existence of inter-individual variation amongst trial participants and we therefore classified patients into low, moderate and high-regulatory T-cell-responders. NanoString profiling revealed substantial baseline differences between participant immunological transcript expression profiles with the least responsive patients showing a more inflammatory-prone phenotype at the beginning of the trial. Finally, we identified two genes in which pre-treatment expression levels correlated with the magnitude of drug responsiveness. Therefore, we proposed a two-biomarker based regression model able to predict patient regulatory T-cell-response to low-dose interleukin-2. These findings and the application of this methodology could be particularly relevant for future precision medicine approaches to treat amyotrophic lateral sclerosis.

Keywords: amyotrophic lateral sclerosis; clinical trial; low-dose interleukin 2; regulatory T cells; transcriptomics.


Figures

Graphical Abstract
Graphical Abstract
Figure 1
Figure 1
End of the treatment (D64) analysis and dose-dependency.(A) Venn diagram showing significant (P-value <0.05) differentially expressed genes (DEGs) from either 1MIU_vs_Placebo or 2MIU_vs_Placebo TAC (Transcriptome analysis console) comparisons. All altered transcripts are reported in brackets while RefSeq annotated transcripts are shown in bold. Overlapping common DEGs are also shown. For each RefSeq transcript list shown in the Venn diagram, the top 10 significant enriched Gene Ontology (GO) biological processes are plotted. X-axis: −Log10 (enrichment P-value); y-axis: GO term. (B) Scatter plot displaying 375 RefSeq DEGs altered in common within the two treatment groups and their fold changes resulting from either 1MIU_vs_Placebo (X-axis) or 2MIU_vs_Placebo (Y-axis) comparisons. 260 out of 375 genes (69.3%) show a dose-dependent expression (in blue) while transcripts showing no dose-dependent trend are represented in red. (C) The expression levels (SST-RMA normalized log2 of signal intensity from the microarrays) of 4 Treg activation markers—FOXP3, CTLA4, IKZF2 and IL2RA—are shown. A significant dose-dependent upregulation of these transcripts is detected. Box plots show mean ± SD. A two-way ANOVA with Tukey's correction for multiple comparisons was conducted. *: Adjusted P-value < 0.05, **: Adjusted P-value < 0.01, ***: Adjusted P-value < 0.001, ****: Adjusted P-value < 0.0001. SST-RMA, signal space transformation robust multi-chip analysis method for microarray data normalization.
Figure 2
Figure 2
Transcriptional changes during 2MIU-IL2 administration. Volcano plots displaying differentially expressed genes (DEGs) resulting from the comparisons ΔD8 (A) and ΔD64 (B). DEGs are plotted and colour-coded depending on their fold change (FC) and their significance levels (−Log10P-value): non-significant or transcripts that failed the FC cut-off are reported in grey, significant and with FC ≤−1.2 in blue and significant and with FC ≥1.2 in red. Three black lines are also shown: the horizontal line indicates the significance threshold (−Log10P-value = 1.3) and two vertical dotted lines mark the FC cut-off at −1.2 and 1.2, respectively. A widespread downregulation is detectable at D8, while at D64 an increased upregulation is reported amongst which some Treg makers are recognizable (Empirical Bayesian statistics was conducted using Limma to find significant DEGs).
Figure 3
Figure 3
Altered biological processes during 2MIU-IL2 administration. Bar plots resulting from GO Biological Processes (GO BP) enrichment analysis. In particular, the top 10 significant downregulated (A) and upregulated (B) GO BPs from ΔD8 and top 10 significant downregulated (C) and upregulated (D) GO BPs from ΔD64 are shown. Significance threshold lines are reported in black (−Log10P-value = 1.3). A significant downregulation of pro-inflammatory processes involving neutrophils and an alteration in the RNA metabolism are observed at D8 while, later during the course of the trial, a significant upregulation of Treg processes is documented (Fisher's exact statistical test was performed using Enrichr to cluster transcripts into GO BP terms).
Figure 4
Figure 4
Ingenuity Pathway Analysis (IPA). Bar plots displaying top 20 significant IPA canonical pathways. Activated (z-score > 0, in orange) or inhibited pathways (z-score < 0, in blue) resulting from the analysis ΔD8 (A) and ΔD64 (B) are shown. Significant pathways but with z-score equal to 0 (in white) or with no activation prediction available in the software (in grey) are also reported. A significance threshold line is displayed in orange (−Log10P-value = 1.3). A widespread downregulation of inflammatory pathways is detectable at D8 while fewer pathways are altered at D64. However, activation of Th2 is reported (A right-tailed Fisher’s Exact test was conducted to calculate significantly altered pathways and the z-score was computed to predict the activation state of each mechanism). (C) Customized pathways created with IPA displaying key regulators of activation, development and functions of Tregs. In particular, two pathway maps displaying fold changes (FCs) from ΔD8 and ΔD64 are juxtaposed for comparison. Significant (P-value < 0.05) differentially expressed genes are shown in bold and their gene symbol is underlined. A more prominent upregulation of Treg genes is reported at D64. Data were analysed through the use of IPA (QIAGEN Inc., https://www.qiagenbioinformatics.com/products/ingenuitypathway-analysis).
Figure 5
Figure 5
Transcriptional changes during the follow-up period. (A) Volcano plot showing differentially expressed genes (DEGs) resulting from the comparisons ΔD85. DEGs are plotted and colour-coded depending on their fold change (FC) and their significance levels (−Log10P-value): non-significant transcripts or transcripts that failed the FC cut-off are reported in grey, significant and with FC ≤−1.2 in blue and significant and with FC ≥1.2 in red. Three black lines are also shown: the horizontal line indicates the significance threshold (−Log10P-value = 1.3 or P-value = 0.05) and the two vertical dotted lines mark the FC cut-offs at −1.2 and 1.2, respectively (Empirical Bayesian statistics was conducted using Limma to find significant DEGs). (B) Plot displaying the variation in the expression of four key Treg activation markers—FOXP3, IL2RA, CTLA4 and IKZF2—throughout and after the administration period. Their expression increases during the 2MIU-IL-2 treatment and peaks at D64 but the levels of expression decrease at D85. On the x-axis the different Limma comparisons are shown while on the y-axis the FC for each transcript is reported.
Figure 6
Figure 6
Microarray validation and patient variability. (A) Graphs showing expression of FOXP3, IL2RA, CTLA4 and IKZF2 in 2MIU-IL-2 treated (in red) and placebo (in blue) patients at the four different time points (D1, D8, D64 and D85). Data were generated through qRT-PCR. A time-dependent activation of these markers is reported in the ld-IL-2 group. Box plots display mean ± SD (technical replicates = 3). A two-way ANOVA with either Sidak (for comparisons between different treatment regimens, significant differences indicated with *) or Tukey (for comparisons between time points within the same treatment type, significant differences indicated with #) correction for multiple comparisons was conducted. * or #: Adjusted P-value <0.05, ** or ##: Adjusted P-value <0.01. (B) Graph displaying the number of Tregs per μl of blood of each 2MIU IL-2-treated participant at each time point (Flow-cytometry data). Patients are shown with different colours and their IDs are reported in the legend (C) PCA plot summarizing expression differences between samples depending on treatment regimen and time point (colour code legend is reported. H 2MIU D1, D8, D64 = high-Treg-responders at D1, D8 and D64; L 2MIU D1, D8, D64 = low-Treg-responders at D1, D8 and D64 and Placebo at D1, D8 and D64). High-Treg-responders from D8 and D64 are the most different samples. (Qlucore multi group comparison statistical test, P-value <0.05) (D) Hierarchically clustered heatmap displaying differences in the expression of 81 transcripts identified as discriminating variables from the PCA analysis in Fig. B. Gene expression variations across sample groups (H 2MIU D1, D8, D64 = high-Treg-responders at D1, D8 and D64; L 2MIU D1, D8, D64= low-Treg-responders at D1, D8 and D64 and Placebo at D1, D8 and D64) are displayed as z-scores (positive z-scores in red, negative in blue). An opposite expression between high and low-Treg-responders is detectable, especially at D1.
Figure 7
Figure 7
Pathway scoring analysis. Graph showing results from the pathway scoring analysis performed using Advanced Analysis nSolver software. Pathway activation scores are plotted as a function of the different treatment type and time points (H 2MIU D1, D8, D64 = high-Treg-responders at D1, D8 and D64; L 2MIU D1, D8, D64 = low-Treg-responders at D1, D8 and D64 and Placebo at D1, D8 and D64). An evident downregulation of several inflammatory pathways is demonstrated in both high and low-Treg-responders although baseline differences were observed between the two treated subgroups.
Figure 8
Figure 8
Biomarker identification analysis. Linear regression models describing the correlation between the expression of TLR9 (A) and CD27 (B) at the baseline (D1) and the Treg number at D64 for each 2MIU-IL-2 treated patient. Each dot represents a trial participant (average expression values computed from 3 qRT-PCR experiments, N = 3) and they are colour-coded depending on their Treg-response type: high (orange dots), moderate (yellow squares) and low (green triangles). A regression line (black) and its regression confidence bands (grey) are also shown. Linear regression model for TLR9 (A: R = −0.809, R2 = 0.654, P-value = 0.0014) was stronger than the model for CD27 (B: R = 0.416, R2= 0.173, P-value = 0.179) (C) Multiple linear regression analysis indicating the relationship between 2 predictors (expression of TLR9 and CD27 at D1) and the response variable (number of Tregs at D64). A good prediction model was obtained (R2 = 0.6937and P-value = 0.00487). Each dot represents a patient and they are colour-coded depending on their Treg-response type: high (orange dots), moderate (yellow squares) and low (green triangles). The regression plane is also displayed in black. (D) Plot showing the correlation between flow-cytometry-measured Treg counts (observed, X-axis) and Treg numbers predicted by our multiple linear model (predicted, Y-axis). Correlation metrics (R = 0.833, R2 = 0.693, P-value= 0.0007) suggest an acceptable predictive model. Each dot represents a sample and a red dotted regression line is also shown.

References

    1. Hardiman O, Al-Chalabi A, Chio A, et al.Amyotrophic lateral sclerosis. Nat Rev Dis Primers. 2017;3:17071. - PubMed
    1. Nagoshi N, Nakashima H, Fehlings MG.. Riluzole as a neuroprotective drug for spinal cord injury: From bench to bedside. Molecules. 2015;20(5):7775–7789. - PMC - PubMed
    1. Fang T, Al Khleifat A, Meurgey JH, et al.Stage at which riluzole treatment prolongs survival in patients with amyotrophic lateral sclerosis: A retrospective analysis of data from a dose-ranging study. Lancet Neurol. 2018;17(5):416–422. - PMC - PubMed
    1. GROUP WGOBOTEM-AS. Open-label 24-week extension study of edaravone (MCI-186) in amyotrophic lateral sclerosis. Amyotroph Lateral Scler Frontotemporal Degener. 2017;18(Suppl 1):55–63. - PubMed
    1. Edaravone Writing Group. Safety and efficacy of edaravone in well defined patients with amyotrophic lateral sclerosis: A randomised, double-blind, placebo-controlled trial. Lancet Neurol. 2017;16(7):505–512. - PubMed

LinkOut - more resources