. 2022 Jan 21;48(1):56-68.
doi: 10.1093/schbul/sbab090.

Psychosis Biotypes: Replication and Validation from the B-SNIP Consortium

Affiliations

Psychosis Biotypes: Replication and Validation from the B-SNIP Consortium

Brett A Clementz et al. Schizophr Bull. .

Abstract

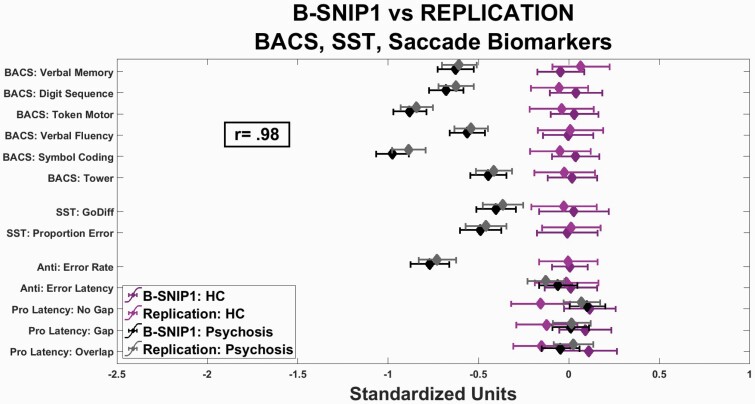
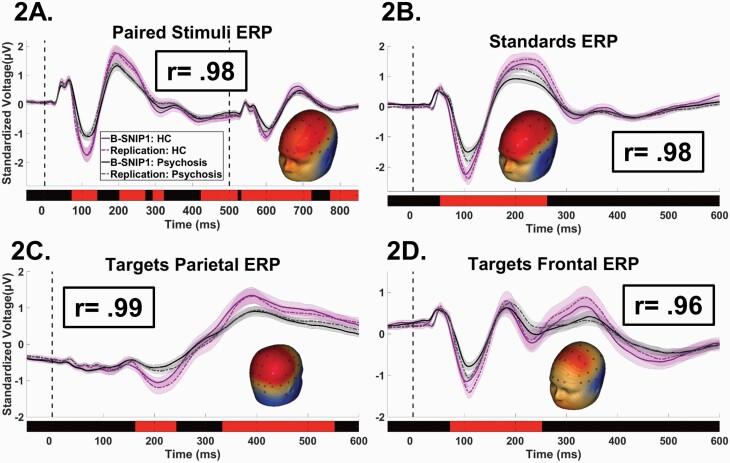
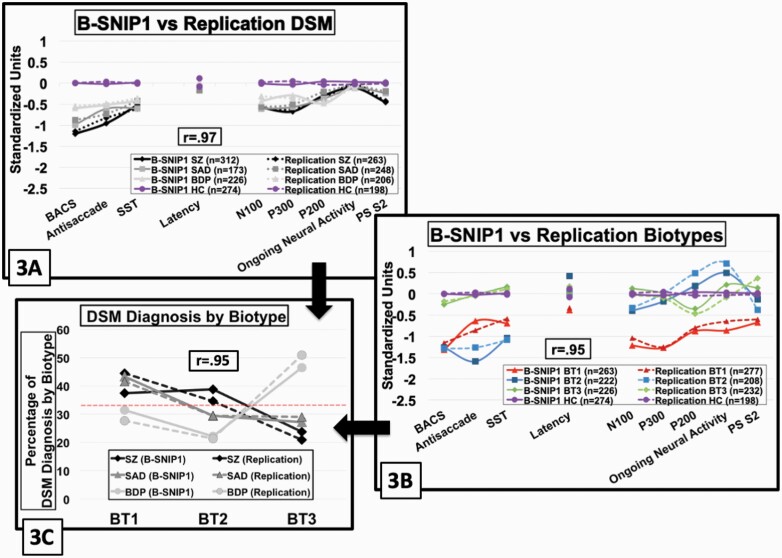
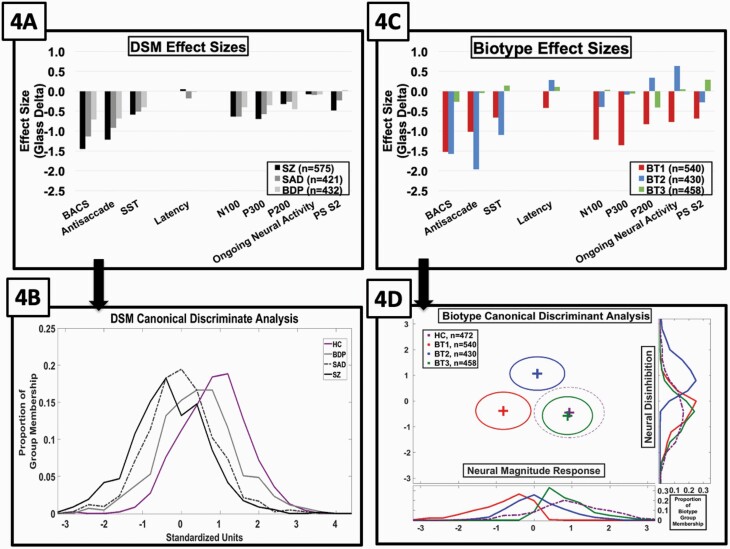
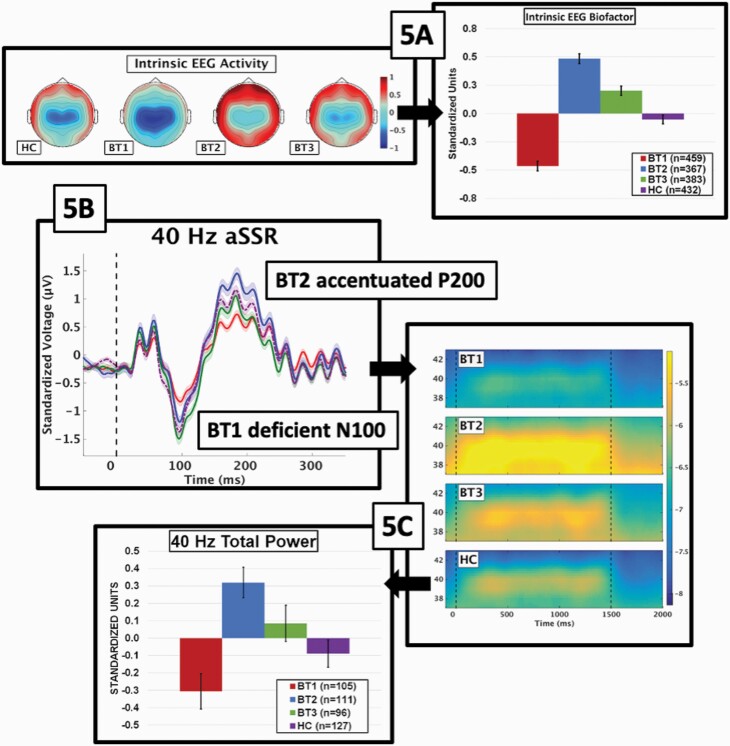
Current clinical phenomenological diagnosis in psychiatry neither captures biologically homologous disease entities nor allows for individualized treatment prescriptions based on neurobiology. In this report, we studied two large samples of cases with schizophrenia, schizoaffective, and bipolar I disorder with psychosis, presentations with clinical features of hallucinations, delusions, thought disorder, affective, or negative symptoms. A biomarker approach to subtyping psychosis cases (called psychosis Biotypes) captured neurobiological homology that was missed by conventional clinical diagnoses. Two samples (called "B-SNIP1" with 711 psychosis and 274 healthy persons, and the "replication sample" with 717 psychosis and 198 healthy persons) showed that 44 individual biomarkers, drawn from general cognition (BACS), motor inhibitory (stop signal), saccadic system (pro- and anti-saccades), and auditory EEG/ERP (paired-stimuli and oddball) tasks of psychosis-relevant brain functions were replicable (r's from .96-.99) and temporally stable (r's from .76-.95). Using numerical taxonomy (k-means clustering) with nine groups of integrated biomarker characteristics (called bio-factors) yielded three Biotypes that were virtually identical between the two samples and showed highly similar case assignments to subgroups based on cross-validations (88.5%-89%). Biotypes-1 and -2 shared poor cognition. Biotype-1 was further characterized by low neural response magnitudes, while Biotype-2 was further characterized by overactive neural responses and poor sensory motor inhibition. Biotype-3 was nearly normal on all bio-factors. Construct validation of Biotype EEG/ERP neurophysiology using measures of intrinsic neural activity and auditory steady state stimulation highlighted the robustness of these outcomes. Psychosis Biotypes may yield meaningful neurobiological targets for treatments and etiological investigations.

Keywords: Biotypes; EEG; biomarkers; classification; cognition; psychosis; saccades.


Figures

Fig. 1.
Fig. 1.
Event related potential waveforms by stimulus type and project. Standardized and grand averaged voltage (y-axis) by time (msec; x-axis) for ERP waveforms (“virtual sensors”). Time 0 on the x-axis indicates the time of initial stimulus delivery. For each plot, waveforms are shown for the healthy (shades of purple) and psychosis cases (shades of gray), with the solid lines indicating B-SNIP1 and the dotted lines indicating replication sample. Confidence interval clouds (99%tile) are shown for each line. Red bars above the x-axis show time ranges of significant differences between healthy and psychosis groups. Head inserts show the surface topography of the individual virtual sensors. Boxed r-values are correlations between the B-SNIP1 and replication sample waveforms. (A). Paired-stimuli paradigm—dotted lines indicate the time of S1 (first stimulus) and S2 (second stimulus); oddball task waveforms—(B) standard stimuli; (C) parietal cortex response (P3b) to target stimuli; (D) frontal cortex response (P3a) to target stimuli.
Fig. 2.
Fig. 2.
Cognition and saccade variables by project. Standardized scores (x-axis) for individual variables (y-axis) from the BACS, SST, and anti (Anti)- and pro (Pro)-saccade tasks, comparing healthy persons (shades of purple) and psychosis cases (shades of gray). Darker symbols and lines show means and standard deviations for B-SNIP1, and lighter symbols and lines show means and standard deviations for the replication sample. The correlation of mean performances between B-SNIP1 and the replication sample across all measures was .98.
Fig. 3.
Fig. 3.
Bio-factor patterns by DSM psychosis diagnosis and psychosis biotypes between B-SNIP1 and replication samples. Bio-factor means by standardized scores (y-axis) are displayed by group and project, with color-coding and symbol differentiations. Solid lines indicate B-SNIP1 and dotted lines indicate replication sample. Boxed r-values are the correlations between the B-SNIP1 and replication samples. Lines link conceptually related variables (cognition variables on the left and ERP variables on the right). The legend shows the number of observations by group. Purple lines and symbols show the healthy data, with their y-axis values adjusted so the average value of B-SNIP1 and the replication sample is zero; the healthy values are the same in plots (A) and (B). The psychosis groups are displayed as a function of their difference from the healthy means. In relation to the healthy subjects, values below zero indicate deficient values and those above zero indicate exuberant values. (A) DSM diagnoses; (B) psychosis biotypes; (C) the proportion of cases within each DSM diagnosis that had each biotype.
Fig. 4.
Fig. 4.
Effect size separations from healthy by DSM psychosis diagnoses and psychosis Biotypes subgroups. B-SNIP1 and replication samples were combined for these analyses given their high degree of similarity. Glass effect sizes (y-axis) by bio-factor (x-axis) are shown from the healthy for DSM diagnoses (A) and psychosis biotypes (C). In both plots, the healthy sample means fall at the zero line on the y-axis. The outcome of canonical discriminant analyses, using all bio-factors to create functions that optimally separate groups are shown in (B) and (D). (B) There was one significant function that differentiated the DSM diagnosis psychosis groups. Plots show proportion of cases within each group (y-axis) as a function of their standardized discriminant function scores (x-axis). (D) There were two discriminant functions that differentiated the psychosis Biotype groups. The first function on the x-axis captured “Neural Response Magnitude,” and the second function on the y-axis captured “Neural Disinhibition.” Frequency polygons show the proportion of cases by group at the bottom (Neural Response Magnitude) and right (Neural Disinhibition) of the central plot that shows the centroids and standard deviation ellipses by group.
Fig. 5.
Fig. 5.
Validation of biotype neurophysiological features. (A) Top-down topographies on the left show strength of neural response for the intrinsic EEG activity (IEA) bio-factor. The scale of neural power from FFT is to the right of the topographies, with deeper red indicating stronger neural response and deeper blue indicating weaker neural response. The bar chart shows the means and standard errors for the IEA bio-factor by group. Parts (B) and (C) show different aspects of neural response from 40-Hz auditory steady-state stimulation. (B) The auditory ERP from 50 ms before to 350 ms after stimulation onset. The location and effects for the N100 (BT1 deficient) and P200 (BT2 accentuated) are shown. The “divots” in the P200 ERP response are the beginning of the neural oscillations to the 40-Hz stimuli. (C) Following the ERP, auditory cortical neurons oscillate at 40hz throughout stimulation. The time-frequency plot to the right of the ERP shows single trial power by group centered on 40-Hz. The single trial power scale is shown to the right, with brighter yellow indicating stronger response and deeper blue indicating weaker response. The associated bar chart shows the means and standard errors by group for strength of the 40-Hz response.

Similar articles

Cited by

References

    1. Biedermann F, Fleischhacker WW. Psychotic disorders in DSM-5 and ICD-11. CNS Spectr. 2016;21(4):349–354. - PubMed
    1. American Psychiatric Association., American Psychiatric Association. DSM-5 Task Force. Diagnostic and Statistical Manual of Mental Disorders: DSM-5. 5th ed. American Psychiatric Association; 2013:xliv; 947 p.
    1. First MB, Reed GM, Hyman SE, Saxena S. The development of the ICD-11 Clinical Descriptions and Diagnostic Guidelines for Mental and Behavioural Disorders. World Psychiatry. 2015;14(1):82–90. - PMC - PubMed
    1. Hyman SE. The diagnosis of mental disorders: the problem of reification. Annu Rev Clin Psychol. 2010;6:155–179. - PubMed
    1. Price ND, Magis AT, Earls JC, et al. . A wellness study of 108 individuals using personal, dense, dynamic data clouds. Nat Biotechnol. 2017;35(8):747–756. - PMC - PubMed

Publication types

MeSH terms