

Mitogen-activated protein kinase activity drives cell trajectories in colorectal cancer
- PMID: 34409732
- PMCID: PMC8495451
- DOI: 10.15252/emmm.202114123
Mitogen-activated protein kinase activity drives cell trajectories in colorectal cancer
Abstract
In colorectal cancer, oncogenic mutations transform a hierarchically organized and homeostatic epithelium into invasive cancer tissue lacking visible organization. We sought to define transcriptional states of colorectal cancer cells and signals controlling their development by performing single-cell transcriptome analysis of tumors and matched non-cancerous tissues of twelve colorectal cancer patients. We defined patient-overarching colorectal cancer cell clusters characterized by differential activities of oncogenic signaling pathways such as mitogen-activated protein kinase and oncogenic traits such as replication stress. RNA metabolic labeling and assessment of RNA velocity in patient-derived organoids revealed developmental trajectories of colorectal cancer cells organized along a mitogen-activated protein kinase activity gradient. This was in contrast to normal colon organoid cells developing along graded Wnt activity. Experimental targeting of EGFR-BRAF-MEK in cancer organoids affected signaling and gene expression contingent on predictive KRAS/BRAF mutations and induced cell plasticity overriding default developmental trajectories. Our results highlight directional cancer cell development as a driver of non-genetic cancer cell heterogeneity and re-routing of trajectories as a response to targeted therapy.
Keywords: ERK; RNA velocity; SLAM-Seq; cancer profiling; single-cell RNA sequencing.
© 2021 The Authors. Published under the terms of the CC BY 4.0 license.
Conflict of interest statement
The authors declare that they have no conflict of interest.
Figures
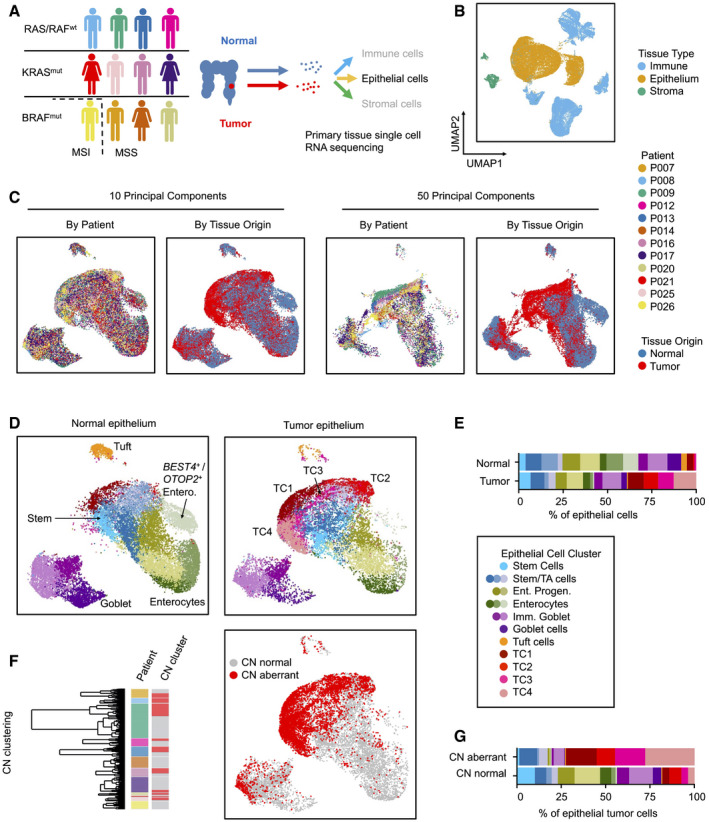
- A
Workflow of the Clinical Single Cell Sequencing pipeline. In short, CRC and adjacent non‐tumor tissue were sampled from 12 patients. Single‐cell RNA sequencing data were generated using the 10× Genomics platform, as outlined in Materials and Methods. For histology, see Appendix Fig S1. For patient characteristics, see Table EV1, for mutational data, see Table EV2.
- B–D
UMAPs of single‐cell transcriptome data. (B) UMAPs of epithelial, immune, and stromal cell transcriptomes, color‐coded by tissue origin as assessed by marker genes. For marker genes, see Table EV3. (C) UMAPs of epithelial cell transcriptomes, color‐coded by patient identity or tissue of origin, as indicated. (D) UMAPs of epithelial cells, separated by tissue of origin (normal vs. tumor). Clusters are color‐coded by cell identity, as inferred from marker genes as outlined in main text. For epithelial cell cluster marker genes, see Table EV4.
- E
Relative fractions of epithelial cell states for all patients.
- F
Identification of copy number‐aberrant versus normal epithelial cells in tumor tissue. To the left: Cell cluster dendrogram, color‐coded by patient and by copy number‐associated clusters (n = 2 per patient, copy number normal cluster: gray; copy number‐aberrant cluster: red). To the right: Localization of SCN‐aberrant cells in the UMAP (red).
- G
Relative fractions of epithelial cell states for SCN‐normal versus SCN‐aberrant cells for all patients. For fractions by patient and copy number status, see Fig EV2.
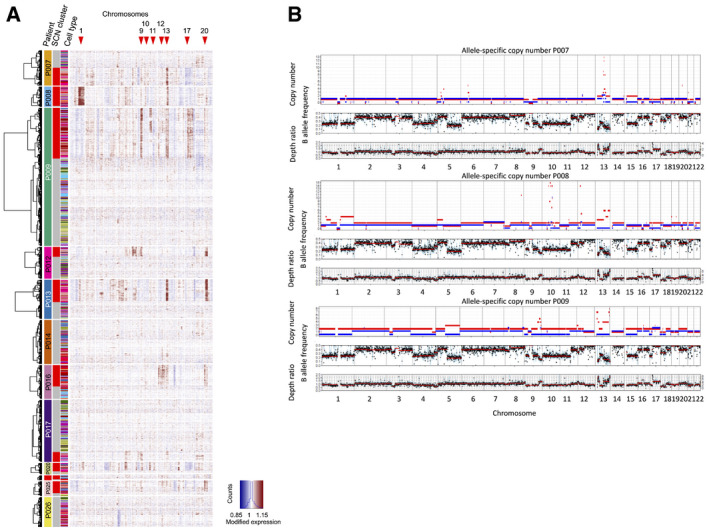
Copy number calling from single‐cell transcriptomes, using InferCNV.
Copy number calling from exome sequences. To validate SCNAs from single‐cell transcriptome data, we performed allele‐specific SCNA calling for patients P007, P008, and P009 from bulk whole exome data. Germline variants were discovered de novo, and read counts were accumulated for each allele at heterozygous germline variants using bcftools v1.9 multi‐allelic caller. Discovered variants and read counts were passed to Sequenza 3.0 for segmentation and calling of allele‐specific SCNAs. Top tracks: copy number segments of major and minor alleles. Middle tracks: B (minor) allele frequency. Bottom tracks: depth ratio of matched tumor versus normal samples with corresponding second axis of inferred copy number. P007 showed multiple LOH events on chromosomes 1, 3, 5, 6, 8, 9, 13, 15, 17, and 21 as well as a focal amplification on chromosome 13. P008 demonstrated a similar SCNA pattern with LOH events on chromosomes 8, 9, 10, 12, 13, 17, and 22 as well as multiple focal amplifications on chromosomes 8, 10, 12, and 13. P009 was characterized by widespread copy number neutral LOH in about 50% of the genome. Focal amplifications were found on chromosomes 9 and 13.
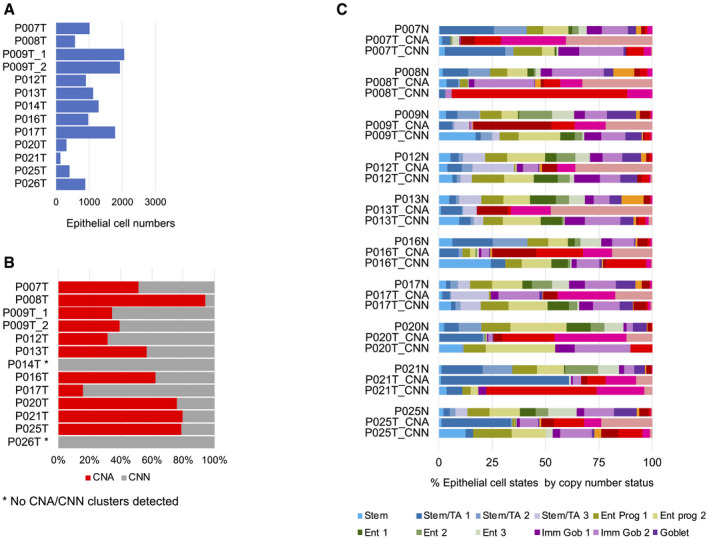
Epithelial cell numbers per tumor sample retrieved by our analysis pipeline.
Copy number calling on tumor samples. No copy number clusters could be called for P014T and P026T (see also Fig EV1A).
Relative prevalence of cell differentiation states in the epithelial compartment, per patient. Cell state prevalence from tumor samples is given for copy number‐aberrant (CNA) versus copy number normal (CNN) cells.
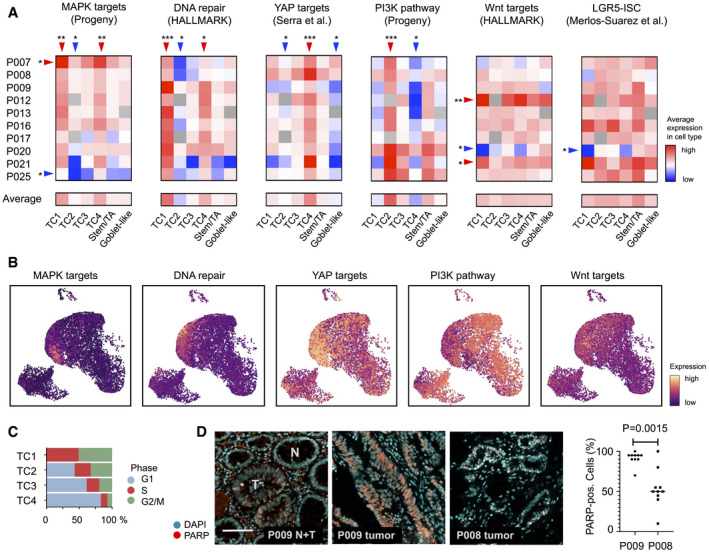
Transcriptional activity associated with key oncogenic traits and signals, by tumor‐specific cell type and patient, as indicated. Red: high activity, blue: low activity. Significance was assessed by Kruskal–Wallis test (FDR‐corrected P < 0.05), followed by a post hoc analysis using a Wilcox test of each group against all other groups, FDR‐corrected significance levels are shown (*P < 0.05; **P < 0.01; ***P < 0.001).
Visualization of signatures corresponding to oncogenic traits and signals in the tumor cell transcriptome UMAP.
Cell cycle distribution of TC1‐4 epithelial tumor cells, as inferred from single‐cell transcriptomes.
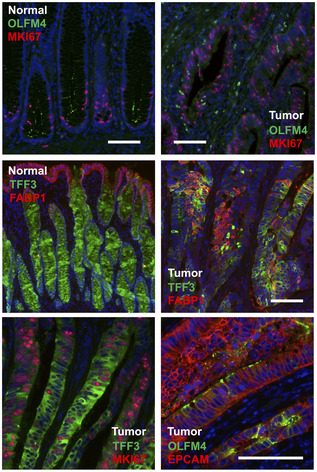
Immunofluorescence of DNA damage‐associated nuclear protein PARP. Images show adjacent normal and tumor crypts of tissue P009T, marked by N and T, respectively, and tumor tissue of patients P008 and P009, as indicated. Scale bar 100 µm. Significance was assessed by an unpaired t‐test, after blinded analysis of 10 random images per tumor.
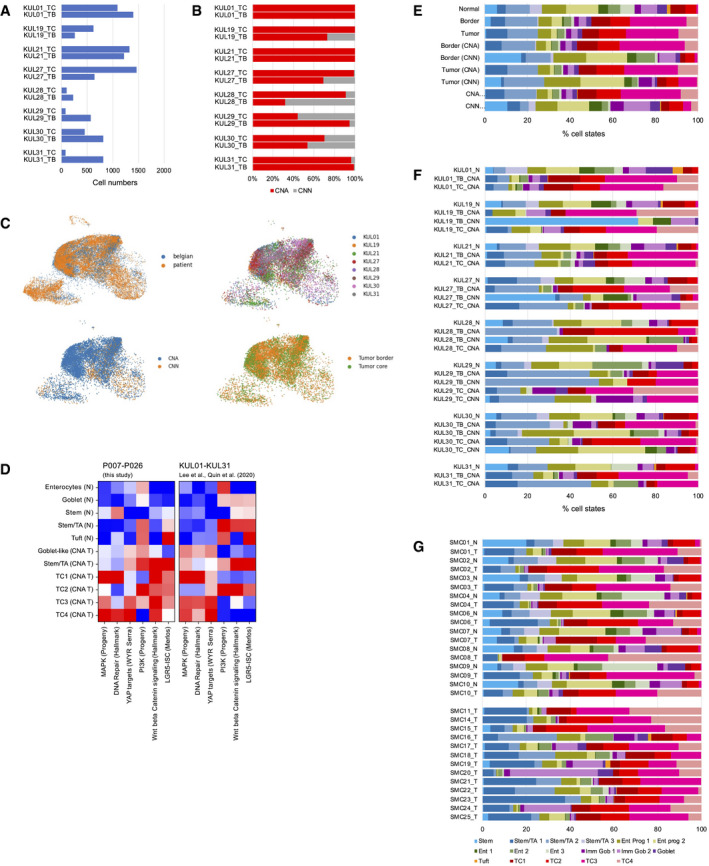
- A–F
Analysis of the KUL01‐KUL31 cohort (Lee et al, ; Qian et al, 2020). (A) Epithelial cell numbers per sample retrieved by our analysis pipeline. (B) Copy number calling on tumor border (TB) and tumor center (TC) samples. (C) Distribution of KUL01‐KUM31 transcriptomes on the reference UMAP. Top left: blue: KUL01‐KUL31 transcriptomes. Orange: Transcriptomes from P007‐P026 samples; top right: Distribution of KUL01‐KUM31 transcriptomes, by patient; bottom left: distribution of copy number normal versus aberrant transcriptomes; bottom right: distribution of tumor border versus tumor center transcriptomes. (D) Signature strengths of transcriptome clusters from our study (P007‐P026), compared to KUL01‐KUL31 transcriptome clusters after imputation. (E) Cell state distribution in the KUL01‐KUL31 cohort, by category. (F) Cell state distribution in the KUL01‐KUL31 cohort, by sample.
- G
Cell state distribution in the SMC01‐SMC25 cohort (Lee et al, 2020), by sample.
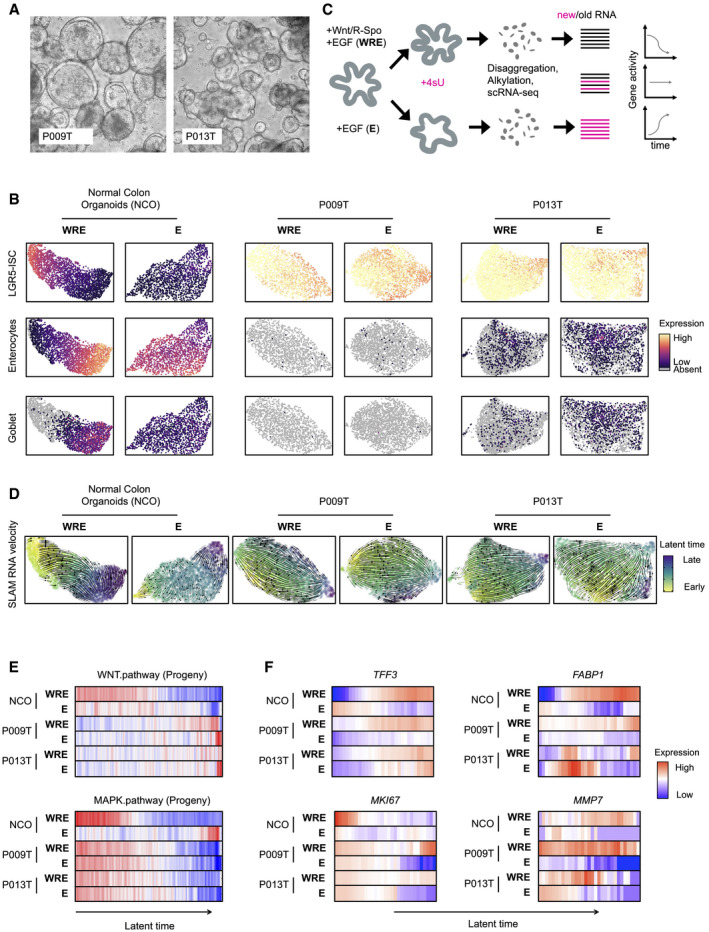
Phenotypes of patient‐derived organoid lines P009T and P013T.
UMAPs of organoid single‐cell transcriptomes. Organoid lines and medium conditions as indicated. LGR5‐ISC stem cell, enterocyte, and Goblet cell signatures are visualized.
Schematic representation of workflow to infer RNA dynamics (“RNA velocity”). In short, organoids were passaged and assigned to different medium conditions. After three days, nascent RNA was metabolically labeled for 2 h using 4sU. Organoids were harvested, dissociated, and fixed. RNA in single cells was alkylated, and cells were subjected to single‐cell sequencing. Reads were assigned to nascent or old RNA status, depending on diagnostic T‐C mutational status.
Developmental trajectories inferred from RNA metabolic labeling. Bold and thin arrows indicate high versus low directionality of RNA velocity. Colors below RNA velocity show latent time (yellow: early latent time; blue: late latent time).
Activities of Wnt/β‐catenin and MAPK target genes in organoid single‐cell transcriptomes, ordered along latent time.
Activities of TFF3, FABP1, MKI67, and MMP7 in organoid single‐cell transcriptomes, ordered along latent time.
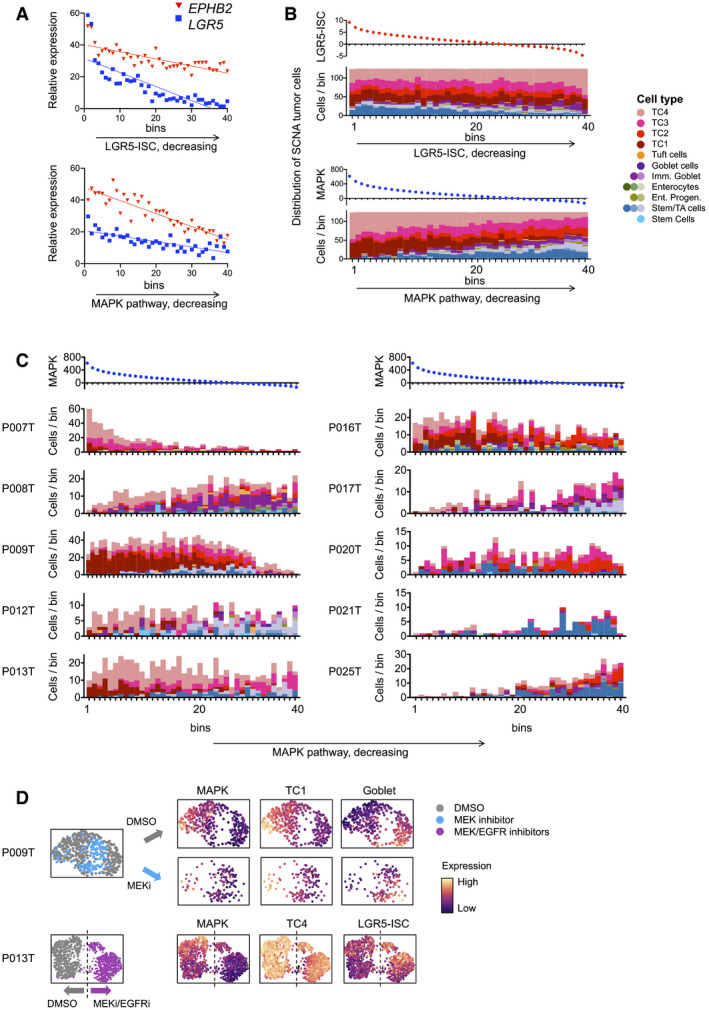
Gene expression of LGR5 and EPHB2, along activity gradients of LGR5‐ISC or MAPK target gene signatures.
Cell state distribution of SCN‐aberrant CRC cells along gradients of LGR5‐ISC or MAPK transcriptional signatures, as in A.
Cell state distribution of SCN‐aberrant CRC tumor cells along MAPK signature activity, as in B, per tumor. Correlation between cell state distributions and MAPK target gene was calculated using Pearson’s r. For correlations and significances, see Table EV6. Color code as in Fig 4B.
UMAP representations of single‐cell transcriptomes derived from P009T or P013T organoids, after MAPK blockade using MEK or combined MEK and EGFR inhibition. Color codes are treatment conditions or expression strength of signature, as indicated. Dashed line in P013T UMAP roughly separates control (DMSO) and MEK/EGFR inhibitor‐treated cells.
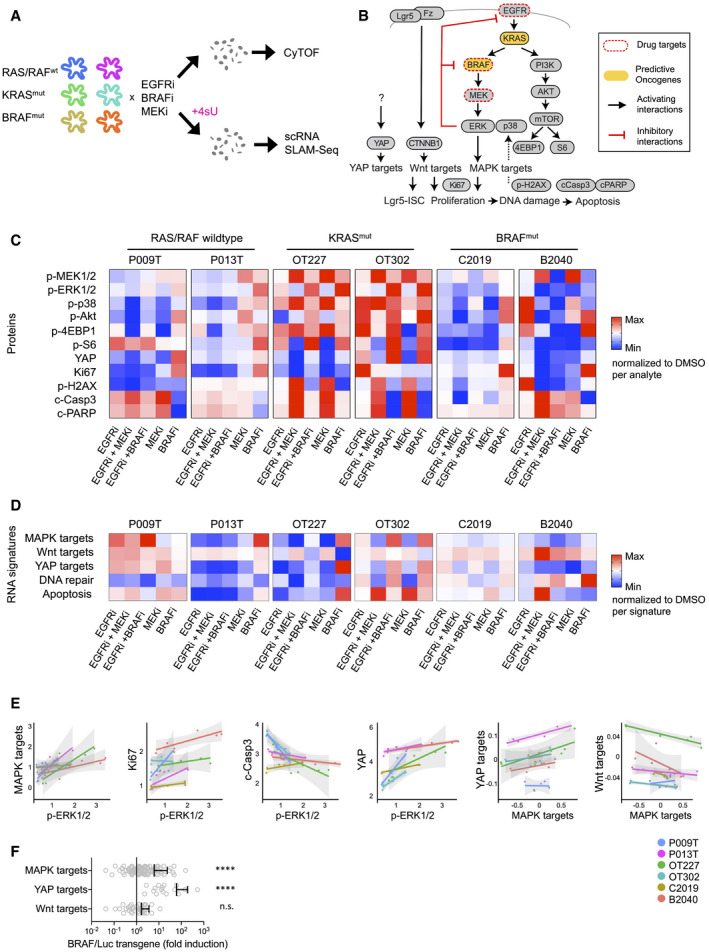
Workflow of the experimental therapy experiment. In short, organoids were treated for 48 h with inhibitors before disaggregation into single cells for CyTOF and scRNA‐seq analysis. For scRNA‐seq, organoids were labeled for 2 h with 4sU.
Schematic representation of signaling network and transcriptional signatures associated with phenotypes or signaling pathways, as indicated.
Heatmap of key CyTOF data. Average activities of selected analytes are given as log fold change after normalization to DMSO control condition. Range of color scale was adjusted for each analyte. For relative changes between all analytes, see Appendix Fig S7).
Heatmap of signature gene expression, from scRNA‐seq data. Average activities of selected gene signatures are given as log fold change after normalization to DMSO control condition. Range of color scale was adjusted for each signature. DNA repair and Apoptosis are Broad Institute Hallmark signatures.
Correlations between and within the CyTOF and scRNA‐seq datasets. For each line, average protein analyte (CyTOF) or transcriptional signature (scRNA‐seq) values were plotted for all six experimental conditions. Graphs give trend line and confidence intervals.
Upregulation of MAPK and YAP target genes in mouse intestinal organoids after induction of oncogenic BRAF. Wnt target genes are not significantly affected. For experimental details, see Riemer et al (2015). Graph displays data points for signature gene expression values, mean and standard deviation. ****indicates P‐value of < 0.0001 in two‐tailed paired t‐test of gene expression ratios (luciferase control versus BRAF‐induced). n.s.: not significant.
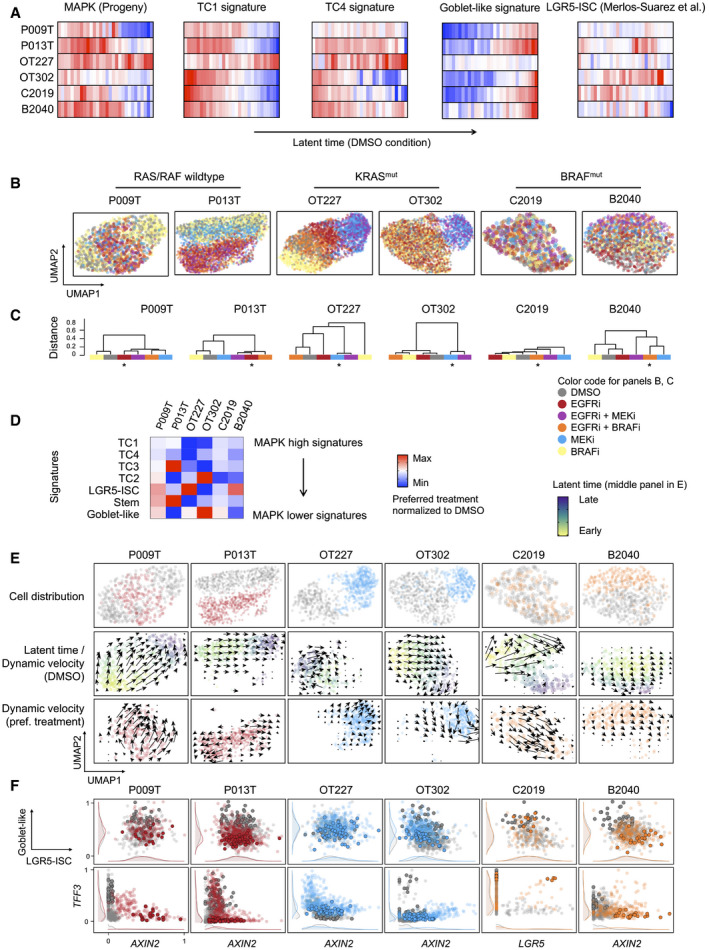
Activities of gene expression signatures, as indicated, in single‐cell transcriptomes from control (DMSO) condition CRC organoids, ordered along latent time. Correlation between cell state distributions and latent time was calculated using Pearson’s r. For correlations and significances, see Table EV6. Color code red: high activity; blue: low activity.
UMAPs of organoid single‐cell transcriptomes, color‐coded by treatment conditions, as indicated.
Dendrograms of transcriptome similarities across treatment conditions, per organoid line. Height of dendrogram is obtained by hierarchical clustering on the overlap of KNN neighborhoods across conditions. Preferred treatment conditions are marked by asterisk.
Heatmap of signature gene expression, from scRNA‐seq data. Average activities of gene signatures are given as log fold change for preferred treatment condition, after normalization to DMSO control condition. Range of color scale was adjusted for each signature.
RNA velocity analysis of organoids under DMSO and preferred treatment conditions. Latent time is given as color code in the control (DMSO) condition UMAP, dynamical velocities are displayed as arrows.
Scaled signature expression and single gene expression moments per cell, under control (gray) and preferred treatment (color) conditions, as indicated. 10% of cells populating the end of latent time are displayed in bold. It is of note that latent time is linear and thus cannot capture multiple populations located at developmental end points. Densities at the sidelines display expression in all cells.
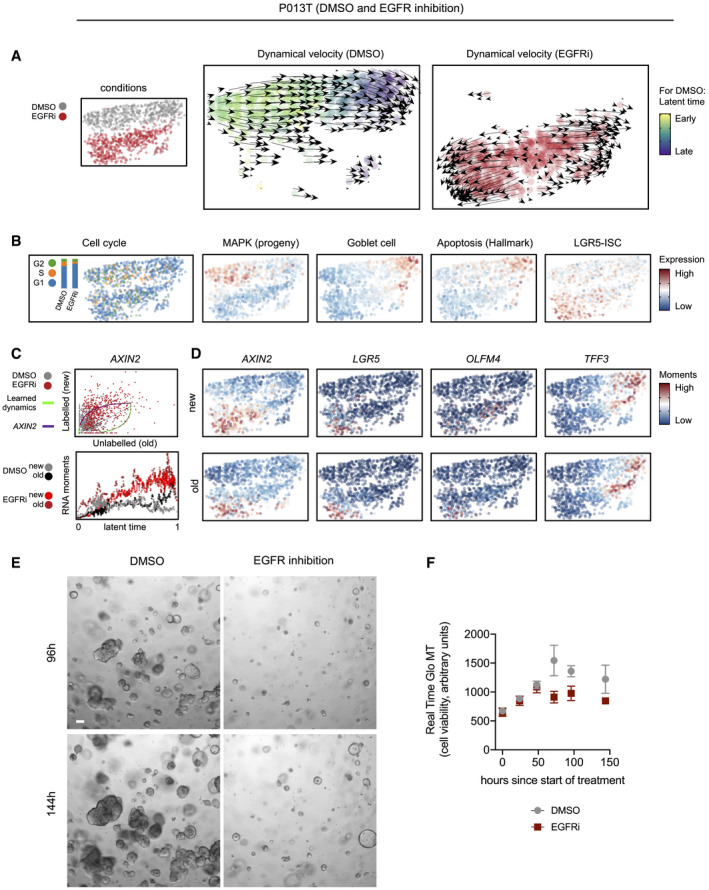
- A
UMAPs and dynamical velocity maps of the two conditions (DMSO versus EGFR inhibition), color‐coded by condition or latent time, as indicated. Latent time cannot be defined for EGFR inhibited cells showing divergent trajectories.
- B
UMAPs of the two conditions, color‐coded by cell cycle phase or activities of selected gene expression signatures, as indicated.
- C
Phase plot and latent time RNA moments for AXIN2.
- D
UMAPs of the two conditions, color‐coded by gene‐specific expression moments.
- E, F
Organoid culture of P013T organoids reveals outgrowth of EGFR‐resistant cells. (E) Phenotypes of DMSO control and EGFR‐treated P013T cultures after 96 and 144 h, as indicated. Organoids growing under EGFR inhibition show a distinct spheroidal phenotype. Scale bar 100 µm (F) Metabolic cell viability of DMSO control and EGFR inhibitor‐treated P013T cultures. Graph displays mean and standard deviation of triplicate assays.
References
-
- Amado RG, Wolf M, Peeters M, Van Cutsem E, Siena S, Freeman DJ, Juan T, Sikorski R, Suggs S, Radinsky R et al (2008) Wild‐type KRAS is required for panitumumab efficacy in patients with metastatic colorectal cancer. J Clin Oncol 26: 1626–1634 - PubMed
-
- Becker WR, Nevins SA, Chen DC, Chiu R, Horning A, Laquindanum R, Mills M, Chaib H, Ladabaum U, Longacre T et al (2021) Single‐cell analyses reveal a continuum of cell state and composition changes in the malignant transformation of polyps to colorectal cancer. bioRxiv 10.1101/2021.03.24.436532 [PREPRINT] - DOI - PMC - PubMed
-
- Bergen V, Lange M, Peidli S, Wolf FA, Theis FJ (2020) Generalizing RNA velocity to transient cell states through dynamical modeling. Nat Biotechnol 38: 1408–1414 - PubMed
Publication types
MeSH terms
Substances
Associated data
- Actions
- Actions
LinkOut - more resources
Full Text Sources
Medical
Molecular Biology Databases
Research Materials
Miscellaneous
