. 2021 Dec 4;72(22):7970-7983.
doi: 10.1093/jxb/erab380.

Characterization of growth and development of sorghum genotypes with differential susceptibility to Striga hermonthica

Affiliations

Characterization of growth and development of sorghum genotypes with differential susceptibility to Striga hermonthica

Dorota Kawa et al. J Exp Bot. .

Abstract

Two sorghum varieties, Shanqui Red (SQR) and SRN39, have distinct levels of susceptibility to the parasitic weed Striga hermonthica, which have been attributed to different strigolactone composition within their root exudates. Root exudates of the Striga-susceptible variety Shanqui Red (SQR) contain primarily 5-deoxystrigol, which has a high efficiency for inducing Striga germination. SRN39 roots primarily exude orobanchol, leading to reduced Striga germination and making this variety resistant to Striga. The structural diversity in exuded strigolactones is determined by a polymorphism in the LOW GERMINATION STIMULANT 1 (LGS1) locus. Yet, the genetic diversity between SQR and SRN39 is broad and has not been addressed in terms of growth and development. Here, we demonstrate additional differences between SQR and SRN39 by phenotypic and molecular characterization. A suite of genes related to metabolism was differentially expressed between SQR and SRN39. Increased levels of gibberellin precursors in SRN39 were accompanied by slower growth rate and developmental delay and we observed an overall increased SRN39 biomass. The slow-down in growth and differences in transcriptome profiles of SRN39 were strongly associated with plant age. Additionally, enhanced lateral root growth was observed in SRN39 and three additional genotypes exuding primarily orobanchol. In summary, we demonstrate that the differences between SQR and SRN39 reach further than the changes in strigolactone profile in the root exudate and translate into alterations in growth and development.

Keywords: Striga hermonthica; Developmental delay; gibberellins; lateral root; metabolism; root system architecture; sorghum; strigolactone.


Figures

Fig. 1.
Fig. 1.
Transcriptome profiles of roots of Shanqui Red (SQR) and SRN39. (A) Multidimensional scaling plot of samples based on their transcript abundances (log2 counts per million, CPM). Gray, SQR; orange, SRN39; circles, 28 d old; triangles, 35 d old. (B, C) Six clusters of genes affected by a genotype in a time-dependent and -independent manner (B) and corresponding expression patterns (C). Values presented are log2CPM scaled to the mean expression across all samples. (D) Biological processes enriched in each cluster. The color of the bar indicates the P-value of the enrichment (at P<0.05 threshold). Root transcriptomes of four biological replicates were sequenced per genotype at each time point.
Fig. 2.
Fig. 2.
Metabolome profiles of roots of Shanqui Red (SQR) and SRN39. (A) Principal component analysis of samples based on their metabolite abundance. Gray, SQR; orange, SRN39; circles, 28 d old; triangles, 35 d old. (B, C) Pathway enrichment analysis of metabolites differentially accumulated between genotypes at 28-day-old (B) and 35-day-old (C) stage. The color of the bar indicates the adjusted P-value of the enrichment (at the 0.05 threshold), while the x-axis indicates the proportion of the metabolites in each pathway that were found to be differentially accumulated in SRN39 as compared with SQR. (E–K) Abundance of gibberellin biosynthesis intermediates: metabolic features predicted to be ent-kaur-16-en-19-oate (D, E), ent-7α-hydroxykaur-16-en-19-oate (F), gibberellin A12-aldehyde (G), and gibberellin A12 (H); suberin intermediates: trans-cinnamate (I) and ferulate (J); and abscisic acid (K). Data in (D–J) present metabolite levels in roots of 28-day-old plants, those in (K) of 35-day-old plants. The boxplots denote data spanning from the 25th to the 75th percentile and are centered on the data median. Circles represent individual values. Asterisks denote a significant adjusted P-value for differences between genotypes by Student’s t-test. *P< 0.05, **P<0.01, ***P<0.001 (n=6).
Fig. 3.
Fig. 3.
Root system architecture of Shanqui Red (SQR) and SRN39. In all cases the x-axis denotes days post-germination (dpg). (A–E) SRN39, orange; SQR, gray. (A) Main root length, (B) main root angle, (C) lateral root density, (D) lateral root length, (E) total root size. The boxplots denote data spanning the 25th to the 75th percentile and are centered on the data median. Circles represent individual values. Asterisks denote a significant P-value for each time point between genotypes by the least square method. *P< 0.05, **P<0.01, ***P<0.001 (n=10).
Fig. 4.
Fig. 4.
Root system architecture and root exudate strigolactone composition of Shanqui Red (SQR) and sorghum varieties with the lgs1 mutation (Birham, Framida, Gobiye, and SRN39). (A) Main root length, (B) lateral root length, (C) total root size of 7-day-old seedlings. The boxplots denote data spanning the 25th to the 75th percentile and are centered on the data median. Circles represent individual values. Asterisks denote a significant P-value for each time point between genotypes by the least square method. *P< 0.05, ***P<0.001 (n=4). (D) Relative abundance (percentage of total strigolactones (SL) measured) of four strigolactones in root exudates of 14-day-old plants (n=6). The abundance of individual strigolactones is presented in Supplementary Fig. S5.
Fig. 5.
Fig. 5.
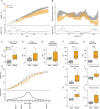
Vegetative growth of SRN39 and Shanqui Red (SQR). (A) Plant height from day 4 to 74. (B) Increase in plant height per plant height calculated with a sliding window of 30 cm. Data presented include the mean (solid line) and the 95% confidence interval (shaded). The bottom panel denotes the −log10(P-value) at each time point (Welch’s t-test). The dashed line indicates a P-value of 0.05. (C–G) Time required to reach stage 1 (three-leaf stage), (C) stage 2 (five-leaf stage) (D), stage 3 (growing point differentiation) (E), stage 4 (flag leaf visible) (F), stage 5 (boot stage) (G). An asterisk denotes the P-value from a Wilcoxon test. (H) Plant height at individual leaf stages. The mean is represented by a solid line, while the 95% confidence interval is shaded. The bottom panel denotes the −log10(P-value) per leaf stage as a result of pairwise genotype comparisons using the least square method. (I–L) Dry weight of root (I), stalk (J), leaves (K), and ratio of root to shoot dry weight (L). Boxplots denote the span from the 25th to the 75th percentile and are centered to the data median. Circles represent individual values. Asterisk denotes P-value from Welch t-test. *P< 0.05, **P<0.01, ***P<0.001 (n=10).

References

    1. Adusumilli R, Mallick P. 2017. Data conversion with ProteoWizard msConvert. Methods in Molecular Biology 1550, 339–368. - PubMed
    1. Akiyama K, Matsuzaki K, Hayashi H. 2005. Plant sesquiterpenes induce hyphal branching in arbuscular mycorrhizal fungi. Nature 435, 824–827. - PubMed
    1. Amusan IO, Rich PJ, Housley T, Ejeta G. 2011. An in vitro method for identifying postattachment Striga resistance in maize and sorghum. Agronomy Journal 103, 1472–1478.
    1. Andersen TG, Barberon M, Geldner N. 2015. Suberization – the second life of an endodermal cell. Current Opinion in Plant Biology 28, 9–15. - PubMed
    1. Aquino B, Bradley JM, Lumba S. 2021. On the outside looking in: roles of endogenous and exogenous strigolactones. The Plant Journal 105, 322–334. - PubMed

Publication types