. 2022 Feb;44(1):173-194.
doi: 10.1007/s11357-021-00408-z. Epub 2021 Aug 19.

Accumulation of C-terminal cleaved tau is distinctly associated with cognitive deficits, synaptic plasticity impairment, and neurodegeneration in aged mice

Affiliations

Accumulation of C-terminal cleaved tau is distinctly associated with cognitive deficits, synaptic plasticity impairment, and neurodegeneration in aged mice

Anjanet Loon et al. Geroscience. 2022 Feb.

Abstract

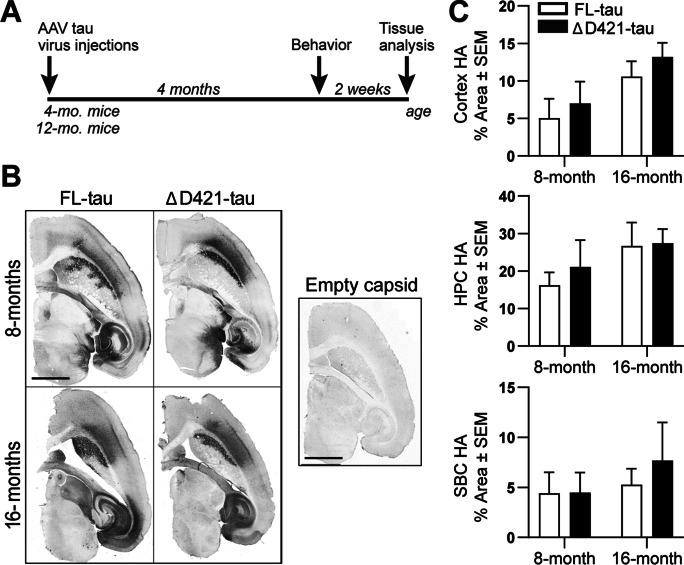
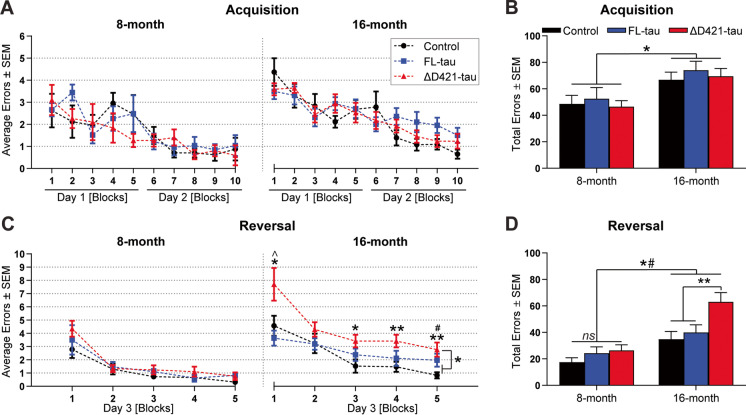
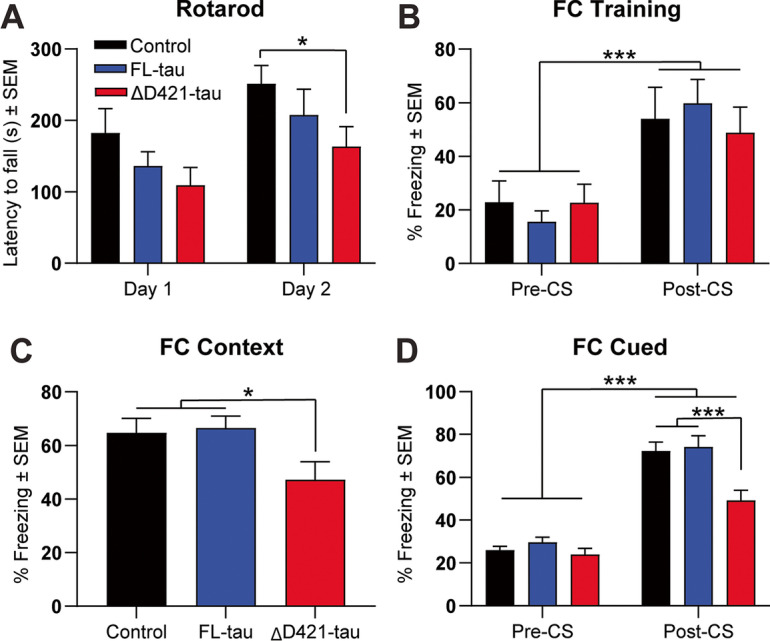
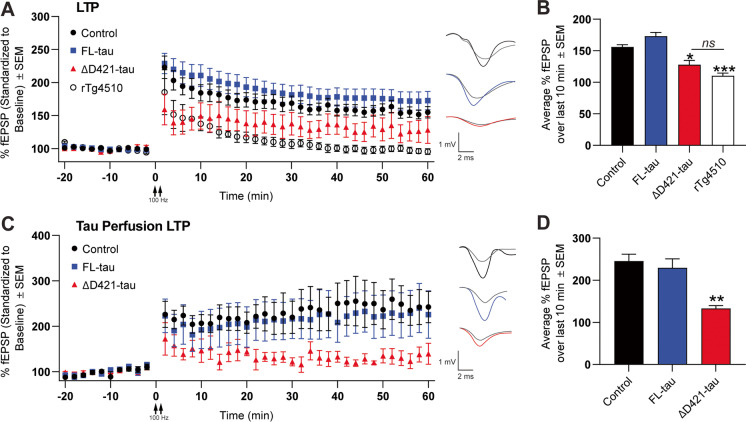
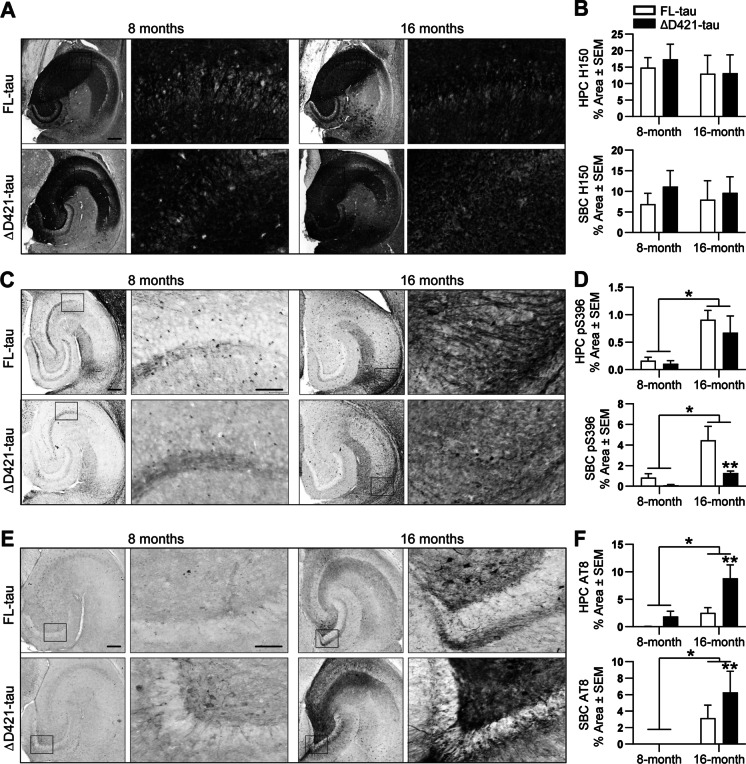
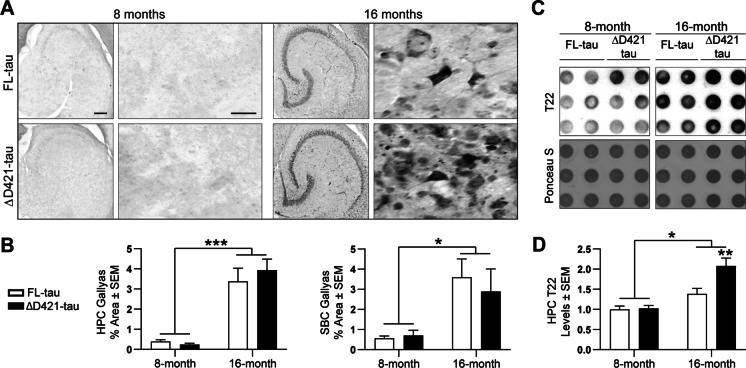
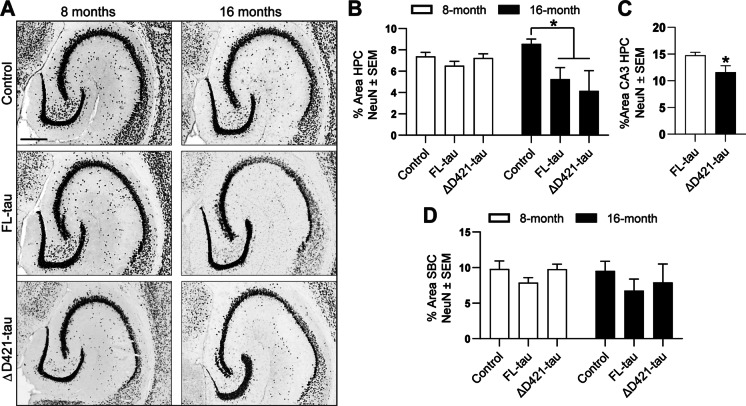
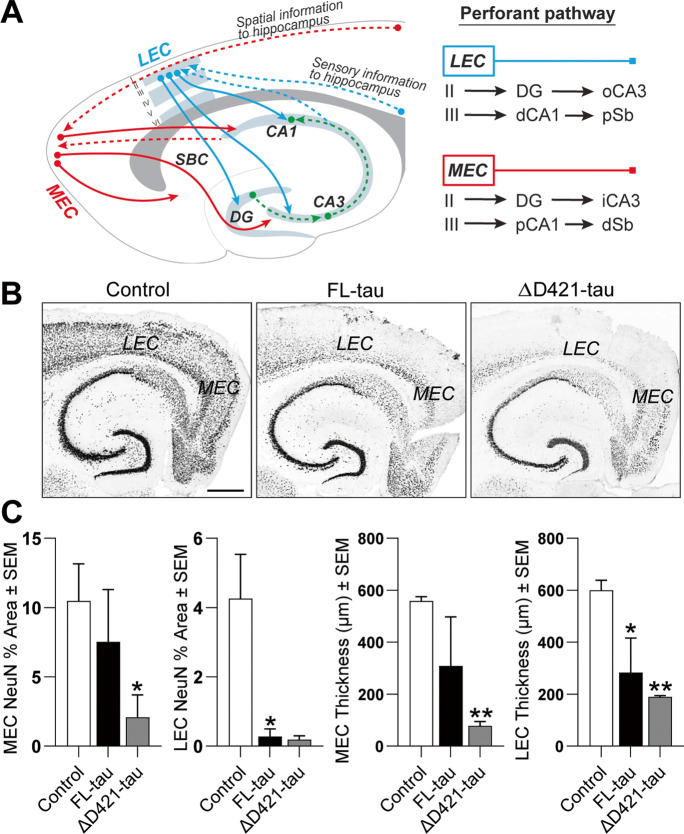
C-terminal cleaved tau at D421 (∆D421-tau) accumulates in the brains of Alzheimer's disease (AD) patients. However, it is unclear how tau truncation, an understudied tau post-translational modification, contributes to AD pathology and progression. Utilizing an adeno-associated virus (AAV) gene delivery-based approach, we overexpressed full-length tau (FL-tau) and ∆D421-tau in 4- and 12-month-old mice for 4 months to study the neuropathological impact of accumulation in young adult (8-month) and middle-aged (16-month) mice. Overall, we show that independent of the tau species, age was an important factor facilitating tau phosphorylation, oligomer formation, and deposition into silver-positive tangles. However, mice overexpressing ∆D421-tau exhibited a distinct phosphorylation profile to those overexpressing FL-tau and increased tau oligomerization in the middle-age group. Importantly, overexpression of ∆D421-tau, but not FL-tau in middle-aged mice, resulted in pronounced cognitive impairments and hippocampal long-term potentiation deficits. While both FL-tau and ∆D421-tau induced neuronal loss in mice with age, ∆D421-tau led to significant neuronal loss in the CA3 area of the hippocampus and medial entorhinal cortex compared to FL-tau. Based on our data, we conclude that age increases the susceptibility to neuronal degeneration associated with ΔD421-tau accumulation. Our findings suggest that ΔD421-tau accumulation contributes to synaptic plasticity and cognitive deficits, thus representing a potential target for tau-associated pathologies.

Keywords: Age; Cognition; Entorhinal cortex; Full-length tau; LTP; Neurodegeneration; Tauopathy; Truncated tau.


Conflict of interest statement

The authors declare no competing interests.

Figures

Fig. 1
Fig. 1
Transgene expression in FL-tau and ∆D421-tau mice. A AAV viral in vivo tau gene transfer in 4- and 12-month-old wt mice for 4 months was followed by behavior testing. B Immunohistochemical staining of brain tissue for hemagglutinin (HA) expression. C Quantification of percent positive area in HA immunoreactivity in the cortex (CX), hippocampus (HPC), and subiculum (SBC) with age. Statistical analyses were performed by two-way ANOVA followed by Tukey post-hoc test (n = 7–8 animal/group). Scale bar represents 2000 µm
Fig. 2
Fig. 2
ΔD421-tau, but not FL-tau, overexpression in the middle-aged mouse brain results in impairment of spatial memory performance. A The average number of errors per block for the radial arm water maze (RAWM) in young adult and middle-aged cohorts. B The total number of errors performed in the RAWM in the young adult and middle-aged cohorts. Statistics were performed by two-way ANOVA followed by Fisher’s least significant difference (LSD) post-hoc test (n = 8–10 for the 8-month-old and n = 15–17 for the 16-month-old group, *p < 0.05). C The average number of errors per block for the RAWM reversal in young adult and middle-aged cohorts. Statistical analyses were carried out by two-way ANOVA followed by Fisher’s least significance different (LSD) post-hoc test (n = 8–10 for young adult and n = 15–17 for middle-aged group, *p < 0.05 and **p < 0.01 between aged control and ∆D421-tau, ^p < 0.05 between aged FL-tau and ∆D421-tau, #p < 0.05 between aged control and FL-tau). D The total number of errors across all trials in the RAWM reversal in the young adult and middle-aged cohorts. Statistics were performed by two-way ANOVA followed by Fisher’s least significant difference (LSD) post-hoc test (n = 8–10 for the young adult and n = 15–17 for the middle-aged group, *p < 0.05 between all 8-month-old treatment groups and 16-month-old control and FL-tau, **p < 0.01, #p < 0.001 between all 8-month-old treatment groups and 16-month-old ∆D421-tau)
Fig. 3
Fig. 3
ΔD421-tau, but not FL-tau, overexpression in the middle-aged mouse brain results in deficits in the rotarod and fear conditioning. A Latency to fall in the rotarod in days 1 and 2. Statistical analysis was performed by two-way ANOVA followed by Fisher’s least significant difference (LSD) post-hoc test (n = 7–9, *p < 0.05). B Percent freezing measured in fear conditioning (FC) training before (pre-CS) and after (post-CS) a conditioned stimulus (tone) paired with foot shocks. Statistical analysis was performed by two-way ANOVA followed by Fisher’s least significant difference (LSD) post-hoc test (n = 7–9, ***p < 0.001). C Percent freezing measured 24 h after fear conditioning (FC) training in the same context without an auditory cue. Statistical analysis was performed by one-way ANOVA followed by Fisher’s least significant difference (LSD) post-hoc test (n = 7–9, *p < 0.05). (D) Percent freezing measured twenty-four hours after fear conditioning (FC) training in a different context before (pre-CS) and after (post-CS) a conditioned stimulus (cued tone). Statistical analysis was performed by two-way ANOVA followed by Fisher’s least significant difference (LSD) post-hoc test (n = 7–9, ***p < 0.001)
Fig. 4
Fig. 4
ΔD421-tau attenuates hippocampal late long-term potentiation (LTP) in middle-aged mice. A Attenuated LTP in the hippocampus of middle-aged FL-tau (blue) and ΔD421-tau (red) mice compared with control (black). Hippocampal slices from the transgenic rTg4510 mouse model were used as positive control. B Representative fEPSPs recorded in the last 10 min are graphed. Statistical analysis was performed by one-way ANOVA followed by Tukey post-hoc test (n = 4 animal/group, *p < 0.05, **p < 0.01). C Impaired LTP induction in middle-aged hippocampal slices perfused with recombinant ∆D421-tau compared with slices perfused with FL-tau or control. D Representative fEPSPs recorded in the last 10 min are graphed. Statistical analysis was performed by one-way ANOVA followed by Tukey post-hoc test (n = 4 animal/group, **p < 0.01)
Fig. 5
Fig. 5
Differential immunohistochemical phosphorylation profile of FL-tau and ΔD421-tau with age. A Immunohistochemical staining of brain tissue for total tau (H150) in the HPC of young adult and middle-aged FL-tau and ΔD421-tau mice. B Quantification of percent positive area in the HPC and SBC of young adult and middle-aged FL-Tau- and ΔD421-tau-injected mice. Statistical analyses were performed by two-way ANOVA followed by Tukey post-hoc test (n = 7–8 animal/group). C Immunohistochemical staining of brain tissue for phosphorylated S396 levels in the HPC of young adult and middle-aged FL-tau and ΔD421-tau mice. D Quantification of percent positive area in HPC and SBC of FL-tau and ΔD421-tau mice. Statistical analyses were carried out by two-way ANOVA followed by Tukey post-hoc test (n = 7–8 animal/group, *p < 0.05, **p < 0.01). E Immunohistochemical staining of brain tissue for phosphorylated S199/Thr205 levels (AT8 antibody). F Quantitative analyses of percent positive area in the HPC and SBC of FL- and ΔD421-tau mice. For each marker, statistical analyses were performed by two-way ANOVA followed by Tukey post-hoc test (n = 7–8 animal/group, *p < 0.05, **p < 0.01). Scale bars represent 200 μm and 20 μm
Fig. 6
Fig. 6
Differential biochemical phosphorylation profile of FL-tau and ΔD421-tau with age. A Representative western blot analysis of the hippocampal RIPA soluble fraction homogenate analyzed for soluble tau levels using total human tau (HT7) and phospho-tau epitopes PHF1 (pS396-404), pS396, AT180 (Thr231), and pS199-202. B Band densitometry analysis of total and phosphorylated tau (72 kDa band) in FL-Tau and ΔD421-tau mice. Statistical analyses were performed by two-way ANOVA followed by Tukey post-hoc test (n = 4 animal/group, #p < 0.05 between young adult FL- and ΔD421-tau mice, &p < 0.05 between young adult and middle-aged treatment-matched group, *p < 0.05 between middle-aged FL- and ΔD421-tau mice). C Formic acid treated hippocampal fraction (detergent insoluble fraction) was probed for HT7 and phospho-tau epitopes pS396, pS262, and pS199-202. (D) Band densitometry analysis in FL-tau and ΔD421-tau mice. For each fraction, statistical analyses were performed by two-way ANOVA followed by Tukey post-hoc test (n = 5 animal/group, #p < 0.05 between young adult FL- and ΔD421-tau mice, &p < 0.05 between young adult and middle-aged treatment-matched group, *p < 0.05 between middle-aged FL- and ΔD421-tau mice)
Fig. 7
Fig. 7
Deposition of FL-tau and ΔD421-tau into silver-positive and oligomeric forms. A The Gallyas histology of the HPC of FL-tau and ΔD421-tau mice. B Quantitative analysis of argyrophilic tau density in the HPC and SBC of FL-tau and ΔD421-tau mice. Statistical analyses were performed by two-way ANOVA with Tukey post-hoc test (n = 7–8 animal/group, *p < 0.05, ***p < 0.001). Scale bars represent 200 μm and 20 μm. C Dot blot analysis of the soluble tau fraction for oligomeric tau levels in the hippocampal homogenate. D Dot blot densitometry analysis of oligomeric tau levels. Statistical analyses were performed by one-way ANOVA with Tukey post-hoc test (n = 6 animal/group, **p < 0.01)
Fig. 8
Fig. 8
Overexpression of FL-tau and ΔD421-tau promotes neuronal degeneration in middle-aged mice. A Micrographs from NeuN stain from the hippocampi of mice receiving AAV9-empty capsid, FL-tau and ΔD421-tau. B Quantification of the NeuN intensity in the HPC of FL-tau and ΔD421-tau mice. Statistical analyses were performed by two-way ANOVA followed by Tukey post-hoc test (n = 7–8 animal/group, *p < 0.05, **p < 0.01, ***p < 0.001. C Quantification of the NeuN intensity in the CA3 region of the HPC of middle-aged FL-tau and ΔD421-tau mice. Statistical analysis was performed by Student’s t-test (n = 7–8 animal/group, *p < 0.05). D Quantification of the NeuN intensity in the SBC of FL-tau and ΔD421-tau mice. Statistical analysis was performed by Student’s t test (n = 7–8 animal/group). Scale bar represents 200 µm
Fig. 9
Fig. 9
FL-tau and ΔD421-tau pathology induces lateral (LEC) and medial entorhinal cortex (MEC) degeneration. A Schematic presentation of the anatomical characteristics of hippocampal-entorhinal trisynaptic perforant pathway. Cortical inputs from LEC and MEC to the hippocampus carry different sensory and spatial information, respectively. B NeuN immunohistochemical detection on brain tissue from middle-aged mice receiving empty capsid (control), FL-tau or ΔD421-tau. C Percent NeuN-positive area and thickness of layer II/III of the LEC and MEC subfields in middle-aged FL-tau and ΔD421-tau mice compared to age-matched empty capsid control group. Statistical analyses were performed by one-way ANOVA followed by Tukey post-hoc test (n = 7–8 animal/group, *p < 0.05, **p < 0.01). LEC, lateral entorhinal cortex; MEC, medial entorhinal cortex, DG, dentate gyrus, oCA3, outer molecular layer of CA3, iCA3, inner molecular layer of CA3, dCA1, distal CA1, pCA1, proximal CA1, dSb, distal subiculum, pSb, proximal subiculum. Scale bar represents 500 µm

Similar articles

Cited by

References

    1. Abisambra J, Jinwal UK, Miyata Y, Rogers J, Blair L, Li X, Seguin SP, Wang L, Jin Y, Bacon J, Brady S, Cockman M, Guidi C, Zhang J, Koren J, Young ZT, Atkins CA, Zhang B, Lawson LY, Weeber EJ, Brodsky JL, Gestwicki JE, Dickey CA. Allosteric heat shock protein 70 inhibitors rapidly rescue synaptic plasticity deficits by reducing aberrant tau. Biol Psychiatry. 2013. 10.1016/j.biopsych.2013.02.027 - PMC - PubMed
    1. Abraha A, Ghoshal N, Gamblin TC, Cryns V, Berry RW, Kuret J, Binder LI. C-terminal inhibition of tau assembly in vitro and in Alzheimer’s disease. J Cell Sci. 2000. 10.1242/jcs.113.21.3737 - PubMed
    1. Adalbert R, Gilley J, Coleman MP. Aβ, tau and ApoE4 in Alzheimer’s disease: the axonal connection. Trends Mol Med. 2007 doi: 10.1016/j.molmed.2007.02.004. - DOI - PubMed
    1. Ahmed Z, Cooper J, Murray TK, Garn K, McNaughton E, Clarke H, Parhizkar S, Ward MA, Cavallini A, Jackson S, Bose S, Clavaguera F, Tolnay M, Lavenir I, Goedert M, Hutton ML, O’Neill MJ. A novel in vivo model of tau propagation with rapid and progressive neurofibrillary tangle pathology: The pattern of spread is determined by connectivity, not proximity. Acta Neuropathol. 2014 doi: 10.1007/s00401-014-1254-6. - DOI - PMC - PubMed
    1. Alamed J, Wilcock DM, Diamond DM, Gordon MN, Morgan D. Two-day radial-arm water maze learning and memory task; robust resolution of amyloid-related memory deficits in transgenic mice. Nat Protoc. 2006 doi: 10.1038/nprot.2006.275. - DOI - PubMed

Publication types