

Editorial
doi: 10.1371/journal.pcbi.1009226.
eCollection 2021 Aug.
Ten simple rules for creating reusable pathway models for computational analysis and visualization
Affiliations
- PMID: 34411100
- PMCID: PMC8375987
- DOI: 10.1371/journal.pcbi.1009226
Item in Clipboard
Editorial
Ten simple rules for creating reusable pathway models for computational analysis and visualization
PLoS Comput Biol.
.
No abstract available
Conflict of interest statement
The authors have declared that no competing interests exist.
Figures
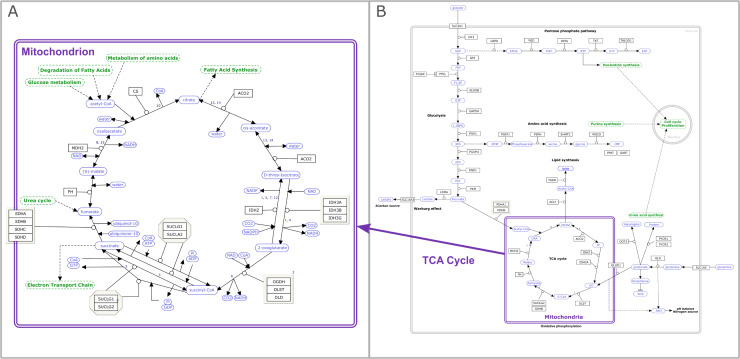
The citric acid cycle (TCA cycle or Krebs cycle) represented as the canonical version (panel A, wikipathways:WP78) [37] and as part of processes involved in metabolic reprogramming in colon cancer (panel B, wikipathways:WP4290) [38]. In the canonical model, each enzymatic step in the cycle is represented in detail, whereas when the same process is represented in the context of colon cancer, specific steps in the cycle are summarized and abstracted at a higher level. Pathway nodes are depicted in green, metabolites in blue, and genes and proteins in black. TCA, tricarboxylic acid.
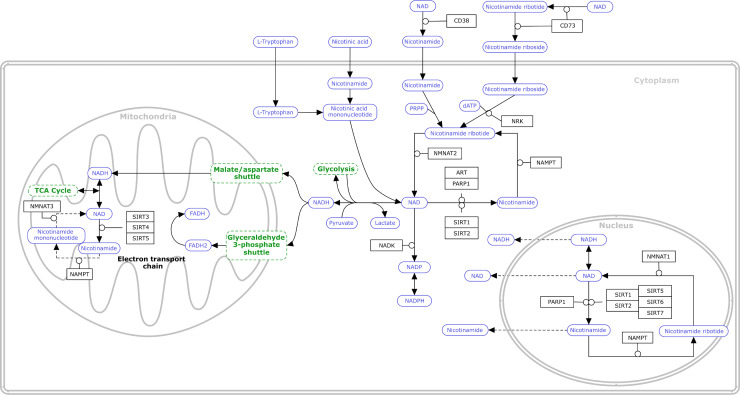
Since one of the most common uses of pathway models is data visualization on nodes, nodes must be adequately sized to allow for efficient data visualization. Accounting for this, node size can then be optimized to the overall size and complexity of the pathway model, utilizing a smaller node size for models with many nodes and a larger node size for sparse models. A consistent representation of different molecular types in terms of size and shape is important, for example, using a specific shape for gene products/proteins and another for metabolites. Any nonstandard nodes or entities should be defined in a legend in the model, as well as in the textual description. NAD+, nicotinamide adenine dinucleotide.
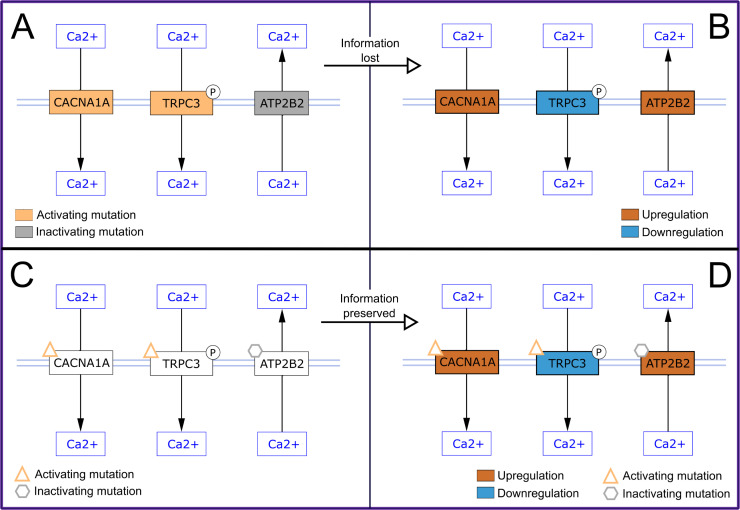
Visualizations of part of the “PKC-gamma calcium signaling pathway in ataxia.” (A) Node fill color is used to describe genes with mutations relevant to ataxia; orange indicates an activating mutation, and gray indicates an inactivating mutation. (B) When experimental data are visualized as node fill color, the mutation information is lost. (C) Mutations are shown as an added graphic to nodes; an orange triangle indicates an activating mutation, and a gray hexagon indicates an inactivating mutation. (D) Data visualization does not interfere with the mutation information, and both data types are visualized. Pathways were visualized in Cytoscape [64]. PKC, protein kinase C.
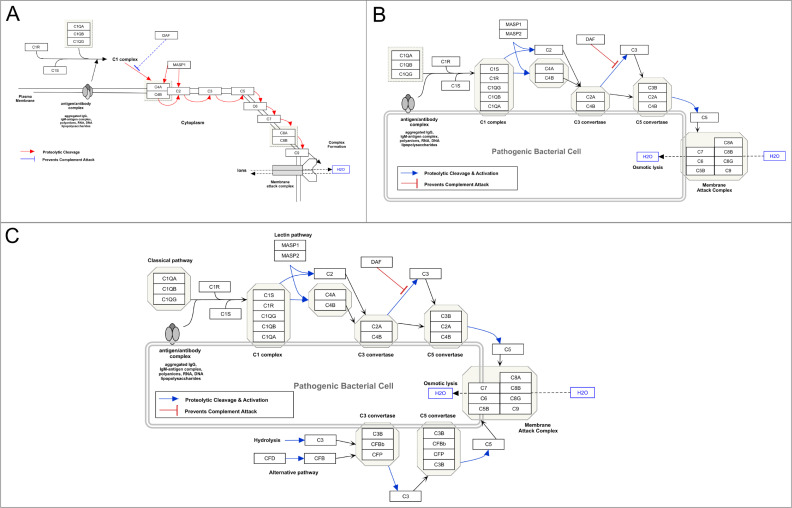
(A) Revision number 63169 as of May 8, 2013 [73]. (B) Revision number 82136 as of September 9, 2015 [74]. (C) Revision number 106816 as of September 17, 2019 [75].
References
Publication types
MeSH terms
LinkOut - more resources
Full Text Sources
