. 2022 Jan;165(1):61-73.
doi: 10.1111/imm.13404. Epub 2021 Aug 31.

IL-33 activates mTORC1 and modulates glycolytic metabolism in CD8+ T cells

Affiliations

IL-33 activates mTORC1 and modulates glycolytic metabolism in CD8+ T cells

Yuejin Liang et al. Immunology. 2022 Jan.

Abstract

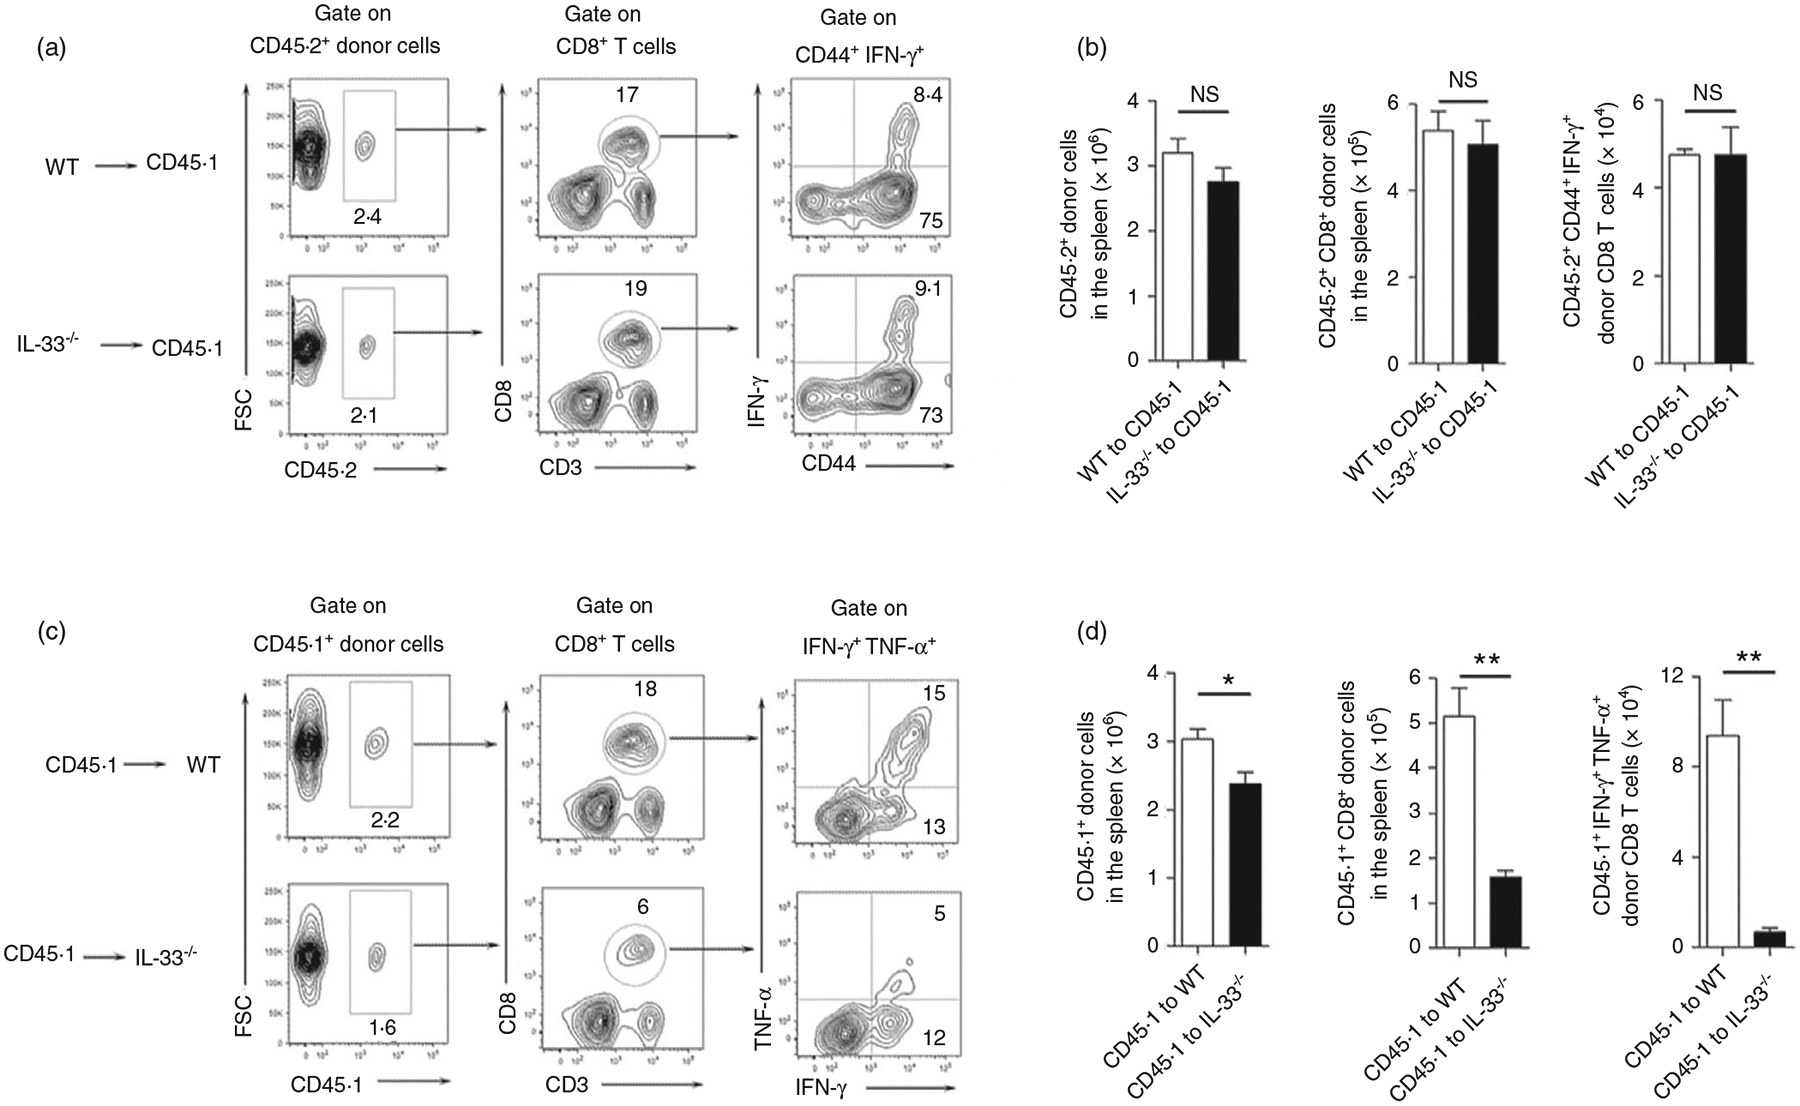
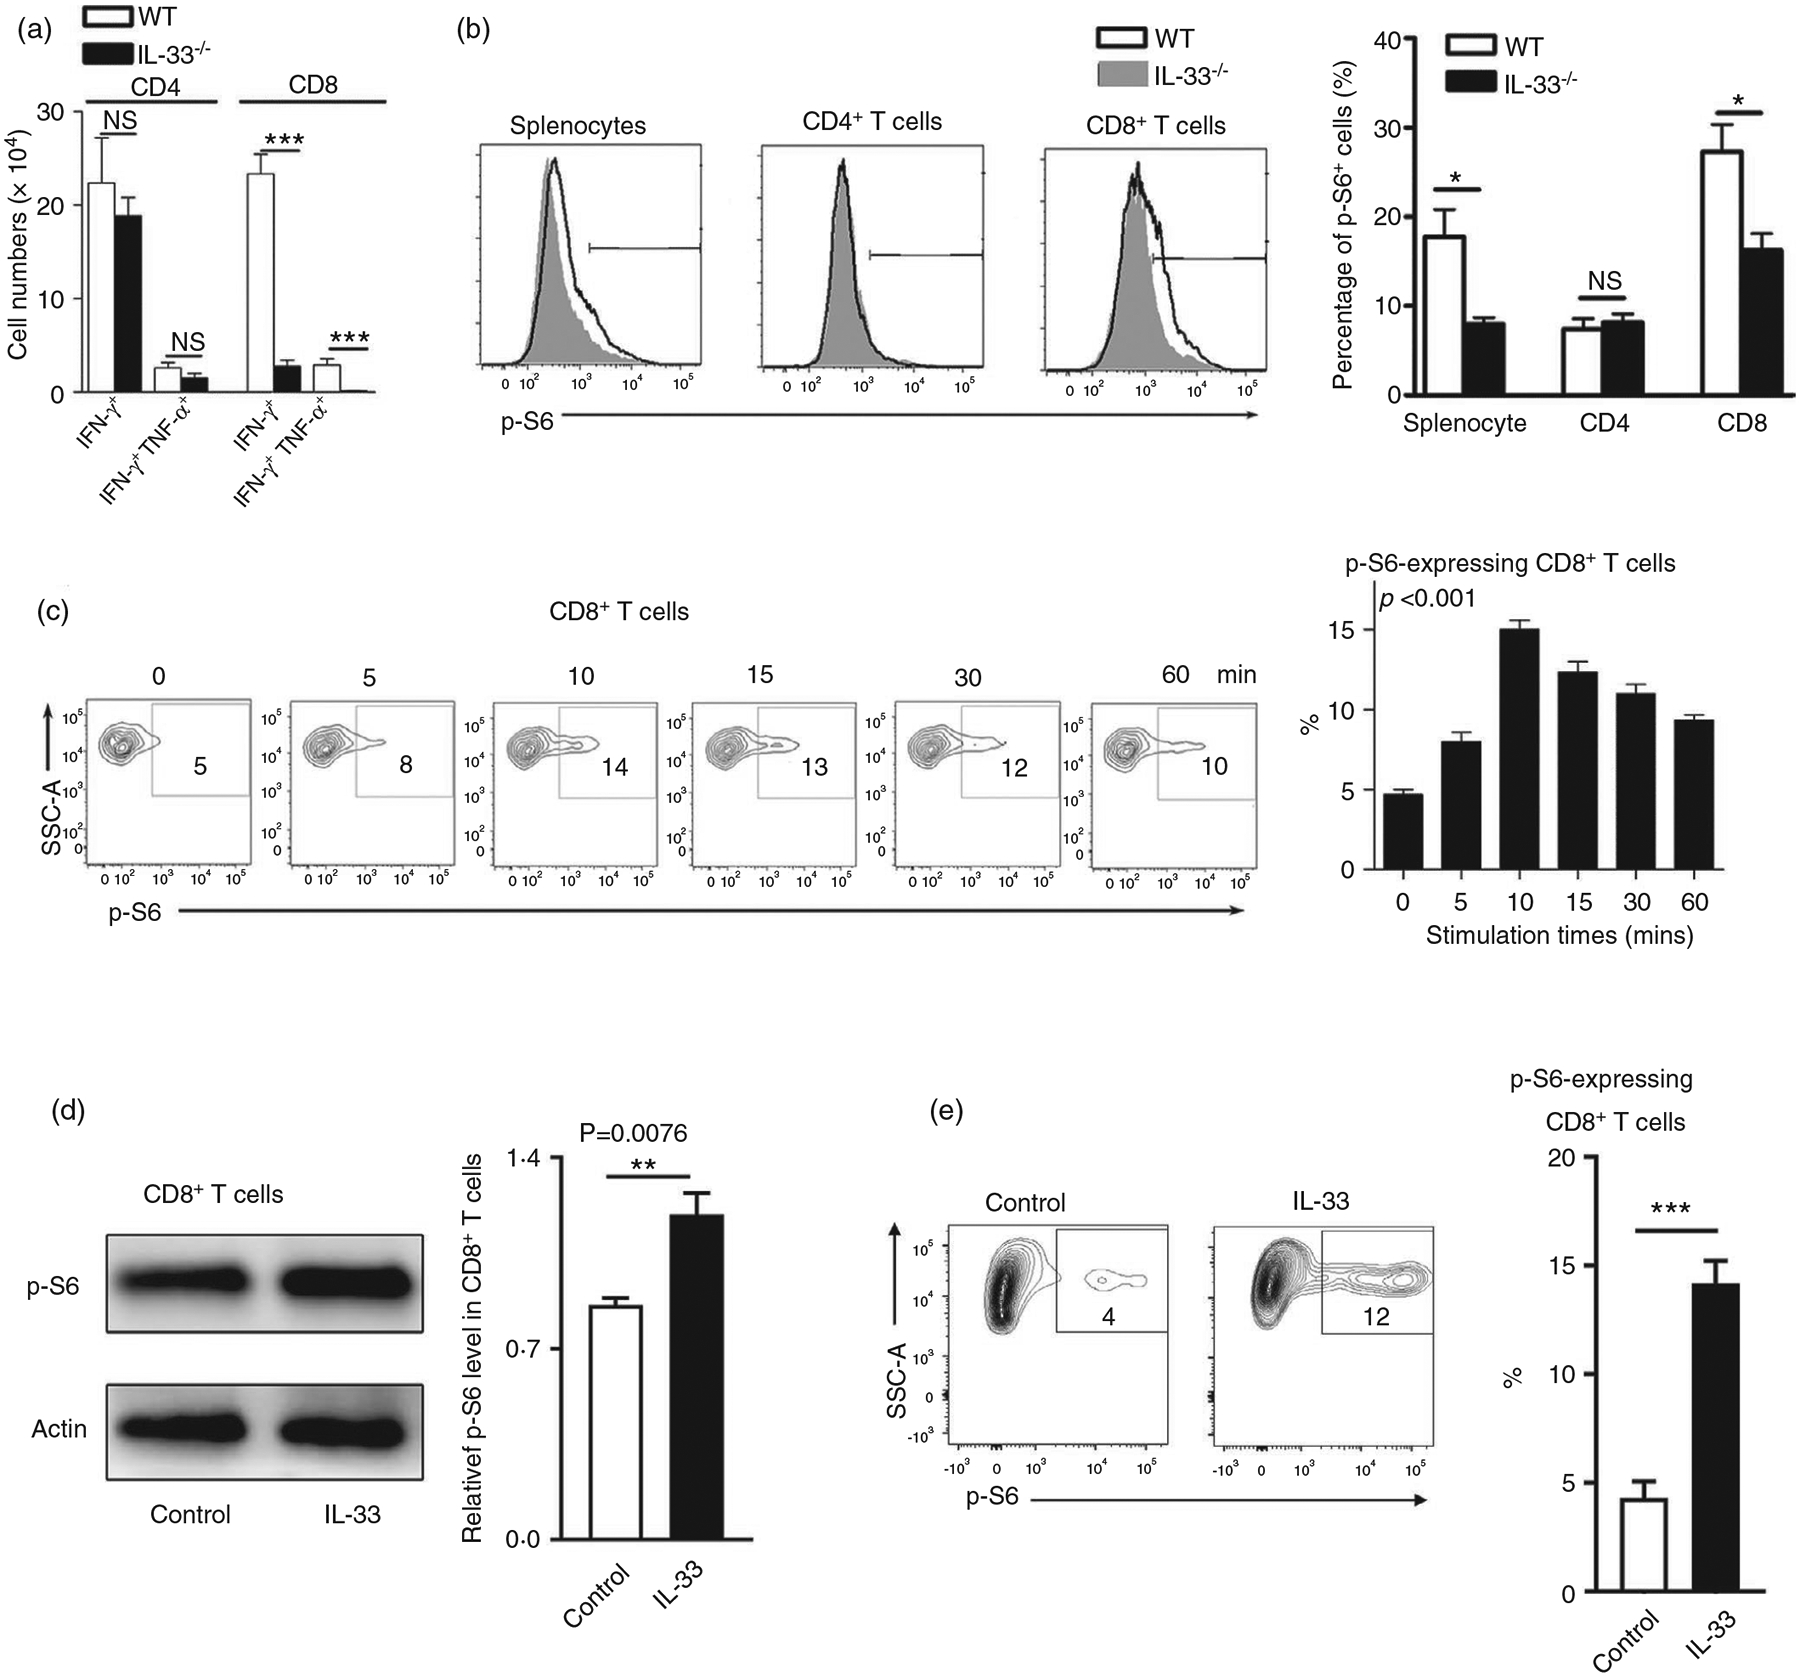
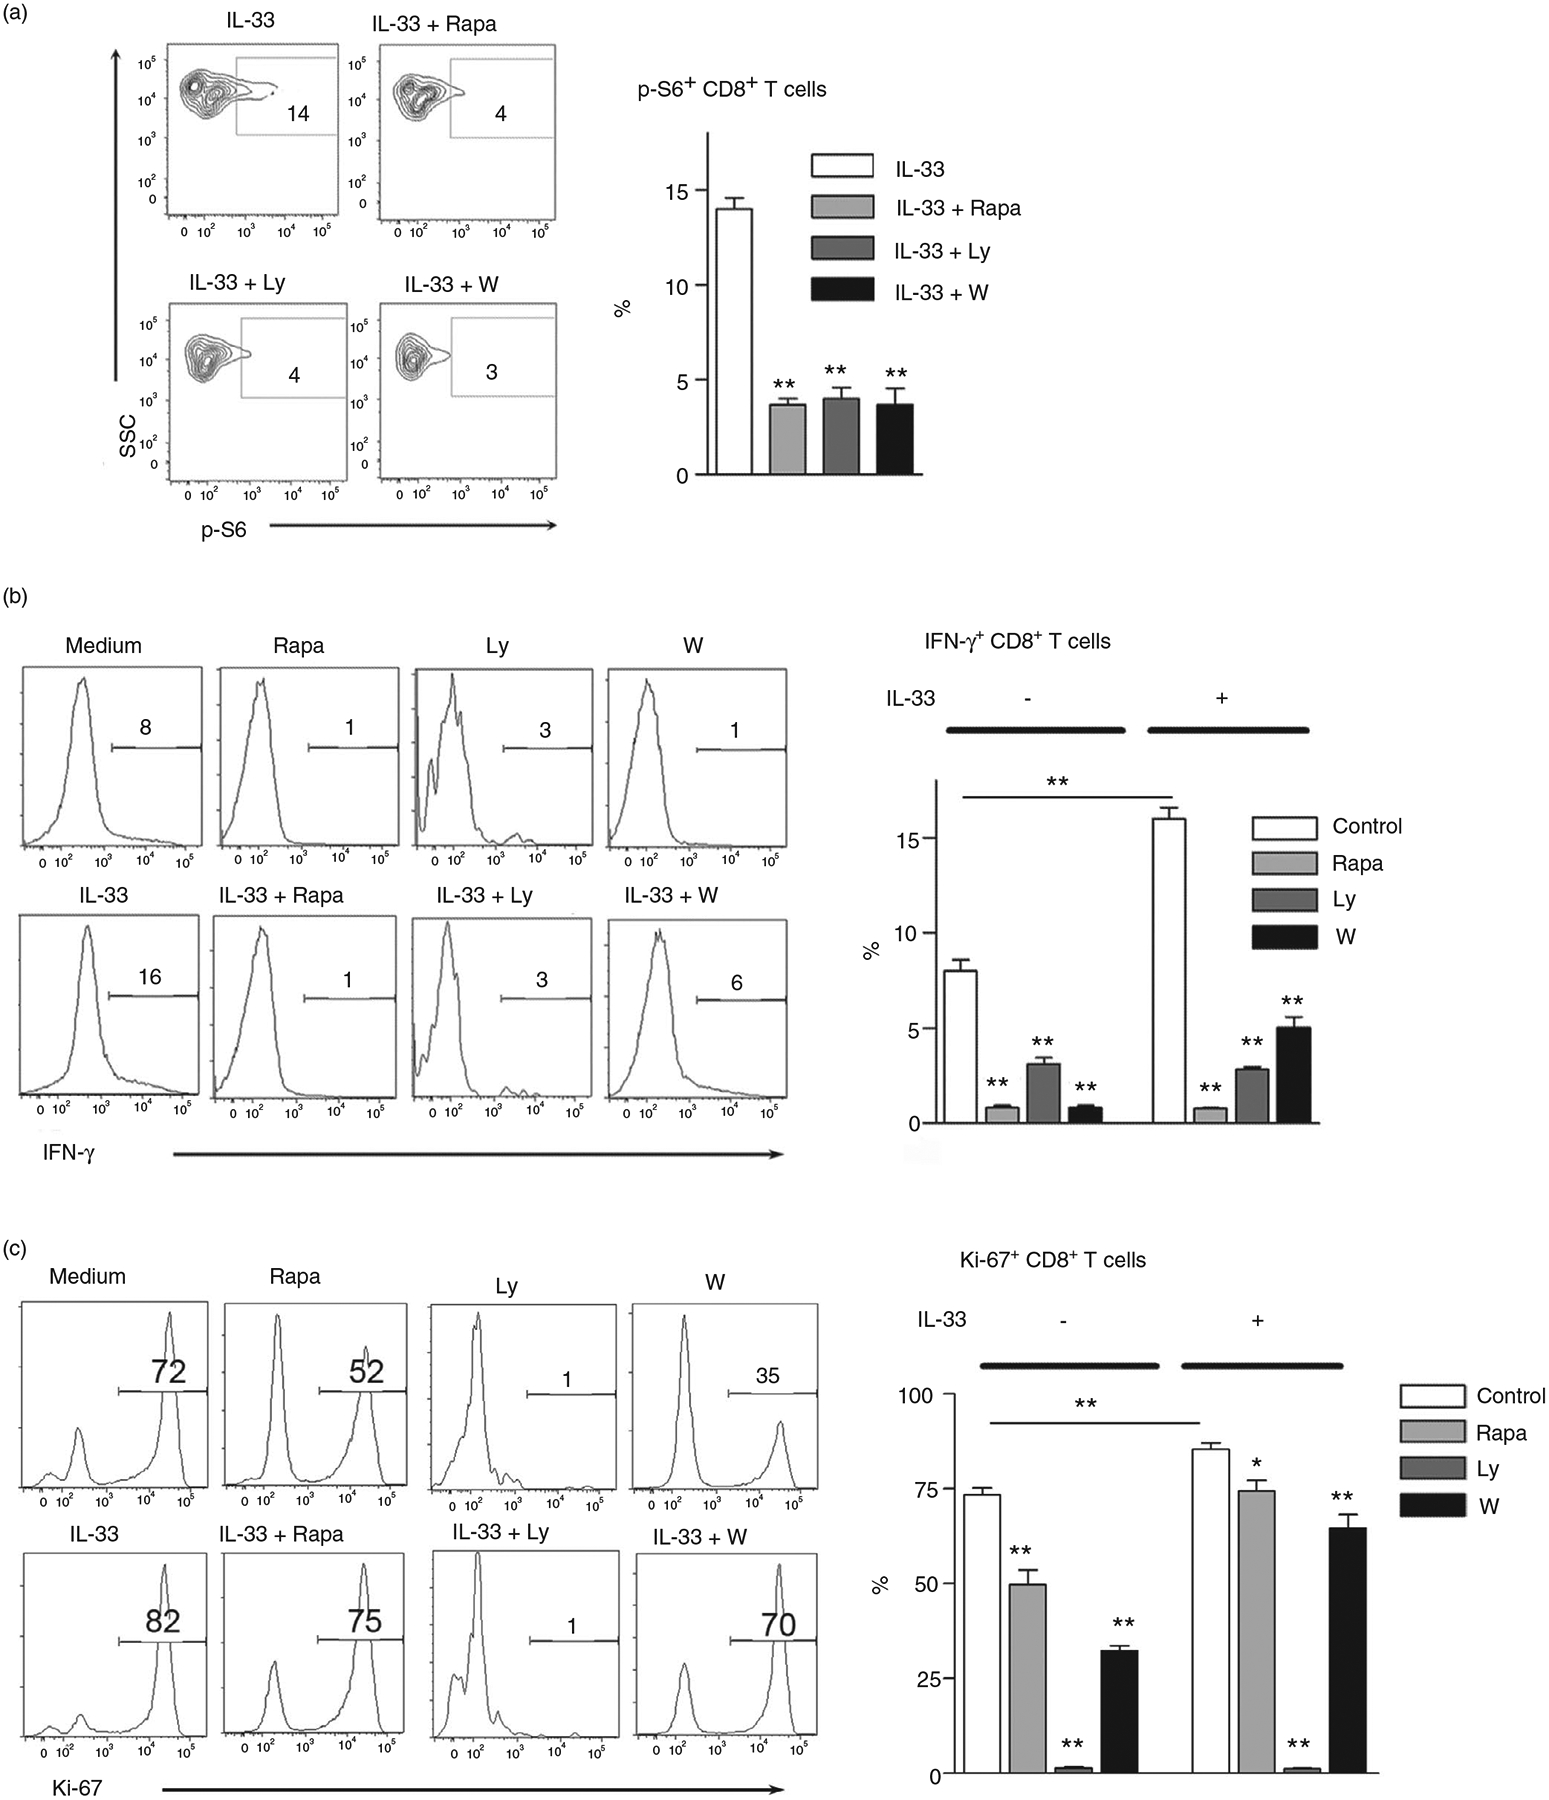
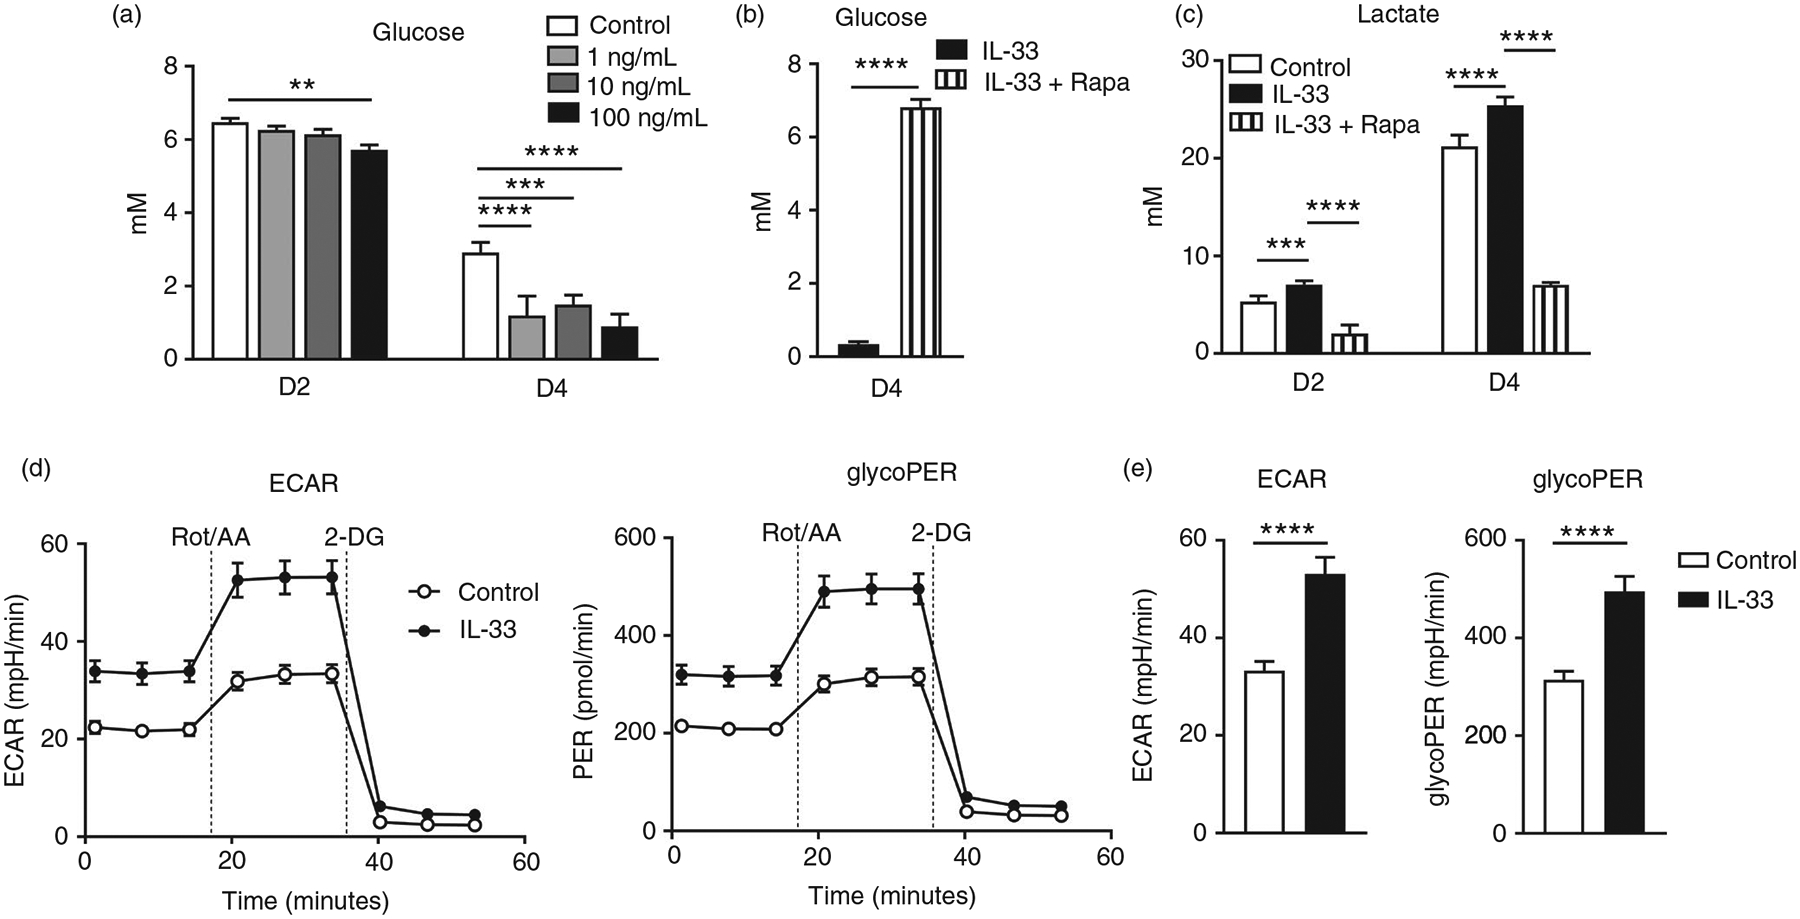
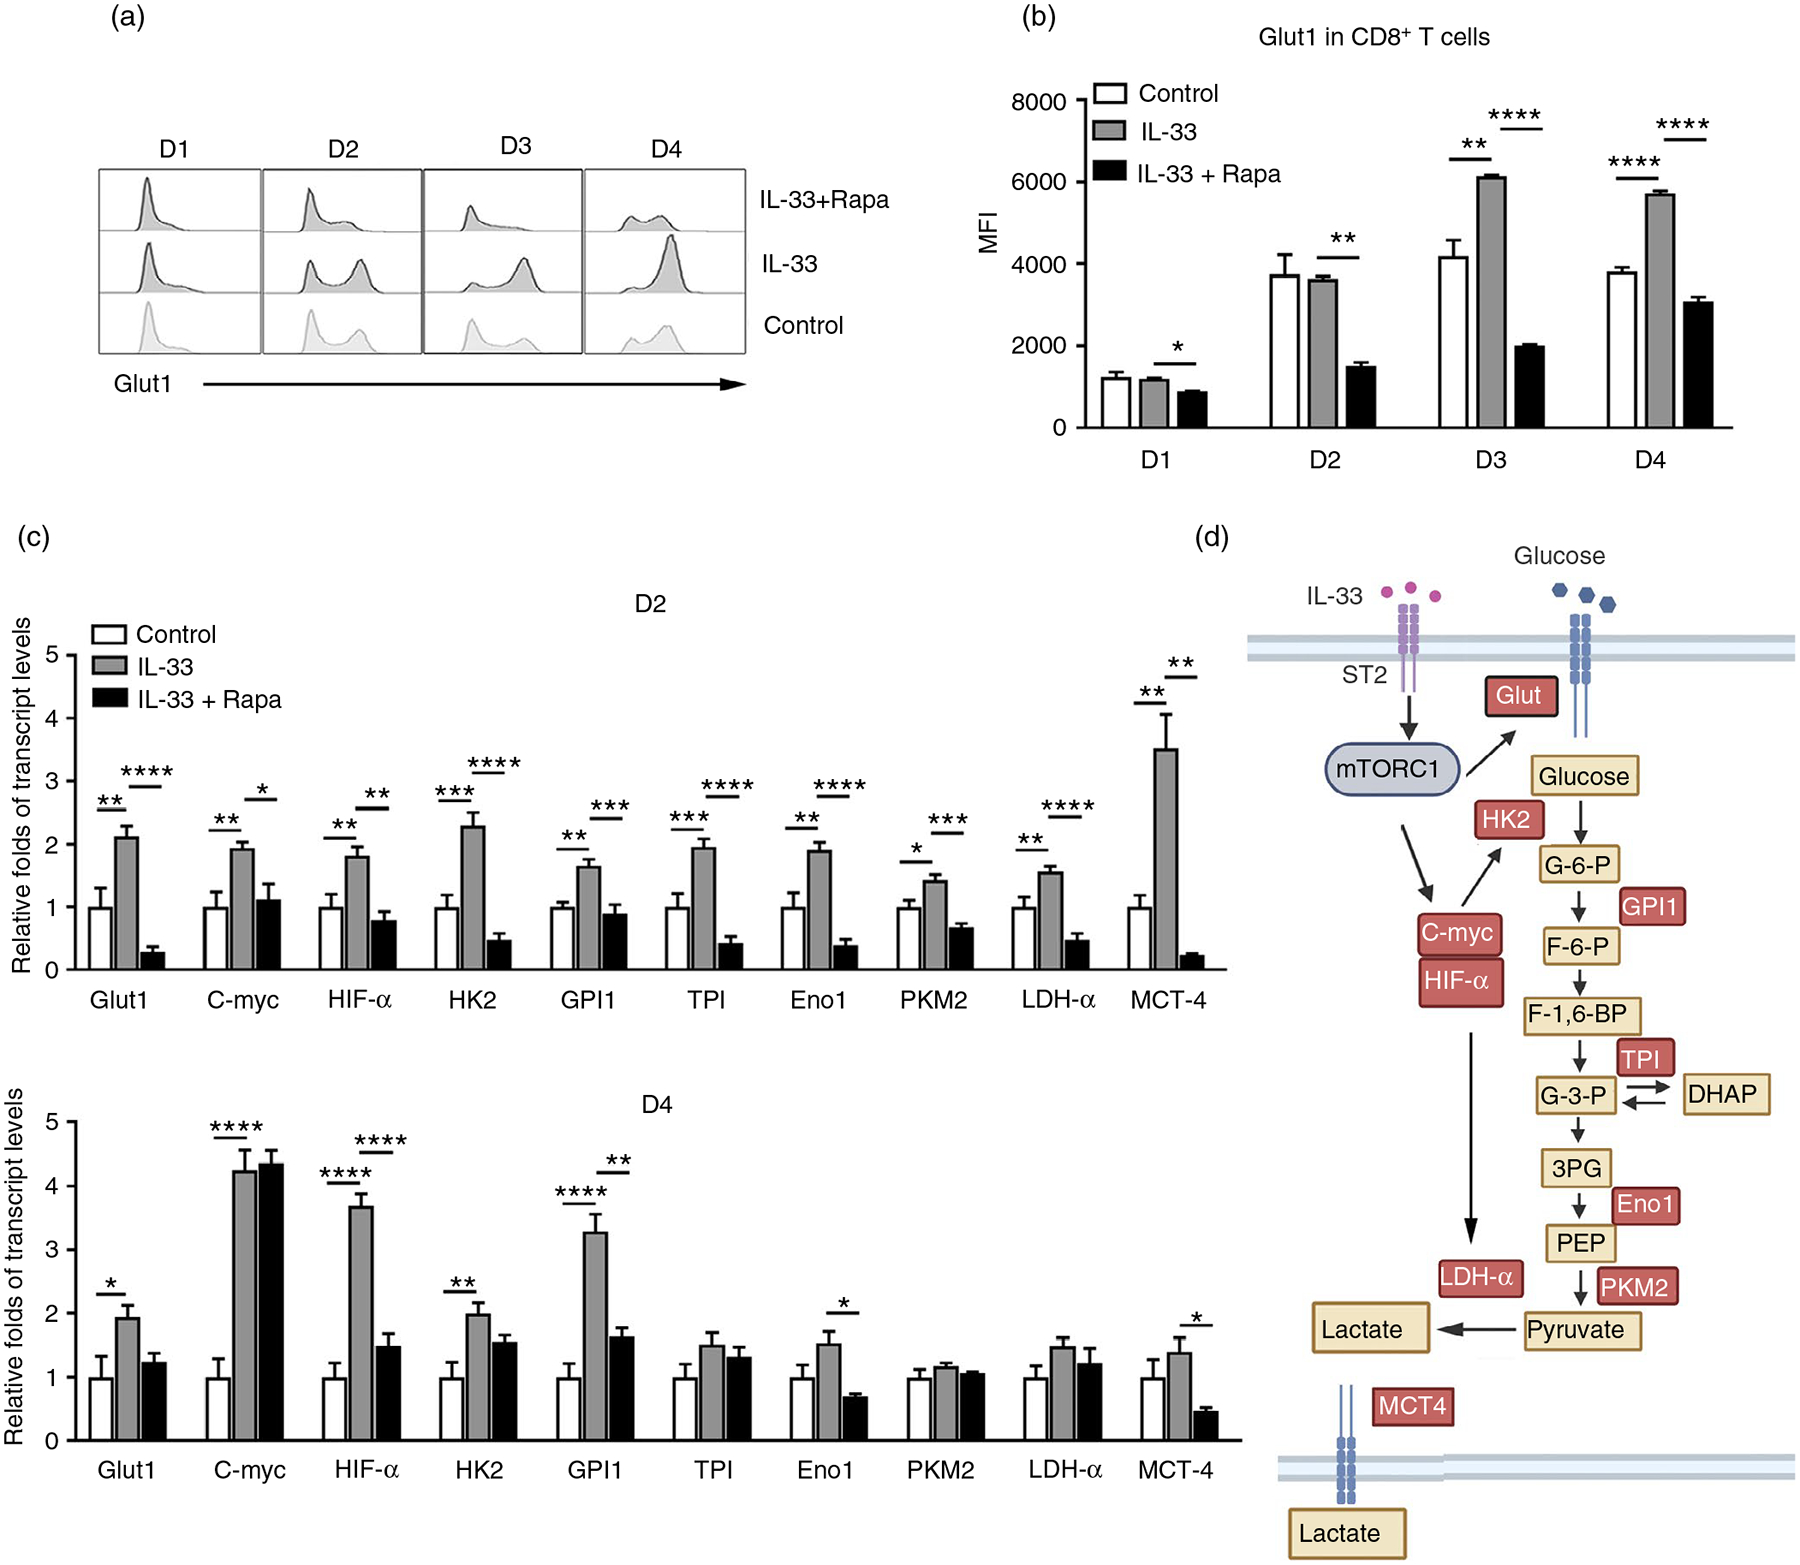
Interleukin (IL)-33, a member in the IL-1 family, plays a central role in innate and adaptive immunity; however, how IL-33 mediates cytotoxic T-cell regulation and the downstream signals remain elusive. In this study, we found increased mouse IL-33 expression in CD8+ T cells following cell activation via anti-CD3/CD28 stimulation in vitro or lymphocytic choriomeningitis virus (LCMV) infection in vivo. Our cell adoptive transfer experiment demonstrated that extracellular, but not nuclear, IL-33 contributed to the activation and proliferation of CD8+ , but not CD4+ T effector cells in LCMV infection. Importantly, IL-33 induced mTORC1 activation in CD8+ T cells as evidenced by increased phosphorylated S6 ribosomal protein (p-S6) levels both in vitro and in vivo. Meanwhile, this IL-33-induced CD8+ T-cell activation was suppressed by mTORC1 inhibitors. Furthermore, IL-33 elevated glucose uptake and lactate production in CD8+ T cells in both dose- and time-dependent manners. The results of glycolytic rate assay demonstrated the increased glycolytic capacity of IL-33-treated CD8+ T cells compared with that of control cells. Our mechanistic study further revealed the capacity of IL-33 in promoting the expression of glucose transporter 1 (Glut1) and glycolytic enzymes via mTORC1, leading to accelerated aerobic glucose metabolism Warburg effect and increased effector T-cell activation. Together, our data provide new insights into IL-33-mediated regulation of CD8+ T cells, which might be beneficial for therapeutic strategies of inflammatory and infectious diseases in the future.

Keywords: CD8; Glut1; IL-33; T cells; glycolytic metabolism; mTORC1.


Conflict of interest statement

CONFLICT OF INTEREST

The authors have no financial conflicts of interest.

Figures

FIGURE 1
FIGURE 1
Extracellular, but not nuclear IL-33 contributes to CD8+ T-cell responses. (a and b) Spleen cells were isolated from naïve WT and IL-33−/− mice, followed by adoptively transferring them into CD45.1 recipient mice. (c and d) Spleen cells were isolated from naïve CD45.1 mice, followed by adoptively transferring them into WT and IL-33−/− recipient mice. The number of transferred cells was 1 × 10⁷ for each mouse. Animals were infected with LCMV (2 × 10⁶ FFU/mouse) 1 day after cell adoptive transfer, and killed at 7 days post-infection. Lymphocytes were prepared from spleens and stimulated with viral peptides GP33 (5 μg/ml) in the presence of Brefeldin A for 5 h, followed by surface marker and intracellular cytokine staining. The transferred cells in recipient mice were gated first according to CD45.1 and CD45.2 markers. The data are shown as mean ± SEM of n = 3–5 mice/group from single experiments and are representative of at least three experiments performed. A two-tailed Student’s t test was used for statistical analysis. *p < 0·05; **p < 0·01; NS, no significant difference
FIGURE 2
FIGURE 2
Increased p-S6 expression in CD8+ T cells by IL-33 stimulation. (a) WT and IL-33−/− mice were infected with LCMV (2 × 10⁶ FFU/mouse) and killed at 7 days post-infection. Lymphocytes were prepared from spleens and stimulated with viral peptides GP33 and GP61 in the presence of Brefeldin A for 5 h, followed by surface marker and intracellular cytokine staining. The numbers of IFN-γ+ and IFN-γ+ TNF+ T cells were calculated. (b) Splenocytes isolated from infected mice were fixed and permeabilized for p-S6 staining. The percentages of p-S6+ cells were shown. (c) Splenocytes isolated from naïve mice were cultured in anti-CD3/CD28-coated plates for 3 days. Cells were harvested, rested in RPMI 1640 medium without FBS for 1 h, and incubated with 100 ng/ml IL-33 at 37°C for the indicated times. The p-S6 expression was evaluated according to the BD Phosflow staining protocol, and the percentages of p-S6+ cells are shown. (d) CD8 T cells were purified from WT mouse spleens, followed by the culture in anti-CD3/CD28-coated plates for 3 days. Cells were rested in RPMI 1640 medium without FBS for 1 h, followed by IL-33 treatment (100 ng/ml) at 37°C for the 20 min. Cell protein was extracted using a RIPA buffer with the phosphatase inhibitor cocktail, and the p-S6 expression was evaluated by Western blot. (e) CD8+ T cells were isolated from the spleen of IL-33−/− mice and cultured as in (d). The percentages of p-S6+ cells are shown. The data are shown as mean ± SEM of n = 3–5 mice/group from single experiments and are representative of at least three experiments performed. For in vitro experiments, triplicates were performed for each group. A two-tailed Student’s t test was used for statistical analysis of two groups. One-way ANOVA was used to compare three or more groups. *p < 0·05; ***p < 0·001; NS, no significant difference
FIGURE 3
FIGURE 3
Inhibition of mTORC1 results in impaired CD8 T-cell activation and proliferation by IL-33. (a) Splenocytes isolated from naïve mice were cultured in anti-CD3/CD28-coated plates for 3 days. Cells were treated with rapamycin (25 nM), Ly294002 (5 μM) and wortmannin (100 nM) for 2 h, followed by 100 ng/ml IL-33 stimulation for 10 min at 37°C. DMSO was used as a control. The p-S6 expression was evaluated according to the BD Phosflow staining protocol, and the percentages of p-S6+ cells were shown. The IL-33 group was used as a control for comparison (b and c) Purified CD8+ T cells were cultured in anti-CD3/CD28-coated plates in the presence of IL-33 (100 ng/ml) and inhibitors for 4 days. Brefeldin A was added in the last 6 h of culture. Intracellular IFN-γ and Ki-67 expression were analysed by flow cytometry. The data are shown as mean ± SEM from single experiments and are representative of at least two experiments performed. Triplicates were performed for each group. One-way ANOVA with Dunnett multiple comparisons was used for statistical analysis. *p < 0·05; **p < 0·01
FIGURE 4
FIGURE 4
IL-33 promotes glucose uptake and lactate production in CD8 effector cells. CD8+ T cells were purified from naïve mouse spleens and cultured in anti-CD3/CD28-coated plates in the presence of different doses of IL-33. (a) Supernatant was collected at days 2 and 4 for the measurement of glucose. (b and c) CD8+ T cells were cultured in the presence of IL-33 (100 ng/ml) with rapamycin (25 nM) added or omitted. Supernatant was collected for glucose and lactate measurement. (d–e) WT CD8+ T cells were cultured in anti-CD3/CD28-coated plates with or without IL-33 (100 ng/ml) for 3 days. Cells were harvested and seeded into a 96-well Seahorse plate at a density of 1 × 10⁵/well in Seahorse XF assay medium. Glycolytic rate assay kit (Agilent, Santa Clara, CA) was used to determine extracellular acidification rate (ECAR) and glycolytic proton efflux rate (glycoPER) according to the manufacturer’s instruction. The data are shown as mean ± SEM from single experiments and are representative of at least two experiments performed. Triplicates were performed for each group. A two-tailed Student’s t test was used for statistical analysis of two groups. One-way ANOVA with Dunnett multiple comparisons were used for statistical analysis of three or more groups. **p < 0·01; ***p < 0·001; ****p < 0·0001
FIGURE 5
FIGURE 5
IL-33 modulates glycolytic metabolism in CD8 T cells. CD8+ T cells were purified from naïve WT mouse spleens and cultured in anti-CD3/CD28-coated plates in the presence of IL-33 and rapamycin (25 nM). (a) The expression of Glut1 was analysed by flow cytometry and (b) the mean fluorescent intensity (MFI) of Glut1. (c) Transcript levels of glycolytic pathway associated genes in CD8+ T cells. (d) Schematic figure of IL-33-regulated glycolytic metabolism through the mTORC1 signalling pathway. The data are shown as mean ± SEM from single experiments and are representative of at least three experiments performed. Triplicates were performed for each group. One-way ANOVA with Dunnett multiple comparisons were used for statistical analysis of three or more groups. *p < 0·05; **p < 0·01; ***p < 0·001; ****p < 0·0001

References

    1. Schmitz J, Owyang A, Oldham E, Song Y, Murphy E, McClanahan TK, et al. IL-33, an interleukin-1-like cytokine that signals via the IL-1 receptor-related protein ST2 and induces T helper type 2-associated cytokines. Immunity. 2005;23:479–90. - PubMed
    1. Chan BCL, Lam CWK, Tam LS, Wong CK. IL33: roles in allergic inflammation and therapeutic perspectives. Front Immunol. 2019;10:364. - PMC - PubMed
    1. Gao X, Wang X, Yang Q, Zhao X, Wen W, Li G, et al. Tumoral expression of IL-33 inhibits tumor growth and modifies the tumor microenvironment through CD8+ T and NK cells. J Immunol. 2015;194:438–45. - PMC - PubMed
    1. Reichenbach DK, Schwarze V, Matta BM, Tkachev V, Lieberknecht E, Liu Q, et al. The IL-33/ST2 axis augments effector T-cell responses during acute GVHD. Blood. 2015;125:3183–92. - PMC - PubMed
    1. Schiering C, Krausgruber T, Chomka A, Frohlich A, Adelmann K, Wohlfert EA, et al. The alarmin IL-33 promotes regulatory T-cell function in the intestine. Nature. 2014;513:564–8. - PMC - PubMed

Publication types

MeSH terms