. 2021 Sep 2;184(18):4626-4639.e13.
doi: 10.1016/j.cell.2021.07.019. Epub 2021 Aug 18.

Parallel and distributed encoding of speech across human auditory cortex

Affiliations

Parallel and distributed encoding of speech across human auditory cortex

Liberty S Hamilton et al. Cell. .

Abstract

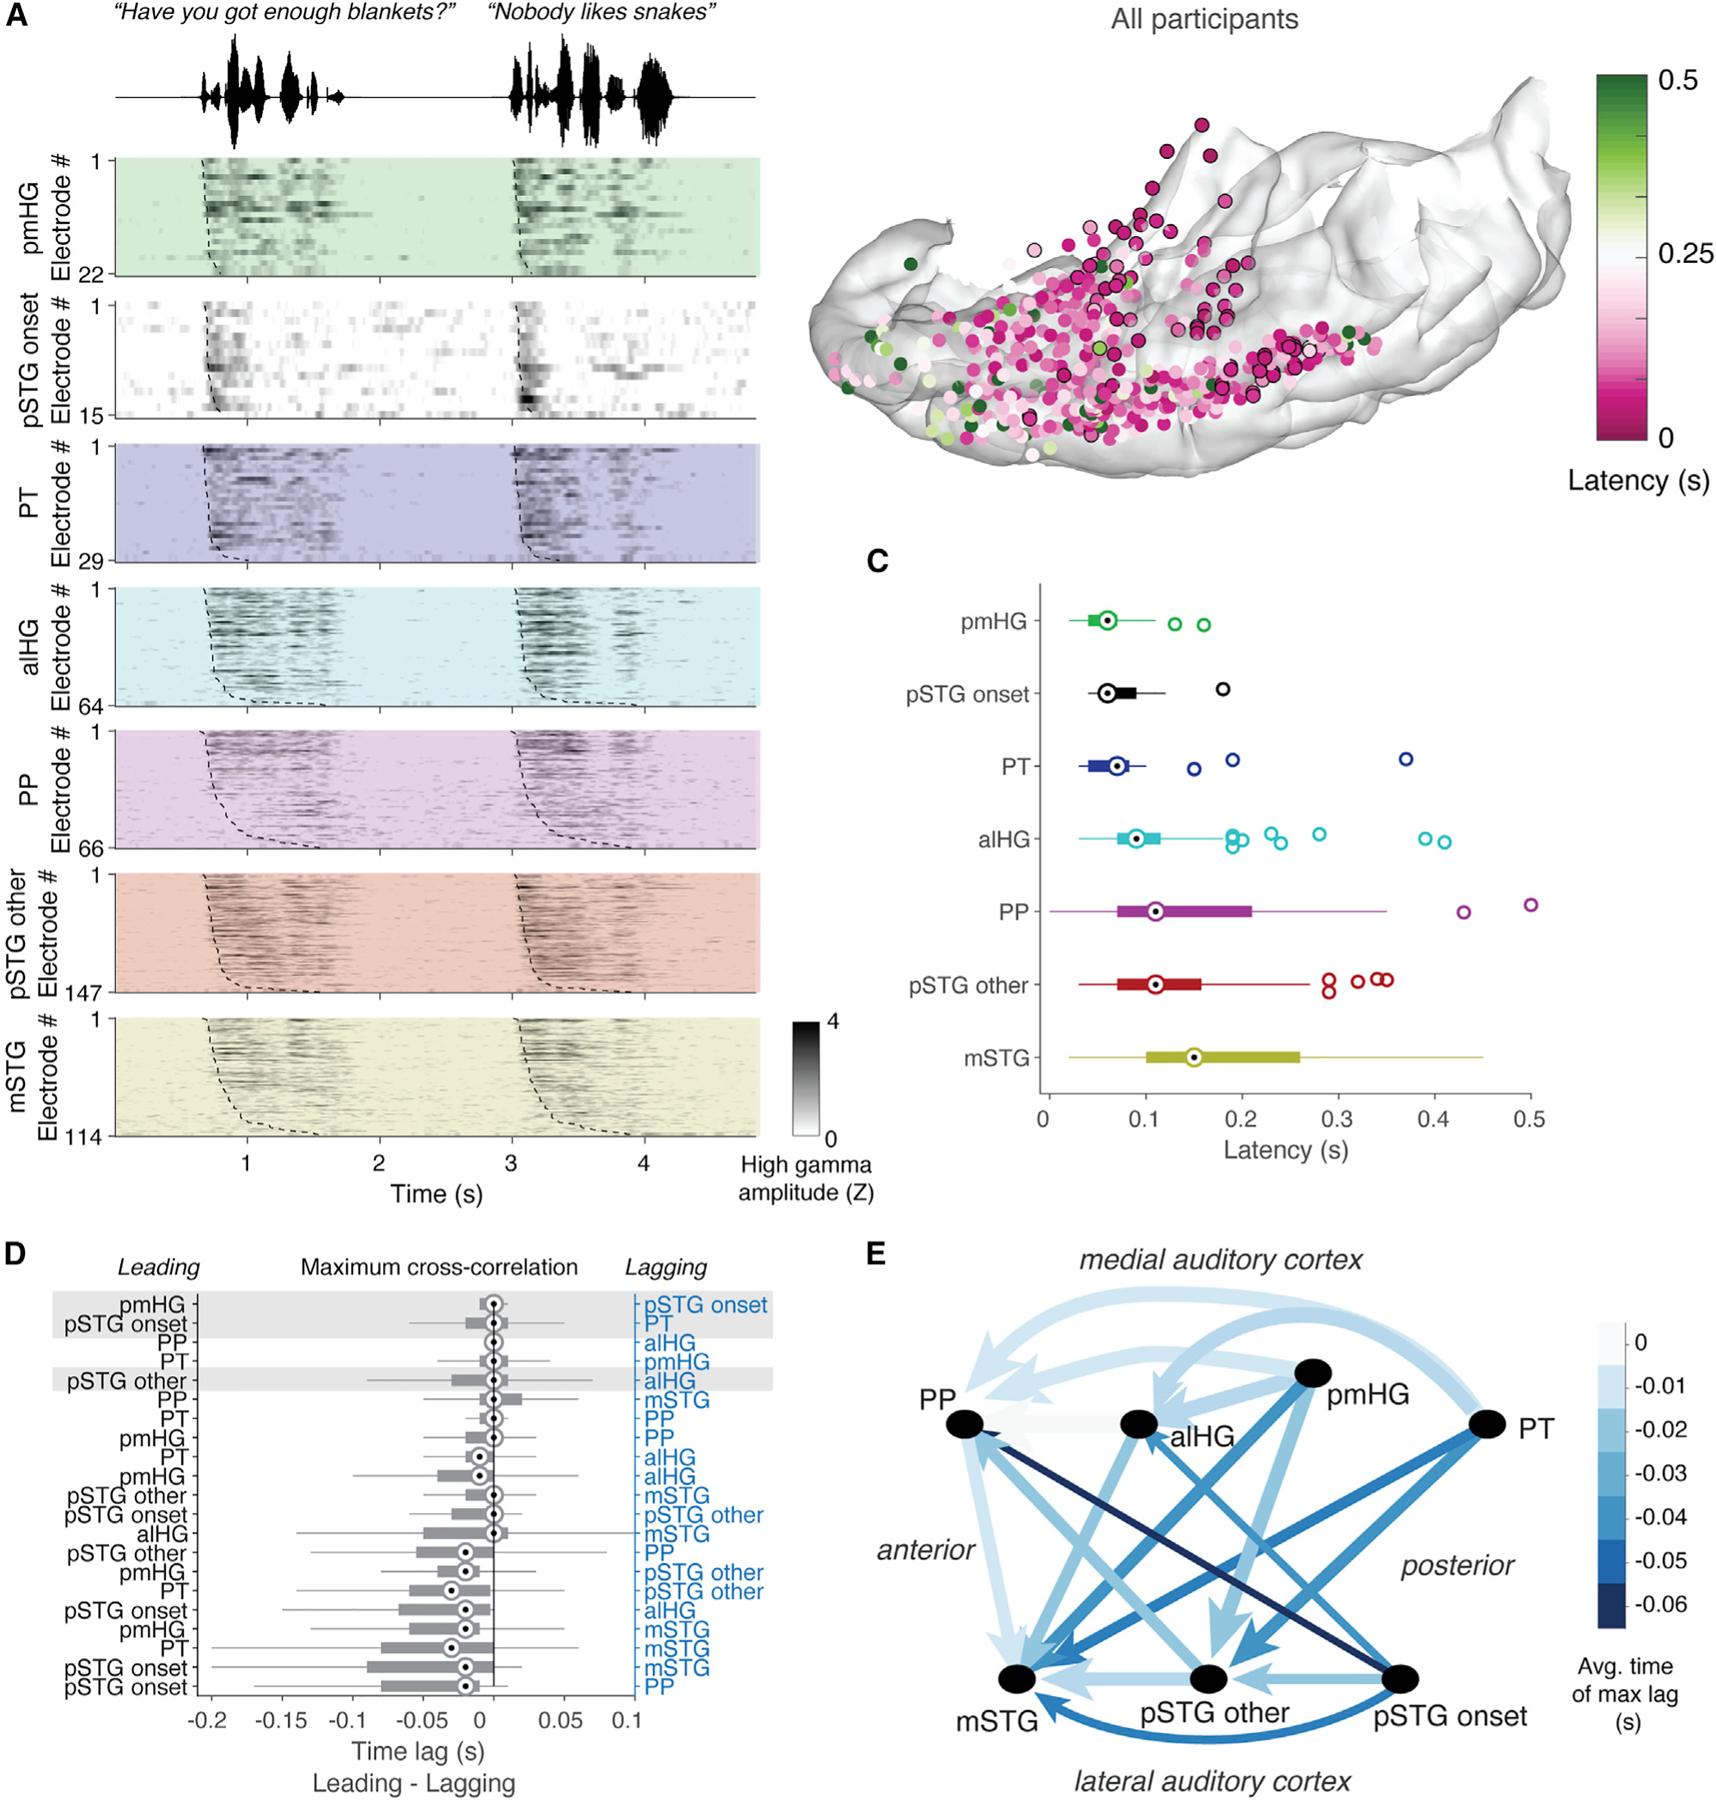
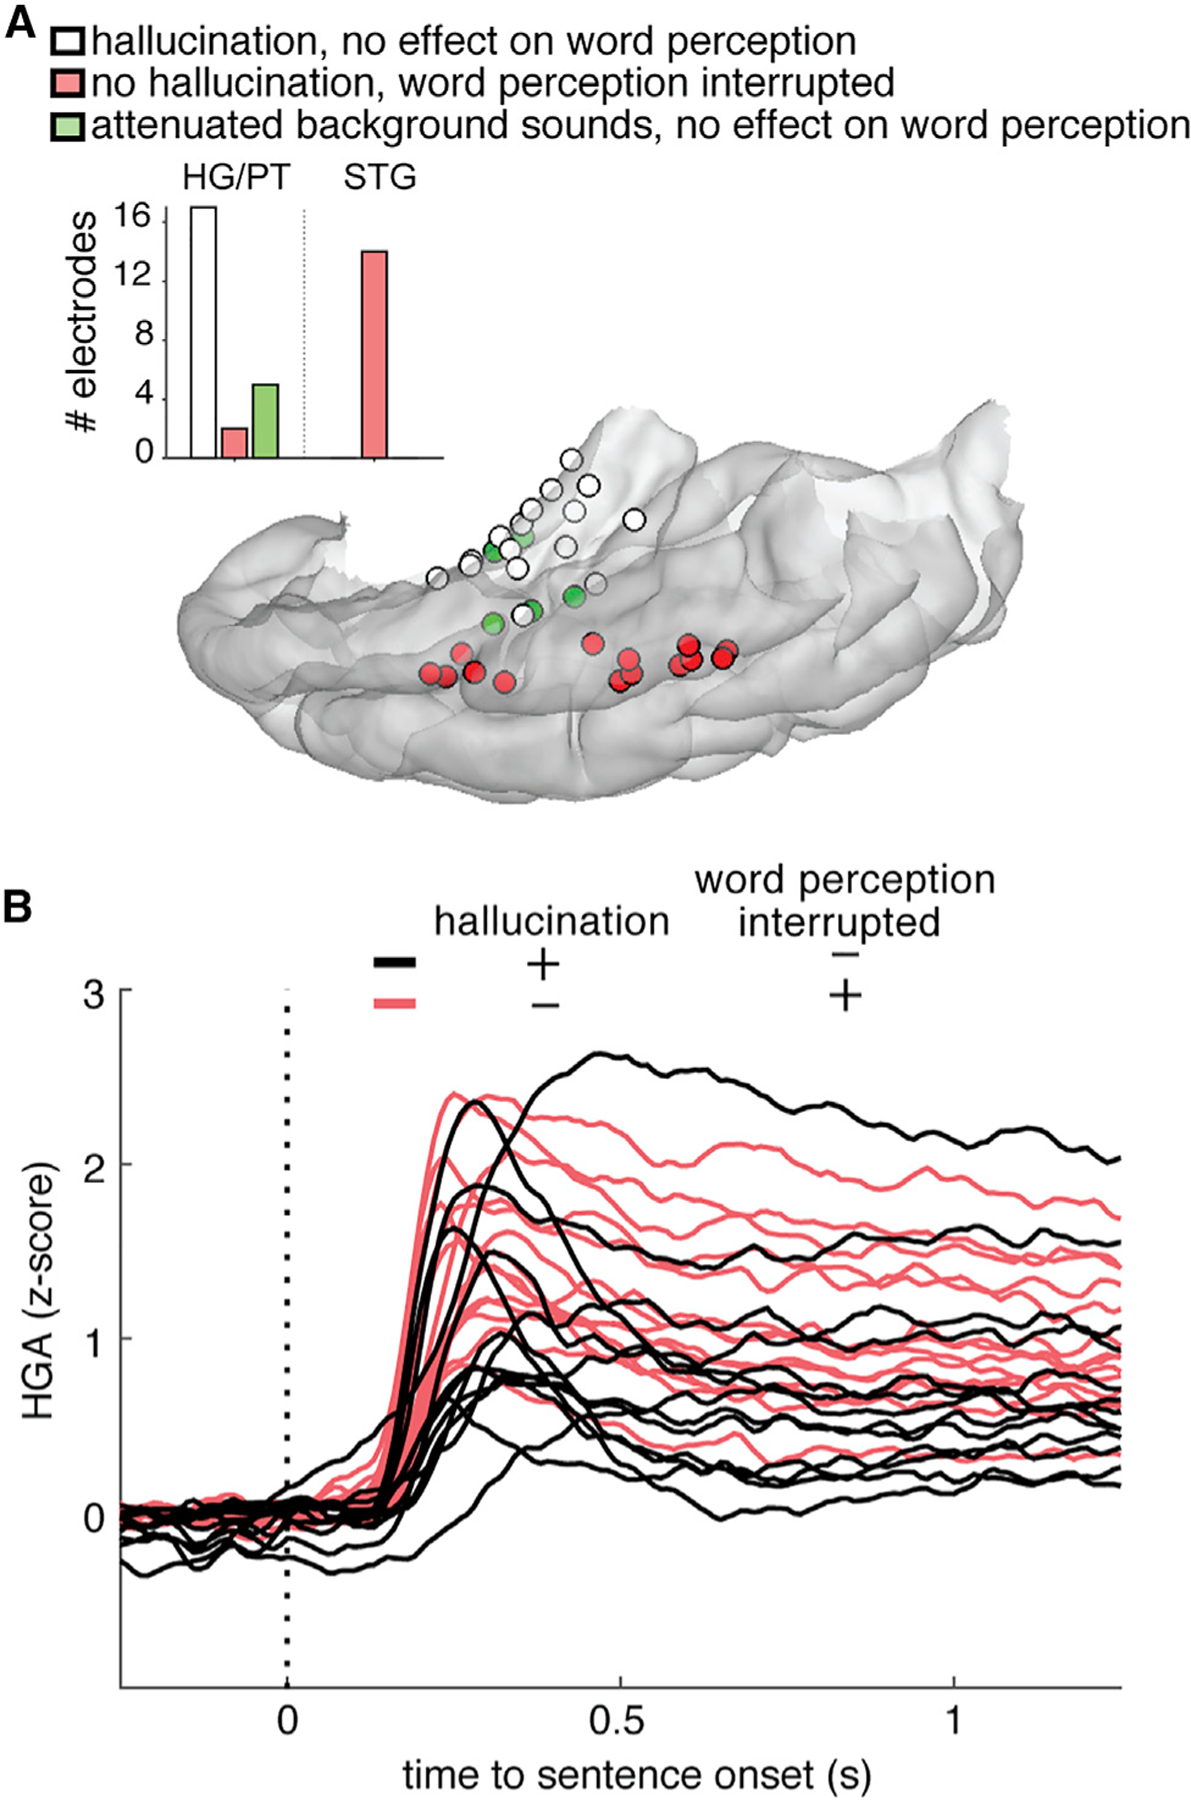
Speech perception is thought to rely on a cortical feedforward serial transformation of acoustic into linguistic representations. Using intracranial recordings across the entire human auditory cortex, electrocortical stimulation, and surgical ablation, we show that cortical processing across areas is not consistent with a serial hierarchical organization. Instead, response latency and receptive field analyses demonstrate parallel and distinct information processing in the primary and nonprimary auditory cortices. This functional dissociation was also observed where stimulation of the primary auditory cortex evokes auditory hallucination but does not distort or interfere with speech perception. Opposite effects were observed during stimulation of nonprimary cortex in superior temporal gyrus. Ablation of the primary auditory cortex does not affect speech perception. These results establish a distributed functional organization of parallel information processing throughout the human auditory cortex and demonstrate an essential independent role for nonprimary auditory cortex in speech processing.

Keywords: Heschl's gyrus; auditory cortex; cortical stimulation; electrocorticography; intracranial recordings; speech; superior temporal gyrus.


Conflict of interest statement

Declaration of interests The authors declare no competing interests.

Figures

Figure 1.
Figure 1.. Anatomical parcellations of temporal lobe regions of the human auditory cortex and electrode coverage
(A) Anatomical regions of interest on the left hemisphere temporal lobe of an example participant. STG = superior temporal gyrus, MTG = middle temporal gyrus. (B) Electrode counts across anatomical areas for all nine participants. (C) Comparison between onset-only and spectrotemporal models shows a population described by only a singular onset feature. (D) All participants’ electrodes projected onto an Montreal Neurological Institute (MNI) atlas brain (cvs_avg35_inMNI152). Electrode size reflects the maximum amount of variance (R2) explained by the encoding models tested in our analyses. Electrode sites are colored according to their anatomical location. See also Figures S1 and S6 and Table S2.
Figure 2.
Figure 2.. The onset of fast-latency responses in the pSTG is indistinguishable from the onset of responses in primary auditory areas
(A) Z-scored high-gamma-amplitude (HGA) responses during speech listening for two example sentences, split by single electrodes in each region of interest (ROI) and ordered by average latency. Response latencies are marked as dashed lines and were measured as the maximum derivative of the high-gamma response. (B) The high-gamma-derived latencies for each electrode across all participants on an atlas brain. PT, pmHG, and pSTG onset electrodes are outlined in black. (C) Comparison of onset latencies across brain regions. Only latencies <0.5 s are shown. pmHG, pSTG onset, and PT electrodes showed fast onset times that were statistically indistinguishable. Boxplots in (C) and (D) show the median, interquartile range (box), and minimum of maximum of the data (whiskers), as well as outlier values (open circles). (D) Cross-correlation analysis between pairs of regions of interest (ROIs), ordered by mean time lag of maximum cross-correlation. Time lags to the left of 0 s indicate that the left ROI precedes the right ROI (e.g., pSTG onset precedes alHG). Gray shading indicates lead-lag relationships that are not significantly different from zero, indicating simultaneous activation. (E) Lag-correlation-based connections shown schematically for each of the seven ROIs. Arrows point from the leading ROI to the lagging ROI, color indicates the time delay (lag), and width of the arrow indicates the strength of the cross-correlation. Latency patterns suggest parallel information processing in pSTG onset area and posteromedial temporal plane.
Figure 3.
Figure 3.. Regional selectivity for speech and pure tones; divergence of tuning curves to simple and complex acoustic inputs in the human auditory cortex
(A) Example temporal plane and lateral temporal cortical grids for one participant. Inset shows the whole brain. (B) Comparison between normalized response magnitudes to speech and pure tone stimuli across all participants on atlas brain. Electrodes are colored according to the normalized magnitude of the pure-tone response (blue) and speech response during sentence listening (red). Purple indicates mixed selectivity. (C) Pure-tone receptive fields for electrodes shown in (A). (D) Speech spectrotemporal receptive fields using maximally informative dimensions (MID1 STRFs) for electrodes in (A). (E) Comparison of normalized pure-tone and speech tuning curves from sites in (C) and (D). (F) Maximum pure-tone response and speech responses by area. (G) Percentage of sites with significant receptive fields by anatomical area, as measured by significance of within receptive field (RF) responses as compared to outside RF. Percentages are split into single-versus multi-peaked RF. (H) Correlation between frequency tuning for pure tones (as in D) to frequency tuning for speech (from MID1-STRF, as in E). Boxplot boxes show 25th and 75th percentiles and the median. Whiskers show extreme non-outlier values. * = p-value <0.05. See also Figures S2 and S3 and Table S1.
Figure 4.
Figure 4.. Regional selectivity for speech features
(A) Speech features tested in feature model comparisons for an example sentence. (B) Receptive fields for example electrodes. The feature with maximal unique R2 is indicated for each electrode. Electrodes were chosen for which distinct sets of features explain a large portion of variance. For example, the best model for electrode 1 includes onset, peakRate, and phonetic features, but 50% of overall explained variance is attributed to the onset predictor. (C) Location of electrodes primarily coding for speech onsets, phonetic features and peakRate, relative pitch, and absolute pitch. Electrodes in (B) are circled. (D and E) Onset (D) and feature-encoding electrodes (E) are defined as those for which the respective model outperforms a spectrotemporal model. (F) Anatomical distribution of electrodes coding for different features. Absolute pitch dominates representations in PT and pmHG, and relative pitch is primarily represented in PP, alHG, and STG (χ2 = 62.5, p < 10−9). Orange = both relative and absolute pitch contribute unique variance, permutation p < 0.05. Onset-encoding electrodes are mostly located in pSTG, whereas phonological features and peakRate are represented in posterior and anterior lateral STG. Related to Figure S5.
Figure 5.
Figure 5.. Electrocortical stimulation of Heschl’s gyrus and superior temporal gyrus
(A) Focal electrocortical stimulation shows double dissociation between effects of stimulation on HG and lateral STG. Stimulation in HG evoked auditory hallucinations but did not interfere with word perception and repetition. Participants could not perceive words during stimulation on lateral STG, but no additional sound hallucinations were evoked. (B) Z-scored high gamma amplitude (HGA) responses to sentences on electrodes in (A) did not differ between sites with different stimulation effects. Black traces show the evoked sentence response in electrodes where stimulation caused an auditory hallucination but no change in word perception. Red traces are sites where no hallucination occurred, but word perception was interrupted with stimulation. Related to Figure S5 and Video S1.
Figure 6.
Figure 6.. Focal ablation of the left HG without damage to the pSTG has no effect on speech perception or language comprehension
Magnetic resonance (MR) image shows the extent of the surgical ablation in the axial plane along the axis of the HG, sparing pSTG. Image is shown in radiological orientation.

References

    1. Aertsen AM, and Johannesma PIM (1981). The spectro-temporal receptive field. A functional characteristic of auditory neurons. Biol. Cybern 42, 133–143. - PubMed
    1. Atencio CA, Sharpee TO, and Schreiner CE (2008). Cooperative nonlinearities in auditory cortical neurons. Neuron 58, 956–966. - PMC - PubMed
    1. Bartlett EL (2013). The organization and physiology of the auditory thalamus and its role in processing acoustic features important for speech perception. Brain Lang. 126, 29–48. - PMC - PubMed
    1. Barton B, Venezia JH, Saberi K, Hickok G, and Brewer AA (2012). Orthogonal acoustic dimensions define auditory field maps in human cortex. Proc. Natl. Acad. Sci. USA 109, 20738–20743. - PMC - PubMed
    1. Bendor D, and Wang X (2005). The neuronal representation of pitch in primate auditory cortex. Nature 436, 1161–1165. - PMC - PubMed

Publication types