. 2021 Aug 24;36(8):109604.
doi: 10.1016/j.celrep.2021.109604. Epub 2021 Aug 10.

Convergent antibody responses to the SARS-CoV-2 spike protein in convalescent and vaccinated individuals

Affiliations

Convergent antibody responses to the SARS-CoV-2 spike protein in convalescent and vaccinated individuals

Elaine C Chen et al. Cell Rep. .

Abstract

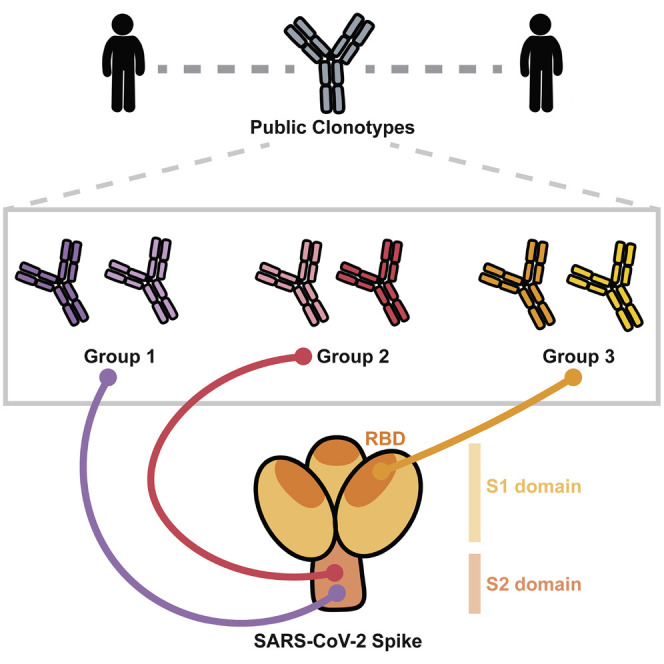
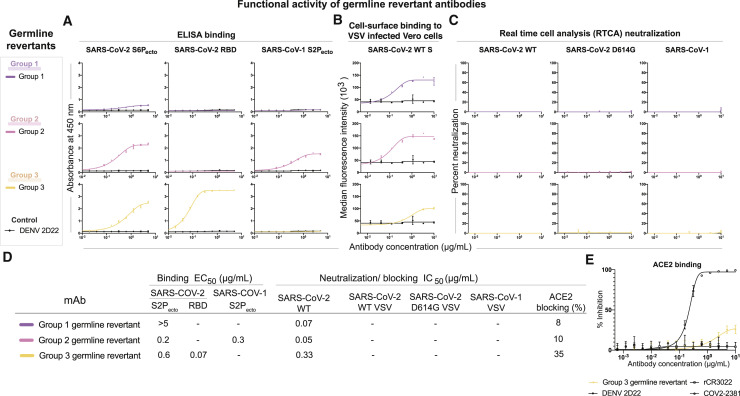
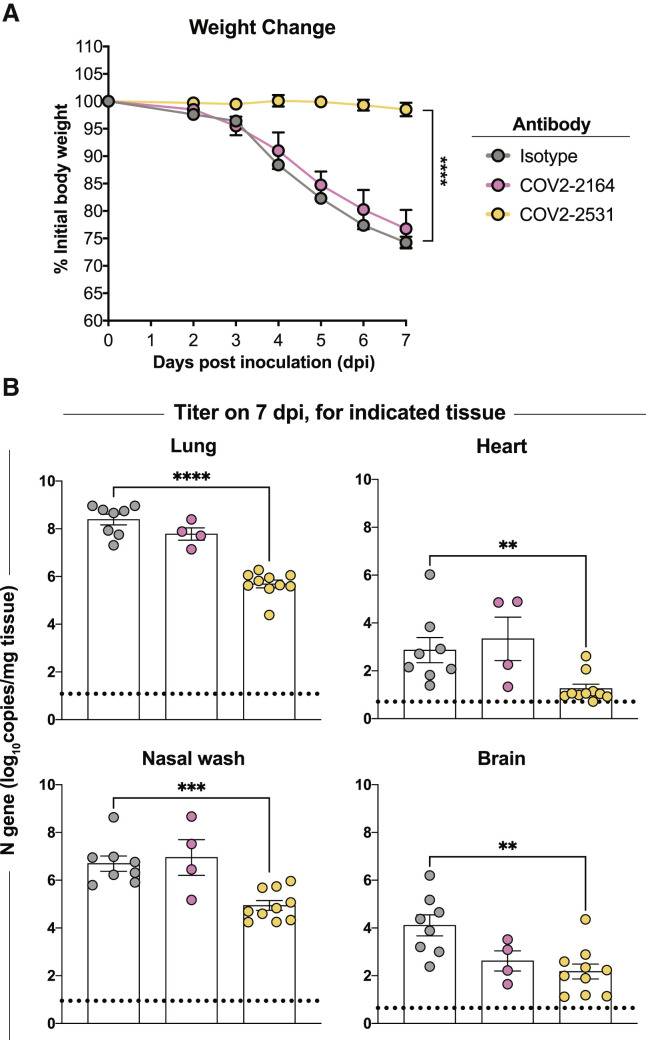
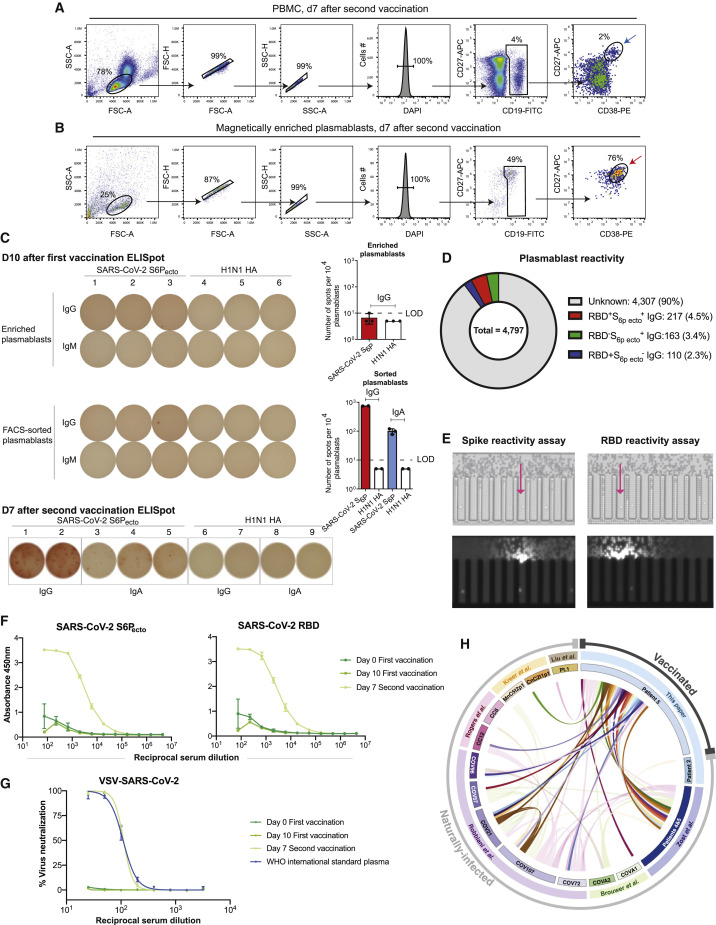
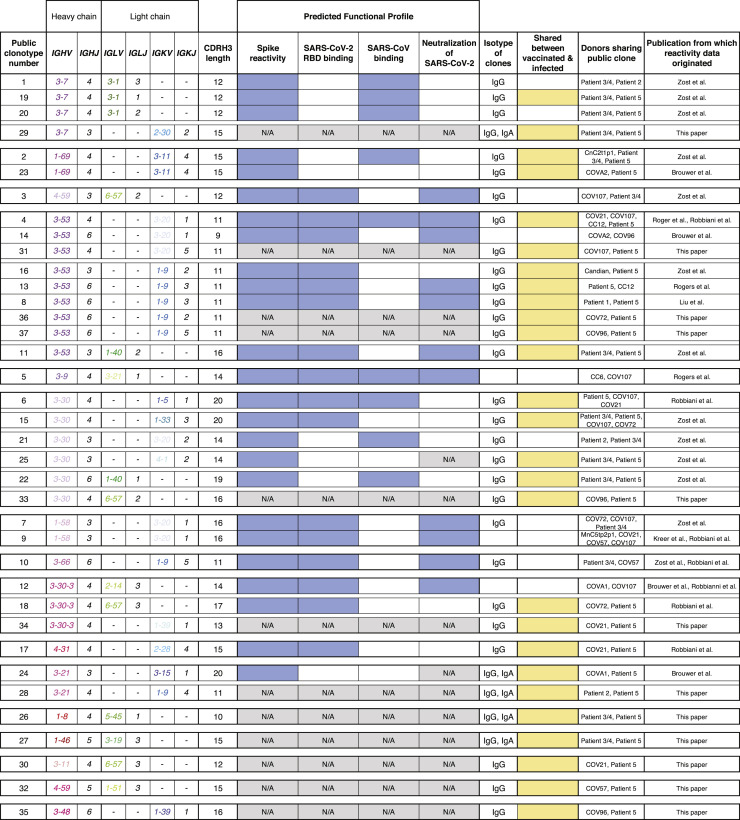
Unrelated individuals can produce genetically similar clones of antibodies, known as public clonotypes, which have been seen in responses to different infectious diseases, as well as healthy individuals. Here we identify 37 public clonotypes in memory B cells from convalescent survivors of severe acute respiratory syndrome coronavirus 2 (SARS-CoV-2) infection or in plasmablasts from an individual after vaccination with mRNA-encoded spike protein. We identify 29 public clonotypes, including clones recognizing the receptor-binding domain (RBD) in the spike protein S1 subunit (including a neutralizing, angiotensin-converting enzyme 2 [ACE2]-blocking clone that protects in vivo) and others recognizing non-RBD epitopes that bind the S2 domain. Germline-revertant forms of some public clonotypes bind efficiently to spike protein, suggesting these common germline-encoded antibodies are preconfigured for avid recognition. Identification of large numbers of public clonotypes provides insight into the molecular basis of efficacy of SARS-CoV-2 vaccines and sheds light on the immune pressures driving the selection of common viral escape mutants.

Keywords: COVID-19; SARS-CoV; SARS-CoV-2; adaptive immunity; antibodies; coronavirus; human; monoclonal; public clonotypes; vaccines.


Conflict of interest statement

Declaration of interests E.D., J.K.W., and B.J.D. are employees of Integral Molecular, and B.J.D. is a shareholder in that company. M.S.D. is a consultant for Inbios, Vir Biotechnology, NGM Biopharmaceuticals, and Carnival Corporation and is on the Scientific Advisory Boards of Moderna and Immunome. The Diamond laboratory has received funding support in sponsored research agreements from Moderna, Vir Biotechnology, and Emergent BioSolutions. J.E.C. has served as a consultant for Luna Biologics, is a member of the Scientific Advisory Board of Meissa Vaccines and is Founder of IDBiologics. The Crowe laboratory has received funding support in sponsored research agreements from AstraZeneca, IDBiologics, and Takeda.

Figures

None
Graphical abstract
Figure 1
Figure 1
Sequence characteristics of monoclonal antibodies to SARS-CoV-2 (A) Available sequences of mAbs to SARS-CoV-2 from multiple publications were obtained from public databases. Numbers inside each box represent the number of sequences with the indicated gene usage. Colored outlining boxes represent public clonotypes that are shared between the individuals listed in the key to the right side. The heatmap is color coded so that red represents a higher number of sequences using the corresponding genes, and blue represents a lower number of sequences using the corresponding genes. (B) CDR3 sequences of the heavy and light chains of each of the remaining eight public clonotypes are shown. Dashes represent amino acids that differed in the public clonotype. Each box color correlates to the public clonotypes in (A) and (C). (C) A Venn diagram illustrating all of the public clonotypes identified between naturally infected individuals. The colored boxes in the Venn diagram overlaps represent the public clonotypes identified in (A). Novel public clonotypes, designated as groups 1, 2, or 3, are highlighted in the purple, pink, or orange overlaps, respectively. (D) Multiple sequence alignments of the heavy chain sequences for groups 1, 2, or 3 to their respective inferred germline genes IGHV 3-07/IGHJ4, IGHV1-69/IGHJ4, or IGHV4-59/IGHJ3. The CDRH3 sequence is highlighted in dark blue. (E) Multiple sequence alignments of the light chain sequences for groups 1, 2, or 3 to their respective inferred germline genes IGLV3-01/IGLJ3, IGKV3-11/IGKJ4, or IGHV3-01/IGLJ2. The CDRL3 sequence is highlighted in light blue.
Figure 2
Figure 2
Reactivity and functional activity of group 1, 2, and 3 antibodies Group 1 antibodies are shown in light or dark purple, group 2 antibodies are in red or pink, and group 3 antibodies are in light or dark orange. mAb DENV 2D22 was used as a negative control antibody, as shown in the lines in black. All experiments are performed in biological replicates and technical triplicates. Biological replicate from representative single experiment is shown. (A) ELISA binding to SARS-CoV-2 S6Pecto, SARS-CoV-2 RBD, or SARS-CoV-1 S2Pecto was measured by absorbance at 450 nm. Antibody concentrations starting at 0.4 μg/mL were used and titrated 2-fold. (B) Neutralization activity of antibodies to VSV-SARS-CoV-2, VSV-SARS-CoV-2/D614G, and VSV-SARS-CoV-1 determined by using real-time cell analysis (RTCA) assay. The percent of neutralization is reported. Antibody concentrations started at 10 μg/mL and were titrated 3-fold. (C) Neutralization activity of antibodies to authentic SARS-CoV-2 (USA-WA1/2020) determined by measuring dsRNA intensity per cell count after Calu3 lung epithelial cells were inoculated with SARS-CoV-2. Antibody concentrations started at 10 μg/mL and were titrated 3-fold. (D) Antibody binding to full-length S (gray) or S protein C-terminal S2 region (red) expressed on the surface of HEK293T cells that were fixed and permeabilized. Antibodies were screened at 1 μg/mL. Antibody reactivity was measured by flow cytometry, and cellular florescence values were determined. COV2-2490, an NTD-directed antibody, was used as a control. (E) Binding to VSV-SARS-CoV-2-infected Vero cells (SARS-CoV-2 wild-type [WT]) was measured using flow cytometry, and median florescence intensity values were determined for dose-response binding curves. Antibody was diluted 3-fold starting from 10 μg/mL. (F) Binding to S protein C-terminal S2 region expressed on HEK293T cells (SARS-CoV-2 WT S2) was measured using flow cytometry, and mean fluorescence intensity values were determined for dose-response binding curves. Antibody was diluted 3-fold starting from 10 μg/mL. (G) Inhibition of ACE2 binding curves for COV2-2531 or C126. Antibody concentrations started at 10 μg/mL and were titrated 3-fold to identify ACE2 blocking curves. COV2-2531 is shown in light orange, and C126 is shown in dark orange. (H) The half maximal concentration (EC50) and half maximal inhibitory concentration (IC50) values for each of the assay curves in Figures 3A–3E. All values are denoted as μg/mL. ACE2 blocking was determined by measuring amount of ACE2 with FLAG tag binding in the presence of each antibody, measured by binding of an anti-FLAG antibody. Percent blocking is shown, calculated by using ACE2 binding without antibody as 0% blocking. (I) Binding of each antibody to several variants of concern spike proteins. Binding of each antibody (at 1 μg/mL) to the SARS-CoV-2 spike variants is shown relative to the antibody’s binding to the WT spike, defined as a value of 1.0. The relative amounts of each variant expressed in cells were estimated using the signal for antibody 1A9, normalizing the average 1A9 binding (at 1 μg/mL) for each variant to the average 1A9 binding with the WT construct. For each public clonotype antibody, the binding values to each variant spike were corrected for spike expression equivalent to that of the WT spike. Darker blue indicates less change to binding of that antibody to the variant. Lighter blue color indicates more change for binding of that antibody to the variant. (J) Neutralization curves of group 3 antibodies against variant SARS-CoV-2 strains. Antibodies were tested for inhibition of infection of the indicated viruses on Vero-TMPRSS2 cell monolayer cultures using a focus reduction neutralization test. (K) Antibody neutralization IC50 values for group 3 antibodies against variant SARS-CoV-2 strains. One representative experiment of two performed in duplicate and mean IC50 values (ng/mL) from two independent experiments are shown.
Figure 3
Figure 3
Epitope identification and structural characterization of antibodies (A) Negative stain EM of SARS-CoV-2 S6Pecto protein in complex with Fab forms of different mAbs. Negative stain 2D classes of SARS-CoV-2 S protein incubated with COV2-2531 or C126. Box size is 128 pix at 4.36 Å/pix. (B) mAb COV2-2531 3D volume with critical residues 372 and 275 shown in red on the S protein (blue). RBD is in the open position. Density corresponds to three fabs, as we docked a single Fab structure onto the EM density map, shown in magenta. (C) MAb C126 3D volume with critical binding residues shown in red. The Fab is docked to a protomer of SARS-CoV-2 S protein in the open conformation. Top left is the RBD positioned in open conformation, with the other two protomers in the trimer in closed position. The S protein is shown in green, with the RBD in yellow. The Fab is shown in magenta. (D) Competition-binding ELISA results for mAbs within each clonotype group. Unlabeled blocking antibodies applied to antigen first are listed across the top, while biotinylated antibodies that are added to antigen-coated wells second are indicated on the left. The number in each box represents percent un-competed binding of the biotinylated antibody in the presence of the indicated competing antibody. Heatmap colors range from dark gray (<40% binding of the biotinylated antibody) to light gray (>80% binding of the biotinylated antibody). Experiment was performed in biological replicate and technical triplicate. Biological replicate from representative single experiment is shown. (E) Competition-binding ELISA data using group 1, 2, or 3 antibodies against epitope-mapped reference antibodies. Biotinylated antibodies are indicated on the left, and the unlabeled antibodies applied to antigen first are indicated across the top. Heatmap colors range from dark gray (<20% binding of the biotinylated antibody) to light gray (>50% binding of the biotinylated antibody). Experiment was performed in biological replicate and technical triplicates. Biological replicate from representative single experiment shown. (F) Alanine scanning mutagenesis results for group 1, 2, or 3 antibodies. S2 epitope residues are shown (green spheres or blue spheres) on the S protein structure (PDB: 6XR8), S1 is colored yellow, and S2 is red. RBD epitopes are shown in red on the RBD structure (PDB: 6XR8). Primary data are shown in Figure S5.
Figure 4
Figure 4
Germline-revertant antibody reactivity and functional activity Group 1, 2, or 3 germline-revertant antibodies are shown in purple, pink, or yellow, respectively. DENV 2D22 was used as a control antibody for all assays, as shown in the lines in black. All experiments were performed in biological replicate and technical triplicate. Biological replicate from representative single experiment is shown, mean ± SD of triplicates is shown. (A) Binding to SARS-CoV-2 S6Pecto, SARS-CoV-2 RBD, or SARS-CoV-1 S2Pecto was measured by absorbance at 450 nm, as shown in the first three columns. (B) Binding to Vero cells infected with VSV-SARS-CoV-2, measured by flow cytometric analysis and reported as median florescence intensity. (C) Results for neutralization curves for replication-competent VSV chimeric viruses in real-time cell analysis (RTCA) are shown in the next three columns, measured by percent neutralization calculated by normalized cell index. (D) Binding EC50 and neutralization IC50 values for each of the assay curves in Figure 5A. All values are denoted as μg/mL. ACE2 blocking was determined by measuring the amount of ACE2 with FLAG tag binding in the presence of each antibody, measured by binding of an anti-FLAG antibody. Percent blocking is shown, calculated by using ACE2 binding without antibody as 0% blocking. (E) Inhibition binding curves for the group 3 germline-revertant antibody. The starting antibody concentration used was 10 μg/mL and was titrated 3-fold serially to obtain ACE2-blocking curves.
Figure 5
Figure 5
Antibody-mediated protection against SARS-CoV-2 challenge in mice (A and B) Eight-week-old male K18-hACE2 transgenic mice were inoculated by the intranasal route with 103 PFUs of SARS-CoV-2 (WA1/2020 strain). One day prior to infection, mice were given a single 200-μg dose of COV2-2351 or COV2-2164 by intraperitoneal injection. (A) Weight change. Statistical analysis was performed only between isotype- and COV2-2351-treated groups. For isotype and COV2-2531 (mean ± SEM; n = 8–10, two experiments: unpaired t test of area under the curve; ∗∗∗∗p < 0.0001). For COV2-2164 (mean ± SEM; n = 8, two experiments). (B) Viral RNA levels at 7 days post-infection in the lung, nasal wash, heart, and brain as determined by qRT-PCR. For isotype and COV2-2531 (mean ± SEM; n = 8–10, two experiments: one-way ANOVA with Turkey’s post-test: not significant [ns], p < 0.05, ∗∗∗p < 0.001, ∗∗∗∗p < 0.0001, comparison with the isotype control mAb-treated group). For COV2-2164 (mean ± SEM; n = 8, two experiments).
Figure 6
Figure 6
Analysis of vaccinated donor antibody response (A and B) Flow cytometric plots showing gating strategy to identify plasmablasts in total PBMC sample collected on day 7 after second vaccine dose (top panel) or identification of plasmablasts after direct enrichment from whole blood at the same time point using negative selection with paramagnetic beads (bottom panel). Blue arrow indicates enriched plasmablasts that were used for ELISpot analysis as in (B), and red arrow indicates plasmablasts (DAPICD19loCD27hiCD38hi) that were FACS sorted for single-cell secretion and paired antibody sequencing studies. (C) ELISpot analysis of SARS-CoV-2 S6Pecto-specific antibody secretion using enriched plasmablasts from blood collected on day 10 after the first vaccine dose (IgG) and day 7 after the second vaccine dose (IgG and IgA). A/Darwin/42/2020 H1N1 influenza virus hemagglutinin (HA) was used as a control for specificity of the plasmablast response. Wells with spots (left) and number of SARS-CoV-2 S6Pecto-specific responses detected (right) are shown. Dotted line indicates values below limit of the detection (LOD = 10 spots per 104 cells), which were set up to 5 spots per 104 cells. (D) Pie chart representation showing frequency of RBD and SARS-COV-2 S6Pecto reactive (red), SARS-COV-2 S6Pecto reactive only (green), or RBD reactive only (blue) plasmablasts identified as in (C). Fraction of cells that did not react to either SARS-COV-2 RBD or S6Pecto is shown in gray. (E) Flow-cytometry-sorted plasmablasts were loaded on a Beacon instrument and assessed for binding to S6Pecto or RBD-coated beads using single-cell antibody secretion analysis. Bright-field images of the Beacon instrument chip with individual plasmablasts loaded into the pens of the chip are shown for the selected fields of view for each screening condition (top). False-color fluorescent images from the same fields of view (bottom) showing binding of the detection anti-human Alexa Fluor 568-labeled antibody to the S6Pecto or RBD-coated beads that captured human antibodies secreted by single plasmablasts (visualized as a plume from the beads that loaded into the channel of the chip). Arrow indicates cells secreting antigen-reactive IgG antibodies. (F) ELISA binding to SARS-CoV-2 S6Pecto of serum from patient 5 at day 0 of first vaccination, day 10 after first vaccination, or day 7 after second vaccination were measured by absorbance at 450 nm. Serum was diluted 1:75 and then diluted serially 3-fold. Experiment was performed in biological replicate and technical triplicate. Biological replicate from representative single experiment is shown, mean ± SD of triplicates is shown. (G) Neutralization curves of serum from patient 5 at day 0 of first vaccination, day 10 after first vaccination, or day 7 after second vaccination. A World Health Organization (WHO) International standard for anti-SARS-CoV-2 human immunoglobulin was used as the positive control. Serum was diluted starting at a 1:25 dilution, then diluted serially 2-fold. Experiment was performed in technical triplicate. (H) Circos plot indicating public clonotypes identified in this paper. The more opaque ribbons within the circle represent public clonotypes that are shared between the vaccinated donor and convalescent donors after natural infection. Translucent ribbons indicate public clonotypes shared between convalescent infection individuals. The individuals from whom sequences were derived are indicated on the inner circle. The published sources from which the sequences were obtained are shown on the second circle. The outside circle indicates whether the individuals were naturally infected or vaccinated.
Figure 7
Figure 7
Identification of public clonotypes shared between naturally infected individuals and a vaccinated donor Table showing all public clonotypes identified. Gene usage for each clone or CDRH3 length is shown in columns 2 or 3. Reactivity profiles obtained from published sources are shown for comparative purposes. Blue indicates positive reactivity, while white indicates that binding reactivity or neutralization was not detected. Gray indicates reactivity profile was not found in either publication and therefore is unknown. Isotypes of antibodies in each group are listed in the eighth column. If the group contained sequences from both vaccinated and infected individuals, it was denoted in yellow. White was used for clonotypes that were shared only between convalescent individuals following natural infection.

Update of

Similar articles

Cited by

References

    1. Anderson E.M., Goodwin E.C., Verma A., Arevalo C.P., Bolton M.J., Weirick M.E., Gouma S., McAllister C.M., Christensen S.R., Weaver J., UPenn COVID Processing Unit Seasonal human coronavirus antibodies are boosted upon SARS-CoV-2 infection but not associated with protection. Cell. 2021;184:1858–1864.e10. - PMC - PubMed
    1. Bailey J.R., Flyak A.I., Cohen V.J., Li H., Wasilewski L.N., Snider A.E., Wang S., Learn G.H., Kose N., Loerinc L. Broadly neutralizing antibodies with few somatic mutations and hepatitis C virus clearance. JCI Insight. 2017;2:92872. - PMC - PubMed
    1. Bepler T., Kelley K., Noble A.J., Berger B. Topaz-Denoise: gen- eral deep denoising models for cryoEM and cryoET. Nat. Commun. 2020;11:5208. - PMC - PubMed
    1. Bepler T., Morin A., Rapp M., Brasch J., Shapiro L., Noble A.J., Berger B. Positive-unlabeled convolutional neural networks for particle picking in cryo-electron micrographs. Nat. Methods. 2019;16:1153–1160. - PMC - PubMed
    1. Bosch B.J., van der Zee R., de Haan C.A., Rottier P.J. The coronavirus spike protein is a class I virus fusion protein: structural and functional characterization of the fusion core complex. J. Virol. 2003;77:8801–8811. - PMC - PubMed

LinkOut - more resources