. 2021 Aug 20;373(6557):926-931.
doi: 10.1126/science.abj0089.

Malaria infection and severe disease risks in Africa

Affiliations

Malaria infection and severe disease risks in Africa

Robert S Paton et al. Science. .

Abstract

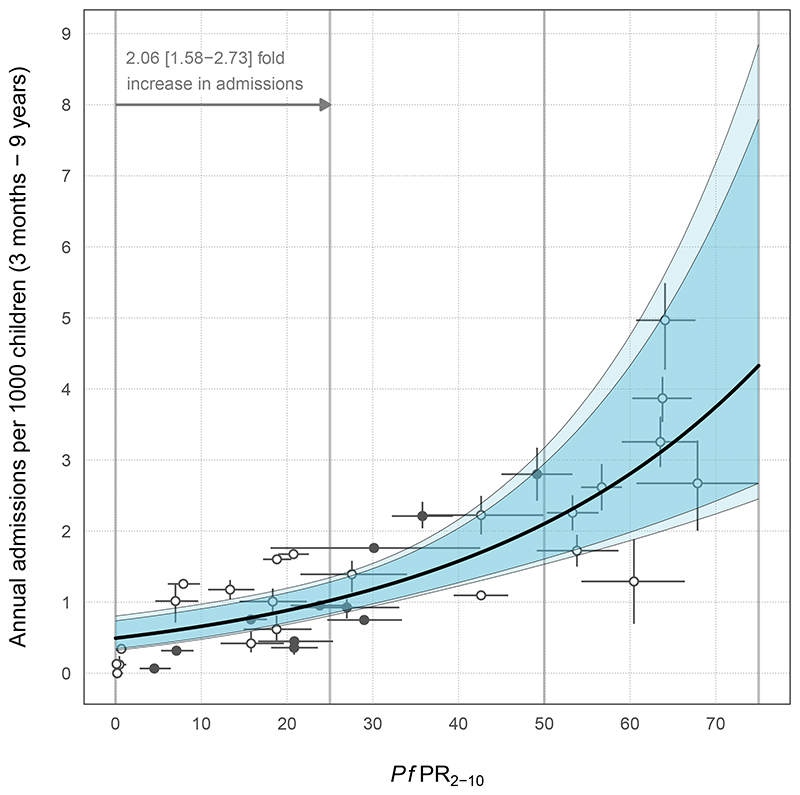
The relationship between community prevalence of Plasmodium falciparum and the burden of severe, life-threatening disease remains poorly defined. To examine the three most common severe malaria phenotypes from catchment populations across East Africa, we assembled a dataset of 6506 hospital admissions for malaria in children aged 3 months to 9 years from 2006 to 2020. Admissions were paired with data from community parasite infection surveys. A Bayesian procedure was used to calibrate uncertainties in exposure (parasite prevalence) and outcomes (severe malaria phenotypes). Each 25% increase in prevalence conferred a doubling of severe malaria admission rates. Severe malaria remains a burden predominantly among young children (3 to 59 months) across a wide range of community prevalence typical of East Africa. This study offers a quantitative framework for linking malaria parasite prevalence and severe disease outcomes in children.


Conflict of interest statement

Competing interests

The authors declare no competing interests.

Figures

Figure 1
Figure 1. Relationship between the rate of admissions of severe malaria (combination of severe malaria anaemia, respiratory distress and cerebral malaria) and community parasite prevalence (PfPR2-10).
The median fit for the Bayesian regression model is denoted by the thick black line, with 95% and 99% highest density intervals in dark and light blue, respectively. Gray points and vertical 95% HDIs denote the model-estimated admission rates; intervals were not plotted for site periods in which a formal diagnoses of malaria phenotypes were available for all patients. The conditions of admitted malaria patients without a specific diagnosis of SMA, RD, or CM were stochastically diagnosed in submodels on the basis of other indicative symptoms. Horizontal intervals represent the uncertainty in parasite prevalence calculated from a model that age-standardizes parasite prevalence to the 2-to-10-year age range while accounting for sample size and correcting for the diagnostic method (corrected rapid diagnostic test (RDT) surveys are indicated by closed points, microscopy by open circles).
Figure 2
Figure 2. Relationship between the admission rate of individual severe malaria phenotypes and community-based parasite prevalence.
Median regression model fits are denoted by the thick black line, with 95% and 99% highest density intervals in dark and light blue, respectively. (A) Nonlinear relationship between rates of SMA and PfPR2-10. (B) shows the log-linear relationship between rates of RD and PfPR2-10. (C) constant rate of CM for all values of PfPR2-10. We modelled uncertainty in the admission rates of severe malaria anaemia and respiratory distress using a method akin to that used for the composite measure in Fig. 1. Because there were no alternative definitions of CM, uncertainty in admission rates was not considered (and therefore no vertical intervals were present). Uncertainty in community parasite prevalence was standardized to the 2-to-10-year age range, with a further correction for diagnostic method (corrected RDT surveys are shown as closed points, microscopy as open points).
Figure 3
Figure 3. Changes in age-specific admission rate per 1000 children p.a. of severe malaria phenotypes with parasite prevalence.
(A) Prediction surface for the model estimated rates of severe malaria for each month of childhood between 3 months and 9 years The white arrow and 95% highest density intervals show the estimated increase in the most frequent age of admission with decreasing parasite prevalence. The dark blue rectangle denotes the estimated cutoff below a parasite rate of ~ 15.9% (14.1 to17.6), below which admissions are relatively rare and can be adequately described as stochastic outcomes with age. It should be noted that this cutoff is sensitive to the amount of data available to characterise the age distribution of rare events; it is possible that our dataset lacks the requisite sensitivity to detect age dependence in severe malaria admissions at lower parasite rates. The most frequent age of admission increases with parasite prevalence, whereas the concomitant reductions in malaria incidence largely offset the shift of the burden onto other age classes. For each 25% increase in community PfPR2-10, the age-dependent model predicted a doubling of admissions (2.05; HDI: 1.62 to 2.65); this agrees with the estimated increase for the age invariant model (2.06; HDI: 1.58 to 2.73). (B) The surface shown in (A) is presented as binned community parasite prevalence, including the associated 95% HDIs. The age dependence in admissions of severe malaria was modelled as a continuous process using a gamma distribution; the same diagnostic and community parasite rate submodels used in the age invariant model were also used here. A random effect for each site (on the admission rate) helped to account for sites with anomalously high or low rates of severe malaria for the corresponding estimate of community parasite prevalence.

Comment in

  • Tracking severe malaria disease.
    Taylor T, Slutsker L. Taylor T, et al. Science. 2021 Aug 20;373(6557):855-856. doi: 10.1126/science.abk3443. Science. 2021. PMID: 34413225 No abstract available.

References

    1. Murray CJ, et al. Global malaria mortality between 1980 and 2010: a systematic analysis. Lancet. 2012;379:413–431. doi: 10.1016/S0140-6736(12)60034-8. - DOI - PubMed
    1. Streatfield PK, et al. Malaria mortality in Africa and Asia: evidence from INDEPTH health and demographic surveillance system sites. Glob Health Action. 2014;7:25369. doi: 10.3402/gha.v7.25369. - DOI - PMC - PubMed
    1. Weiss DJ, et al. Mapping the global prevalence, incidence, and mortality of Plasmodium falciparum, 2000-17: a spatial and temporal modelling study. Lancet. 2019;394:322–331. doi: 10.1016/S0140-6736(19)31097-9. - DOI - PMC - PubMed
    1. Herrera S, et al. A systematic review and synthesis of the strengths and limitations of measuring malaria mortality through verbal autopsy. Malar J. 2017;16:421. doi: 10.1186/s12936-017-2071-x. - DOI - PMC - PubMed
    1. White N, Dondorp A, Faiz A, Mishra S, Hien T. New global estimates of malaria deaths. Lancet. 2012;380:559–560. doi: 10.1016/S0140-6736(12)61321-X. - DOI - PubMed

Publication types