. 2021 Aug 19;12(1):5049.
doi: 10.1038/s41467-021-25175-5.

The MURAL collection of prostate cancer patient-derived xenografts enables discovery through preclinical models of uro-oncology

Affiliations

The MURAL collection of prostate cancer patient-derived xenografts enables discovery through preclinical models of uro-oncology

Gail P Risbridger et al. Nat Commun. .

Abstract

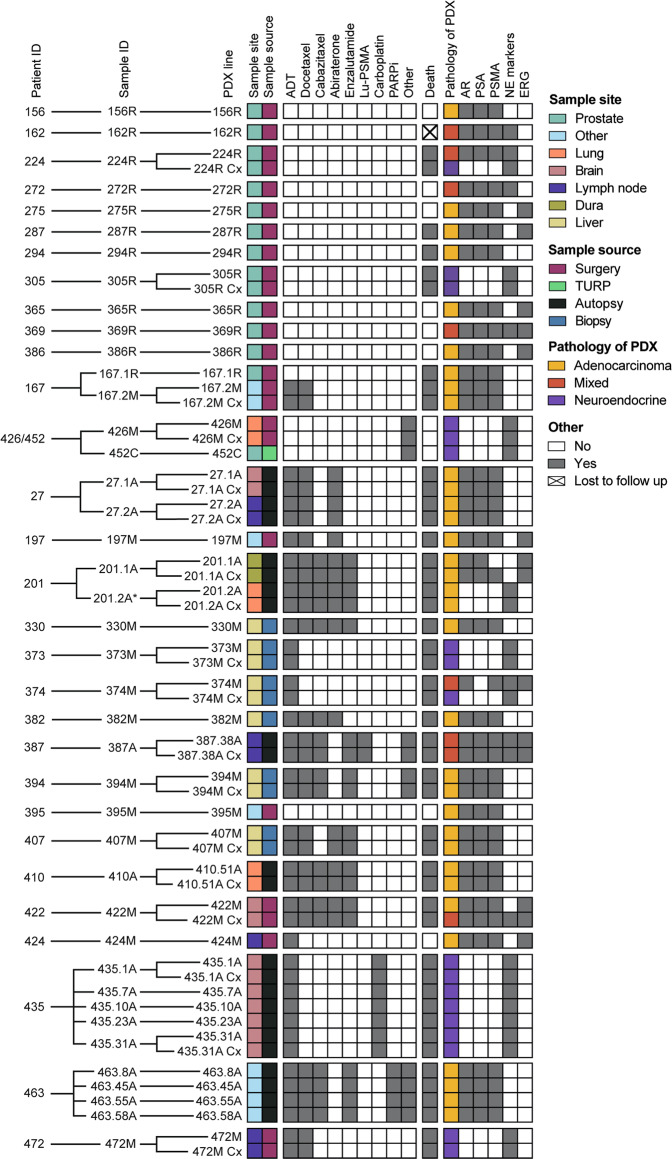
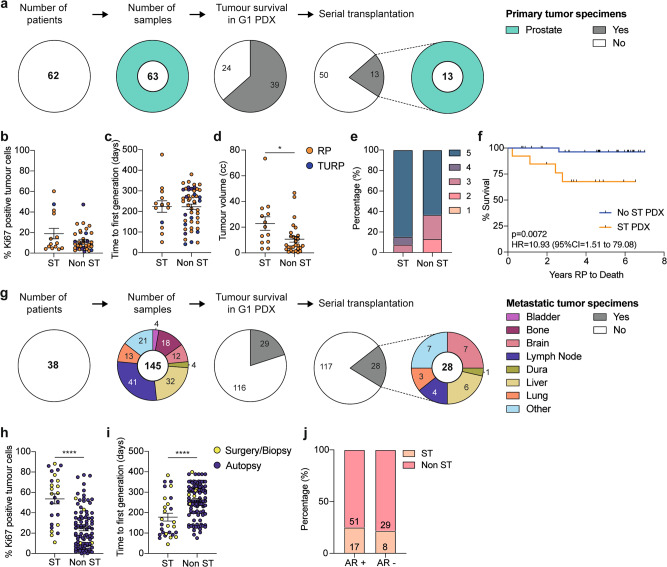
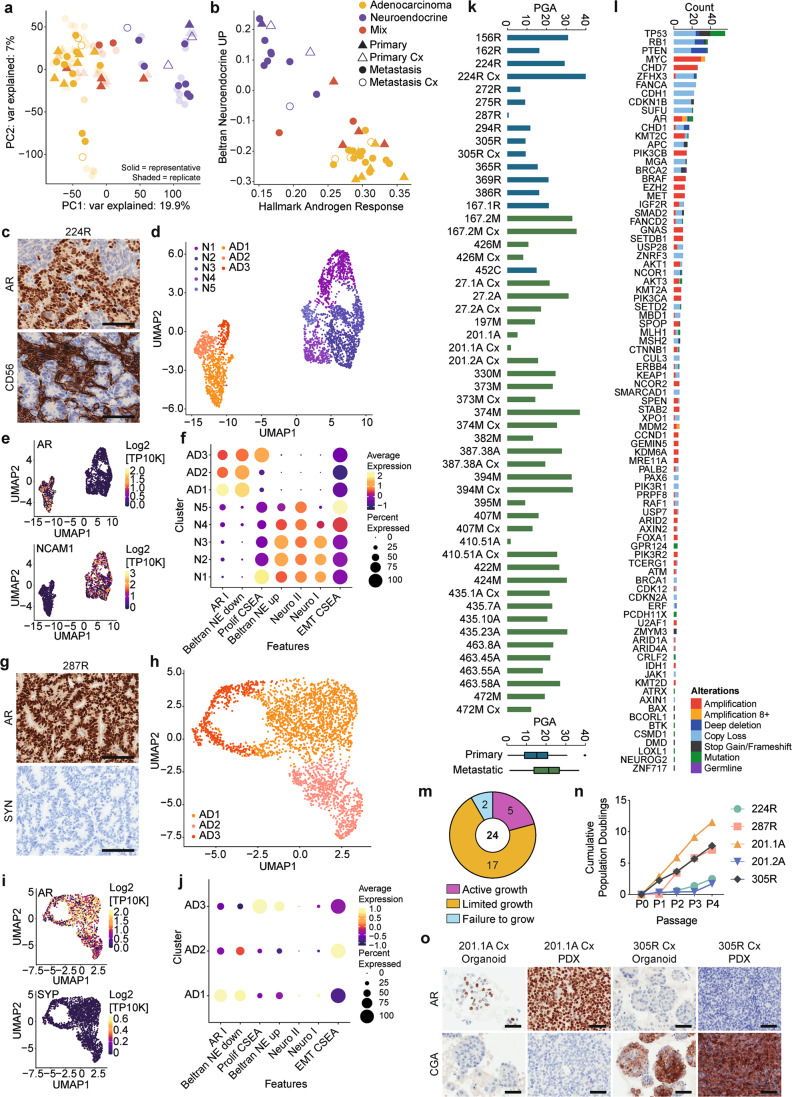
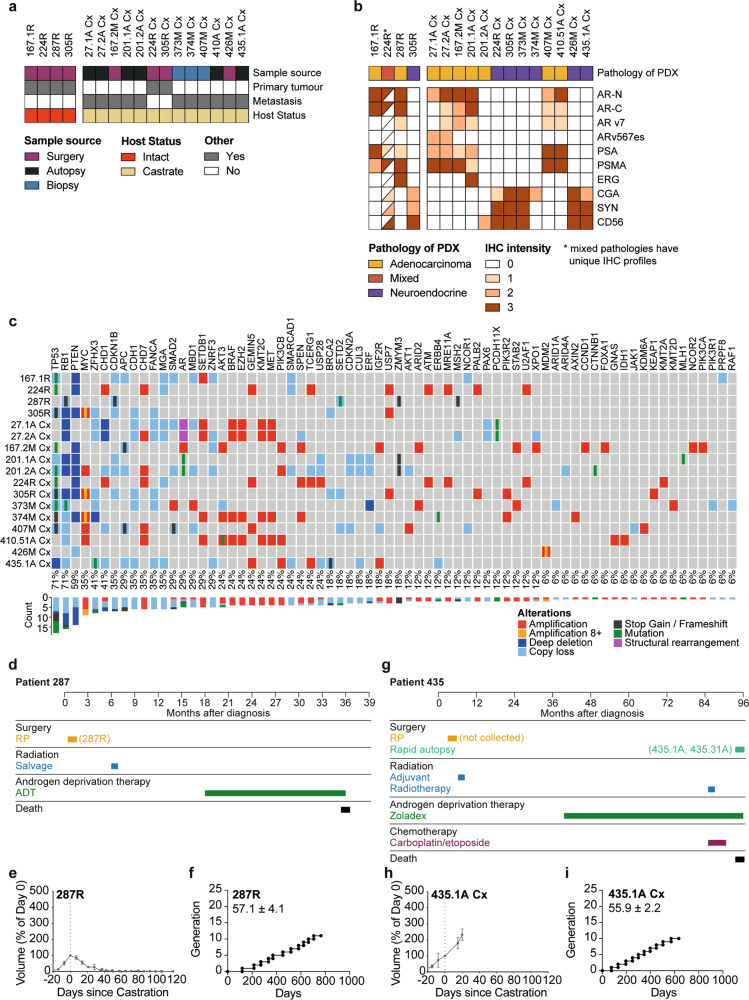
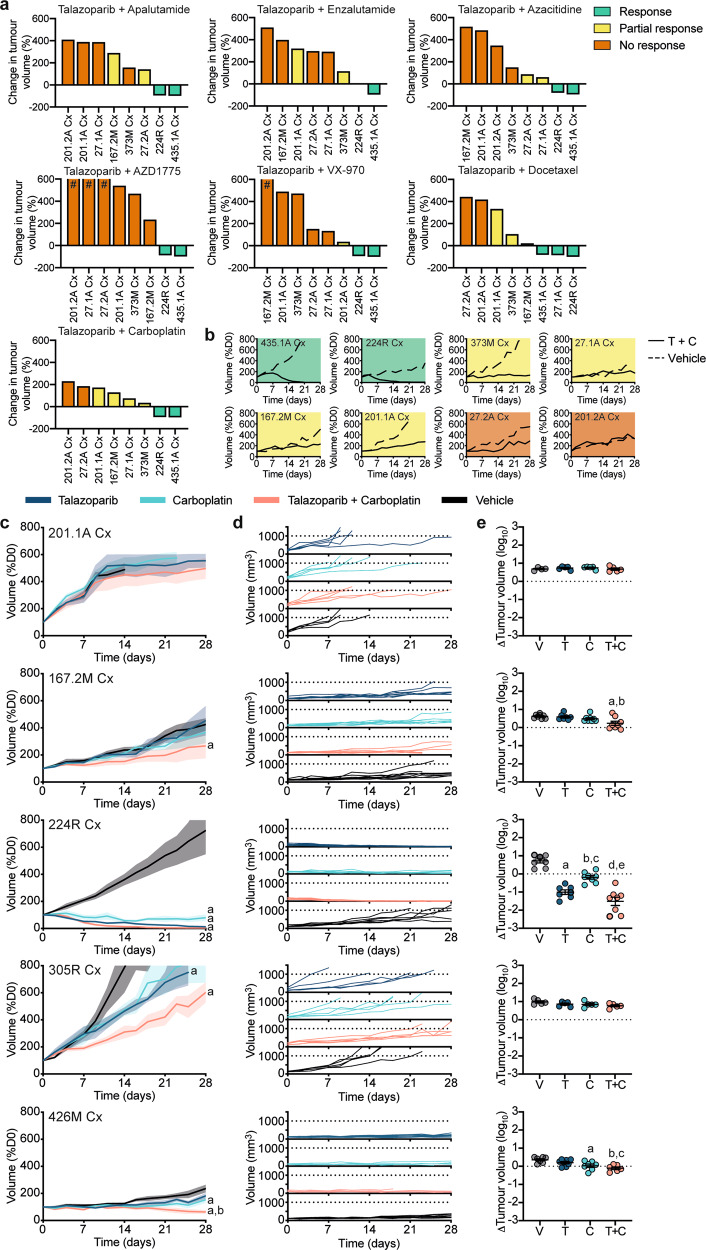
Preclinical testing is a crucial step in evaluating cancer therapeutics. We aimed to establish a significant resource of patient-derived xenografts (PDXs) of prostate cancer for rapid and systematic evaluation of candidate therapies. The PDX collection comprises 59 tumors collected from 30 patients between 2012-2020, coinciding with availability of abiraterone and enzalutamide. The PDXs represent the clinico-pathological and genomic spectrum of prostate cancer, from treatment-naïve primary tumors to castration-resistant metastases. Inter- and intra-tumor heterogeneity in adenocarcinoma and neuroendocrine phenotypes is evident from bulk and single-cell RNA sequencing data. Organoids can be cultured from PDXs, providing further capabilities for preclinical studies. Using a 1 x 1 x 1 design, we rapidly identify tumors with exceptional responses to combination treatments. To govern the distribution of PDXs, we formed the Melbourne Urological Research Alliance (MURAL). This PDX collection is a substantial resource, expanding the capacity to test and prioritize effective treatments for prospective clinical trials in prostate cancer.


Conflict of interest statement

G.P.R., R Taylor and M.G.L. (Research collaborations: Pfizer, Astellas, Zenith Epigenetics; non-financial); A.A.A. (Speakers Bureau: Astellas, Janssen, Novartis, Amgen, Ipsen, Bristol Myers Squibb; Merck Serono, Bayer; Honoraria: Astellas, Novartis, Sanofi, AstraZeneca, Tolmar, Telix, Merck Serono, Janssen, Bristol Myers Squibb, Ipsen, Bayer, Pfizer, Amgen, Noxopharm, Merck Sharpe Dome; Scientific Advisory Board: Astellas, Novartis, Sanofi, AstraZeneca, Tolmar, Pfizer, Telix, Merck Serono, Janssen, Bristol Myers Squibb, Ipsen, Bayer, Merck Sharpe Dome, Amgen, Noxopharm; Travel + Accommodation: Astellas, Merck Serono, Amgen, Novartis, Janssen, Tolmar, Pfizer; Investigator Research Funding: Astellas, Merck Serono, AstraZeneca; Institutional Research Funding: Bristol Myers Squibb, AstraZeneca, Aptevo Therapeutics, Glaxo Smith Kline, Pfizer, MedImmune, Astellas, SYNthorx, Bionomics, Sanofi Aventis, Novartis, Ipsen); D.P. (Honoraria: Astellas, Ipsen, Novartis; Advisory/Consulting: Pfizer, Merck Sharp & Dhome, Bristol-Myers Squibb; Research Funding to institution: Medivation, Bristol-Myers Squibb, Merck Sharp & Dhome, Exelixis, Pfizer, Astellas, Bayer, SymVivo, Amgen; Travel: Bristol-Myers Squibb, Pfizer, Amgen); C.J.P. (Honoraria: Advanced Accelerator Applications, Astellas, AstraZeneza, Janssen, Pfizer; Travel support: Bayer, Janssen); S.S. (Grant funding to institution: AstraZeneca, Novartis, Amgen, Genentech, Merck Sharp and Dohme, Merck Serono; Honoraria: Merck Sharp and Dohme, Astra Zeneca and Bristol Myer Squibb); E.M.K. (Consulting or Advisory Role: Astellas Pharma, Janssen, Ipsen; Travel, Accommodations, Expenses: Astellas Pharma, Pfizer, Ipsen, Roche; Honoraria: Janssen, Ipsen, Astellas Pharma, Research Review; Research Funding: Astellas Pharma (institutional), AstraZeneca (institutional)); J Grummet (Honoraria: BK Ultrasound, Biobot, Mundipharma; Travel: Astellas; Owner of MRI PRO Pty Ltd., an online training platform)); L.F. (Grant funding to institution: Pimera). All other authors declare no competing interests.

Figures

Fig. 1
Fig. 1. MURAL Prostate Cancer PDX collection.
Heatmap summarising 59 prostate cancer PDXs established from 41 specimens obtained from 30 patients. The sample site, sample source, systemic therapies administered to patients prior to sample collection, clinical outcome at last follow-up, and pathology and biomarker expression of the PDXs are shown. Pathology of the PDXs was determined through histology review by pathologists and expression of phenotypic biomarkers by immunohistochemistry. NE marker staining indicates expression of ≥1 of chromogranin A, synaptophysin, and CD56. Immunohistochemistry results are from the latest PDX generation. *PDX 201.2A and PDX 201.2A-Cx are classified as adenocarcinoma based on pathology review and negative staining for synaptophysin and chromogranin A; however, they have focal staining of CD56. The naming convention for PDXs is a follows: numbers indicate patient ID and tumor site (e.g., 167.1 is patient 167, site 1), letters denote the sample source (R—radical prostatectomy; M—biopsy or surgical sample of metastasis; C— castration-resistant primary tissue; A—autopsy tissue), and Cx denotes subline grown in castrated mice.
Fig. 2
Fig. 2. Pathological and clinical features of tumors used to establish PDXs.
a Pie charts show the number of patients consented and the number of primary prostate tumor samples collected for xenografting compared to the number of samples that maintained tumor tissue in the first generation (G1) PDX and established as serially transplantable (ST) PDXs. Color denotes the site that each sample was taken from. bd The percentage of Ki67-positive tumor cells in pre-grafted tissue (b; n = 14 ST, 38 non ST), time to first generation (c; n = 14 ST, 49 non ST), and tumor volume at surgery for radical prostatectomy (RP; orange) and transurethral resection of the prostate (TURP; purple) specimens (d; n = 13 ST, 28 non ST, P = 0.016) that established ST PDXs compared to those that did not. Unpaired two-sided T test for ST vs non ST; data shown as mean ± SEM. e The percent of primary tumors with a Gleason grade group of 1–5 that did (n = 13) or did not establish ST PDXs (n = 30; not significant, Mann Whitney test comparing the distribution of Gleason grade groups between ST vs non ST). f Kaplan–Meier curve comparing the survival of patients whose RP specimen did (orange; n = 13) or did not (blue; n = 37) establish ST PDXs. P = 0.0072; log rank test; HR = 10.93; 95% CI 1.51 to 79.08. g Pie charts show the number of patients consented and the number of metastatic tumor samples collected for xenografting compared to the number of samples that maintained tumor tissue in the G1 PDX and established as serially transplantable PDXs. Color denotes the site that each sample was taken from. hi The percentage of Ki67-positive tumor cells in pre-grafted tissue (h; n = 25 ST, 94 non ST, P < 0.0001), and time to first generation (i; n = 28 ST, 117 non ST, P <  0.0001) for metastatic tumor samples obtained from surgery/biopsy (yellow) or autopsy (purple) that did or did not establish ST PDXs. Unpaired two-sided T test for ST vs non ST; data shown as mean ± SEM. j The percentage of androgen receptor (AR)-positive and AR-negative metastatic tumors that did (n = 25) or did not establish ST PDXs (n = 80), based on immunohistochemistry for AR in the original tumor tissue. Not significant; Fisher’s exact test. Source data are provided as a Source Data file.
Fig. 3
Fig. 3. Phenotypic and genomic heterogeneity within and between PDXs.
a, b Principle component (PC) analysis of gene expression from RNA sequencing in PDXs grown in testosterone-supplemented (+T; filled symbol) or castrate (Cx; empty symbol) mice. PDXs from metastases are represented by circles, and primary tumors by triangles. PDX pathology is indicated (adenocarcinoma—yellow; neuroendocrine—purple; mixed— red). Representative samples from each PDX are colored symbols (PDXs from primary prostate cancer—triangles, PDXs from metastatic prostate cancer—circles), while replicates are shown as transparent symbols. a PCA plot based on PC1 and PC2, showing the two largest sources of variation in the expression of genes across PDXs. b Plot of gene set enrichment analysis using Singscore to compare Beltran Neuroendocrine Score to Hallmark Androgen Response Score in PDXs. cj Single-cell RNA sequencing reveals intra-tumoral heterogeneity of adenocarcinoma (AD) and neuroendocrine (NE) PDXs. c Representative immunohistochemical staining of PDX 224R for androgen receptor (AR) and NE marker NCAM1 (CD56; scale bars = 100 µM). de UMAP (d) and marker gene expression (e) of PDX 224R showing the presence of 3 AD and 5 NE clusters based on single-cell RNA sequencing. f Dot plot comparing expression of AR, NE gene signatures (Beltran NE, Neuro I, Neuro II), and hallmark signatures (proliferation and epithelial-mesenchymal transition: EMT) across the AD and NE clusters for PDX 224R. g Representative immunohistochemical staining of PDX 287R for AR and synaptophysin (SYN; scale bars = 100 µM). hi UMAP (h) and marker gene expression (i) of PDX 287R showing the presence of 3 AD clusters. j Dot plot comparing expression of AR, NE gene signatures (Beltran NE, NeuroI, NeuroII), and hallmark signatures (proliferation and epithelial-mesenchymal transition: EMT across the AD clusters for PDX 287R. kl Somatic mutation frequency and genomic-landscape analyses based on targeted DNA sequencing. k The percent genome alteration (PGA) in PDXs from testosterone-supplemented and castrated (Cx) host mice from primary (blue) and metastatic (green) samples. l The number of somatic alterations per gene across the PDX cohort. Somatic nucleotide variations with 0.75 or greater allelic frequency are reported (amplification—red; amplification with 8 or more copies—orange; deep deletion—dark blue; copy number loss—light blue (i.e. fewer copies than baseline ploidy); stop gains and frameshift mutations—black; missense mutation—green; germline mutation—purple). mo Phenotypic heterogeneity is maintained in organoids established from PDXs. m Pie chart showing the growth of 24 PDXs as organoids (active: increased population doublings ≥4 passages (purple); limited: growth/survival for ≤3 passages (orange); failure: poor growth (blue)). n Cumulative population doublings population doublings of organoids organoids across passages. Source data are provided as a Source Data file. o Representative immunohistochemical staining for AR and chromogranin A (CgA) in PDX tissue and organoids from PDX 201.1A-Cx and PDX 305R-Cx (scale bars = 50 µM). For panels with NE markers, the highest expressed marker is shown. Staining is repeated every fifth generation across all PDXs, and for representative organoid cultures.
Fig. 4
Fig. 4. Applying serially transplantable PDXs as ‘research-ready’ models for preclinical testing.
a Heatmap shows sample source (surgery—purple; autopsy—black; biopsy—blue), tumor type (indicated as yes (gray) or no (white)), host mouse status (intact—red; castrate— yellow) of 17 PDXs that have been classified as ‘research-ready’ for preclinical testing based on rapid turnover and subcutaneous growth in host mice. b Heatmap shows pathology (adenocarcinoma—yellow; neuroendocrine—purple; mixed—red) and immunohistochemistry (IHC) analysis of the research-ready PDXs (staining intensity indicated as 0, 1, 2, 3 and depicted as a gradient of brown coloring). Half-filled squares indicate mixed IHC staining in PDX 224R due to mixed adenocarcinoma and neuroendocrine pathology. c Summary of key somatic alterations in research-ready PDXs based on targeted DNA sequencing. The percent of PDXs with alterations in individual genes are shown. The bar plot shows the number of alterations observed in individual genes across the PDX cohort. Somatic nucleotide variations with 0.75 or greater allelic frequency are reported (amplification with three or more copies—red; amplification with eight or more copies—yellow; deep deletion—dark blue; copy loss—light blue; stop gains and frameshift mutations—black; missense mutation—green; structural rearrangements—pink). d Treatment timeline from diagnosis to death for patient 287. e Tumor volume, presented as a percent change in tumor volume from castration (day 0; n = 6 grafts) and f growth trajectory of PDX 287R. The average time per generation is 57.1 ± 4.1 days for PDX 287R in testosterone-supplemented host mice. g Treatment timeline from diagnosis to death for patient 435. h Tumor volume, presented as a percent change in tumor volume from castration (day 0; n = 3 grafts) and i growth trajectory of PDX 435.1A-Cx. The average time per generation is 55.9 ± 2.2 days for PDX 435.1A-Cx in castrate host mice. e, h Grafts were established subcutaneously in testosterone-supplemented mice until tumor volume reached 200 mm3, at which point host mice were castrated (n = 2–4 grafts; data shown as mean ± SEM). f, i Each data point represents a different generation with a ≥10-fold increase in tumor volume.
Fig. 5
Fig. 5. Preclinical testing of combination therapies in serially transplantable PDXs.
a Waterfall plots of the response of eight research-ready PDXs to talazoparib combination therapies using the one animal per model per treatment (1 × 1 × 1) approach after up to 28 days of treatment. Data presented as the percent change in tumor volume compared to day 0 of treatment (%D0), with a good response shown in green (tumor volume regressed to <100% of starting volume), a partial response shown in yellow (tumor volume between 100–300% of starting volume and ≤50% volume of matched vehicle) and no response shown in orange (tumor volume >300% of starting volume), # tumor volume increases over 600% are not represented. (b) Graphs show tumor volume (%D0) for PDXs treated with vehicle (dotted line) or talazoparib (T) and carboplatin (C) combination therapy (solid line) for up to 28 days using the 1 × 1 × 1 approach (response—green; partial response—yellow; no response— orange). ce Expansion of talazoparib and carboplatin combination therapy in five PDXs. Mice were treated for up to 28 days with vehicle (V; black; n = 6–8 grafts), 0.33 mg/kg talazoparib (T; dark blue; n = 6–8 grafts), 50 mg/kg carboplatin (C; light blue; n = 6–8 grafts) or talazoparib and carboplatin (T + C; pink; n = 6–8 grafts). Graphs show (c) tumor volume (%D0) for treatment groups (mean ± SEM; aP < 0.05 compared to vehicle, bP < 0.05 compared to talazoparib; linear mixed model analysis with a test of simple main effects, exact P values listed in Supplementary Data 8), d tumor volume (mm3) for individual animals; and, e fold change in tumor volume from day 0 to end of treatment (mean ± SEM; PDX 167.2M Cx—aP = 0.0063 compared to vehicle, bP = 0.0181 compared to talazoparib; PDX 224R-Cx—a,dP < 0.0001 compared to vehicle, bP = 0.0012 compared to vehicle, cP = 0.0047 compared to talazoparib and eP < 0.0001 compared to carboplatin; PDX 426M-Cx—aP = 0.0196 compared to vehicle, bP = 0.0013 compared to vehicle and cP = 0.0358 compared to talazoparib; one-way ANOVA with post hoc Tukey’s test). Source data are provided as a Source Data file.
Fig. 6
Fig. 6. Sharing and distribution of the MURAL PDX collection.
MURAL is a PDX biospecimen resource that is available for collaborative, investigator-led research. This schematic shows the organisation of MURAL, with four working sub-committees that are overseen by an executive committee. Resources available from MURAL include PDX tumors, tissue samples, tissue microarrays (TMAs), organoids, DNA/RNA profiles, and clinical data.

Comment in

References

    1. Gao H, et al. High-throughput screening using patient-derived tumor xenografts to predict clinical trial drug response. Nat. Med. 2015;21:1318–1325. doi: 10.1038/nm.3954. - DOI - PubMed
    1. Evrard YA, et al. Systematic establishment of robustness and standards in patient-derived xenograft experiments and analysis. Cancer Res. 2020;80:2286–2297. doi: 10.1158/0008-5472.CAN-19-3101. - DOI - PMC - PubMed
    1. Byrne AT, et al. Interrogating open issues in cancer precision medicine with patient-derived xenografts. Nat. Rev. Cancer. 2017;17:254. doi: 10.1038/nrc.2016.140. - DOI - PubMed
    1. Gillessen S, et al. Management of patients with advanced prostate cancer: the report of the Advanced Prostate Cancer Consensus Conference APCCC 2017. Eur. Urol. 2018;73:178–211. doi: 10.1016/j.eururo.2017.06.002. - DOI - PubMed
    1. Davis ID, et al. Enzalutamide with standard first-line therapy in metastatic prostate cancer. N. Engl. J. Med. 2019;381:121–131. doi: 10.1056/NEJMoa1903835. - DOI - PubMed

Publication types

MeSH terms