Spatial regression and geostatistics discourse with empirical application to precipitation data in Nigeria
- PMID: 34413350
- PMCID: PMC8377089
- DOI: 10.1038/s41598-021-96124-x
Spatial regression and geostatistics discourse with empirical application to precipitation data in Nigeria
Abstract
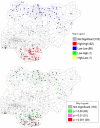
In this study, we propose a robust approach to handling geo-referenced data and discuss its statistical analysis. The linear regression model has been found inappropriate in this type of study. This motivates us to redefine its error structure to incorporate the spatial components inherent in the data into the model. Therefore, four spatial models emanated from the re-definition of the error structure. We fitted the spatial and the non-spatial linear model to the precipitation data and compared their results. All the spatial models outperformed the non-spatial model. The Spatial Autoregressive with additional autoregressive error structure (SARAR) model is the most adequate among the spatial models. Furthermore, we identified the hot and cold spot locations of precipitation and their spatial distribution in the study area.
© 2021. The Author(s).
Conflict of interest statement
The authors declare no competing interests.
Figures


References
-
- Larrabee B, Scott HM, Bello NM. Ordinary least squares regression of ordered categorical data: inferential implications for practice. J. Agric. Biol. Environ. Stat. 2014;19:373–386. doi: 10.1007/s13253-014-0176-z. - DOI
-
- Tobler WR. Philosophy in Geography. Springer; 1979. pp. 379–386.
-
- Anees MT, Abdullah K, Nawawi MNM, Ab Rahman NNN, Piah ARM, Syakir MI, Khan MMA, Omar AKM. Spatial estimation of average daily precipitation using multiple linear regression by using topographic and wind speed variables in tropical climate. J. Environ. Eng. Landsc. Manag. 2018;26(4):299–316. doi: 10.3846/jeelm.2018.6337. - DOI
-
- Satagopan J, Rajagopalan B. Comparing spatial estimation techniques for precipitation analysis. In: Hipel KW, McLeod AI, Panu US, Singh VP, editors. Stochastic and Statistical Methods in Hydrology and Environmental Engineering Water Science and Technology Library. Dordrecht: Springer; 1994.
-
- Olubusoye OE, Okunlola OA, Korter GO. Estimating bias of omitting spatial effect in spatial autoregressive (SAR) model. Inter. J. Stat. Appl. 2015;5:150–156.
Publication types
LinkOut - more resources
Full Text Sources

