. 2021 Aug 19;4(1):989.
doi: 10.1038/s42003-021-02492-5.

Adaptive optimization of the OXPHOS assembly line partially compensates lrpprc-dependent mitochondrial translation defects in mice

Collaborators, Affiliations

Adaptive optimization of the OXPHOS assembly line partially compensates lrpprc-dependent mitochondrial translation defects in mice

Alexanne Cuillerier et al. Commun Biol. .

Abstract

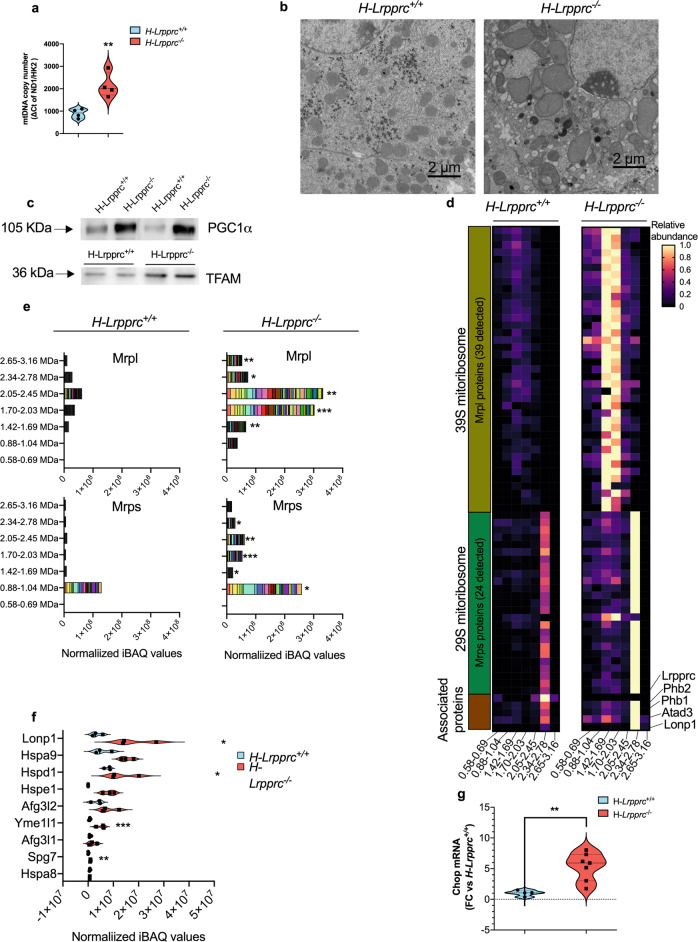
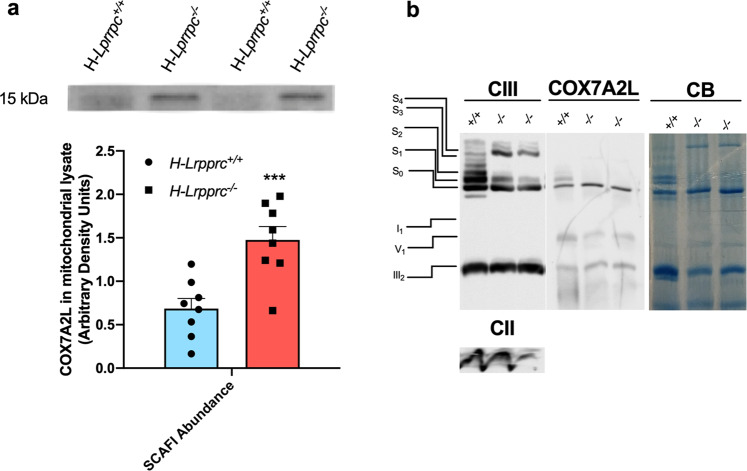
Mouse models of genetic mitochondrial disorders are generally used to understand specific molecular defects and their biochemical consequences, but rarely to map compensatory changes allowing survival. Here we took advantage of the extraordinary mitochondrial resilience of hepatic Lrpprc knockout mice to explore this question using native proteomics profiling and lipidomics. In these mice, low levels of the mtRNA binding protein LRPPRC induce a global mitochondrial translation defect and a severe reduction (>80%) in the assembly and activity of the electron transport chain (ETC) complex IV (CIV). Yet, animals show no signs of overt liver failure and capacity of the ETC is preserved. Beyond stimulation of mitochondrial biogenesis, results show that the abundance of mitoribosomes per unit of mitochondria is increased and proteostatic mechanisms are induced in presence of low LRPPRC levels to preserve a balance in the availability of mitochondrial- vs nuclear-encoded ETC subunits. At the level of individual organelles, a stabilization of residual CIV in supercomplexes (SCs) is observed, pointing to a role of these supramolecular arrangements in preserving ETC function. While the SC assembly factor COX7A2L could not contribute to the stabilization of CIV, important changes in membrane glycerophospholipid (GPL), most notably an increase in SC-stabilizing cardiolipins species (CLs), were observed along with an increased abundance of other supramolecular assemblies known to be stabilized by, and/or participate in CL metabolism. Together these data reveal a complex in vivo network of molecular adjustments involved in preserving mitochondrial integrity in energy consuming organs facing OXPHOS defects, which could be therapeutically exploited.


Conflict of interest statement

The authors declare no competing interests.

Figures

Fig. 1
Fig. 1. Impact of LRPPRC deficiency on mitochondrial biogenesis, mitochondrial ribosome content, and proteostatic systems.
a mitochondrial DNA copy number measured in whole liver homogenates from of H-Lrpprc+/+ and H-Lrpprc−/− mice at 5 weeks of age. Values represent means ± sem of the ND1/HK2 ΔCt ratio (n = 4). Student T-test was used to assess significance (**P < 0.01). b Transmission Electron Micrographs of H-Lrpprc+/+ and H-Lrpprc−/− livers at 5 weeks of age (magnification 1900x). c PGC1α and TFAM protein expression in whole liver homogenates from H-Lrpprc+/+ and H-Lrpprc−/− mice. d, e Proteomic profiling of Large 39 S and Small 29 S mitochondrial ribosomal proteins (MRPL and MRPS proteins) in digitonin-solubilized mitochondria from H-Lrpprc+/+ and H-Lrpprc−/− mice following separation by hybrid CN/BN-PAGE. The heatmap (d) represents the average abundance (n = 3 per group) of individual ribosomal protein in each of the gel bands analyzed relative to the maximal abundance observed for this protein in all samples analyzed. Each lane represents an individual subunit, and the range of molecular weight covered by each band is indicated at the bottom. To represent the abundance of mitoribosomes, iBAQ intensities for all of the large and small ribosomal subunits detected in each band were summed for each experimental replicate and the average values obtained for each genotype is presented in stacked histograms (e). f Total abundance of selected mitochondrial proteases in digitonin-solubilized mitochondria from H-Lrpprc+/+ and H-Lrpprc−/− mice. For a given protein, total abundance in a sample was calculated by summing the normalized iBAQ intensities observed in each band analyzed. Values presented represent the mean ± sem for n = 3 in each group. Validation immunoblots for selected proteases are shown in Fig. S1. One sample T test corrected for multiple comparisons were performed to assess significance (***Q < 0.01, **Q < 0.01, * Q < 0.05). g transcript level of Chop normalized to Tbp as a housekeeping gene in whole liver homogenates from H-Lrpprc+/+ (n = 4) and H-Lrpprc−/− (n = 7).
Fig. 2
Fig. 2. Impact of LRPPRC deficiency on respiratory chain supercomplexes.
a Representative migration pattern of respiratory chain supercomplexes in digitonin-solubilized mitochondrial extracts from H-Lrpprc+/+ and H-Lrpprc−/− mice resolved by hybrid CN/BN-PAGE. Replicates of the same 3 samples (1 H-Lrpprc+/+ and 2 different H-Lrpprc−/−) were loaded in multiple wells and migrated together. Following electrotransfer, replicate lanes were cut and probed with specific antibodies for CI, CII, CIII, and CIV. OXPHOS complexes and supramolecular assemblies are identified using the standard nomenclature, with numbers in indices indicating the molecular stoichiometry of each OXPHOS complex. Molecular weight ranges indicated on the right correspond to the size of the bands that were excised from a gel ran in parallel for proteomics profiling. Molecular weight calibration was performed using the migration pattern of CI, CII, CIV, and CV as assessed by in-gel activity assays. b Representative migration pattern of CIV-containing supercomplexes in fibroblast mitochondria from controls and LSFC patients revealed by CIV immunostaining. Electrophoresis conditions were similar as in panel (a). c Quantitative analysis of the proportion of CIV present in SCs relative to monomeric CIV in liver mitochondria and patient fibroblasts (n = 3 per group). d Proteomics analysis of respiratory chain supercomplexes. For each complex, a pie chart illustrates the number of subunits reliably identified in the gel bands and the stacked histogram illustrates the mean (n = 3 per group) abundance of complex subunits present in each band analyzed (see Fig. 1f legend for details).
Fig. 3
Fig. 3. Impact of LRPPRC deficiency on supercomplexes assembly factor SCAF1.
a Western blot for quantification of SCAF1 abundance in liver mitochondria lysate (n = 8 per group) with a representative image of the blot. (**p < 0.01, Unpaired t-test). b Representative migration pattern of CIV containing arrangements from digitonin solubilized extracts from H-Lrpprc+/+ and H-Lrpprc−/− mice resolved by hybrid CN/BN-PAGE (n = 2 per group). After electrotransfer, one replicate was probed with antibody for CIII and CII, and the other replicate of the same gel with antibody for SCAF1 (COX7A2L).
Fig. 4
Fig. 4. Impact of LRPPRC deficiency on mitochondrial membrane lipids.
Comprehensive lipidomics of digitonin solubilized mitochondrial extracts (a, b) and targeted data mining of cardiolipin (CL) in digitonin-extracts (c) or isolated mitochondria (d). a Volcano plot from LC-QTOF-based untargeted lipidomics of digitonin solubilized mitochondria from H-Lrpprc+/+ and H-Lrpprc−/− (n = 4 per group). The x axis represents fold changes (FCs) of MS signal intensity values for all these features in H-Lrpprc−/− vs. H-Lrpprc+/+ (log2) and the y axis represents p values (−log10). A corrected p value (Q-value) threshold of 0.05 (corresponding to a P-value of 0.007) and a relative FC of 1.5 were used, leading to 69 significantly discriminant features among the 1176 MS features on which 31 were annotated. b Box plot of 27 selected lipids significantly discriminating H-Lrpprc−/− from H-Lrpprc+/+, and annotated using MS/MS analysis. The midline represents the median fold change vs. H-Lrpprc+/+, the box represents the interquartile range (IQR) between the first and third quartile, and whiskers represent the lowest or highest values. c, d Box plot of CL species annotated by MS/MS analysis in the digitonin-extracts (c) and in isolated mitochondria (d). Differences are shown according to a Q value of 0.056 (corresponding to a P-value of 0.009); (***P < 0.01, **P < 0.01).
Fig. 5
Fig. 5. Impact of LRPPRC deficiency on protein complexes structurally and functionally linked to CL.
Proteomic profiling of ANT (a), MICOS (b), Prohibitin (c), and VDAC (d) complexes in digitonin-solubilized mitochondria from H-Lrpprc+/+ and H-Lrpprc−/− mice following separation by hybrid CN/BN-PAGE. The heatmap represents the average abundance (n = 3 per group) of individual protein within the complex in each of the gel bands analyzed relative to the maximal abundance observed for this protein in all samples analyzed. Each column represents an individual subunit, and the range of molecular weight covered by each band is indicated on the left side. To represent the abundance of ANT, MICOS, Prohibitin, and VDAC, iBAQ intensities for all of the listed proteins forming each complex detected in each band were summed for each experimental replicate and the average values obtained for each genotype is presented in stacked histograms. Values represent the mean ± sem for n = 3 in each group. One sample T tests corrected for multiple comparisons were performed to assess significance (***Q < 0.01, **Q < 0.01, *Q  < 0.05).

References

    1. Murley A, Nunnari J. The emerging network of mitochondria-organelle contacts. Mol. Cell. 2016;61:648–653. doi: 10.1016/j.molcel.2016.01.031. - DOI - PMC - PubMed
    1. Dimauro S, Schon EA. Mitochondrial disorders in the nervous system. Annu. Rev. Neurosci. 2008;31:91–123. doi: 10.1146/annurev.neuro.30.051606.094302. - DOI - PubMed
    1. Rahman S, et al. Leigh syndrome: clinical features and biochemical and DNA abnormalities. Ann. Neurol. 1996;39:343–351. doi: 10.1002/ana.410390311. - DOI - PubMed
    1. Dimauro S. A history of mitochondrial diseases. J. Inherit. Metab. Dis. 2010;34:261–276. doi: 10.1007/s10545-010-9082-x. - DOI - PubMed
    1. Mootha VK, et al. Identification of a gene causing human cytochrome c oxidase deficiency by integrative genomics. Proc. Natl Acad. Sci. 2003;100:605–610. doi: 10.1073/pnas.242716699. - DOI - PMC - PubMed

Publication types

Grants and funding