. 2021 Oct;24(10):1377-1391.
doi: 10.1038/s41593-021-00913-6. Epub 2021 Aug 19.

A human forebrain organoid model of fragile X syndrome exhibits altered neurogenesis and highlights new treatment strategies

Affiliations

A human forebrain organoid model of fragile X syndrome exhibits altered neurogenesis and highlights new treatment strategies

Yunhee Kang et al. Nat Neurosci. 2021 Oct.

Abstract

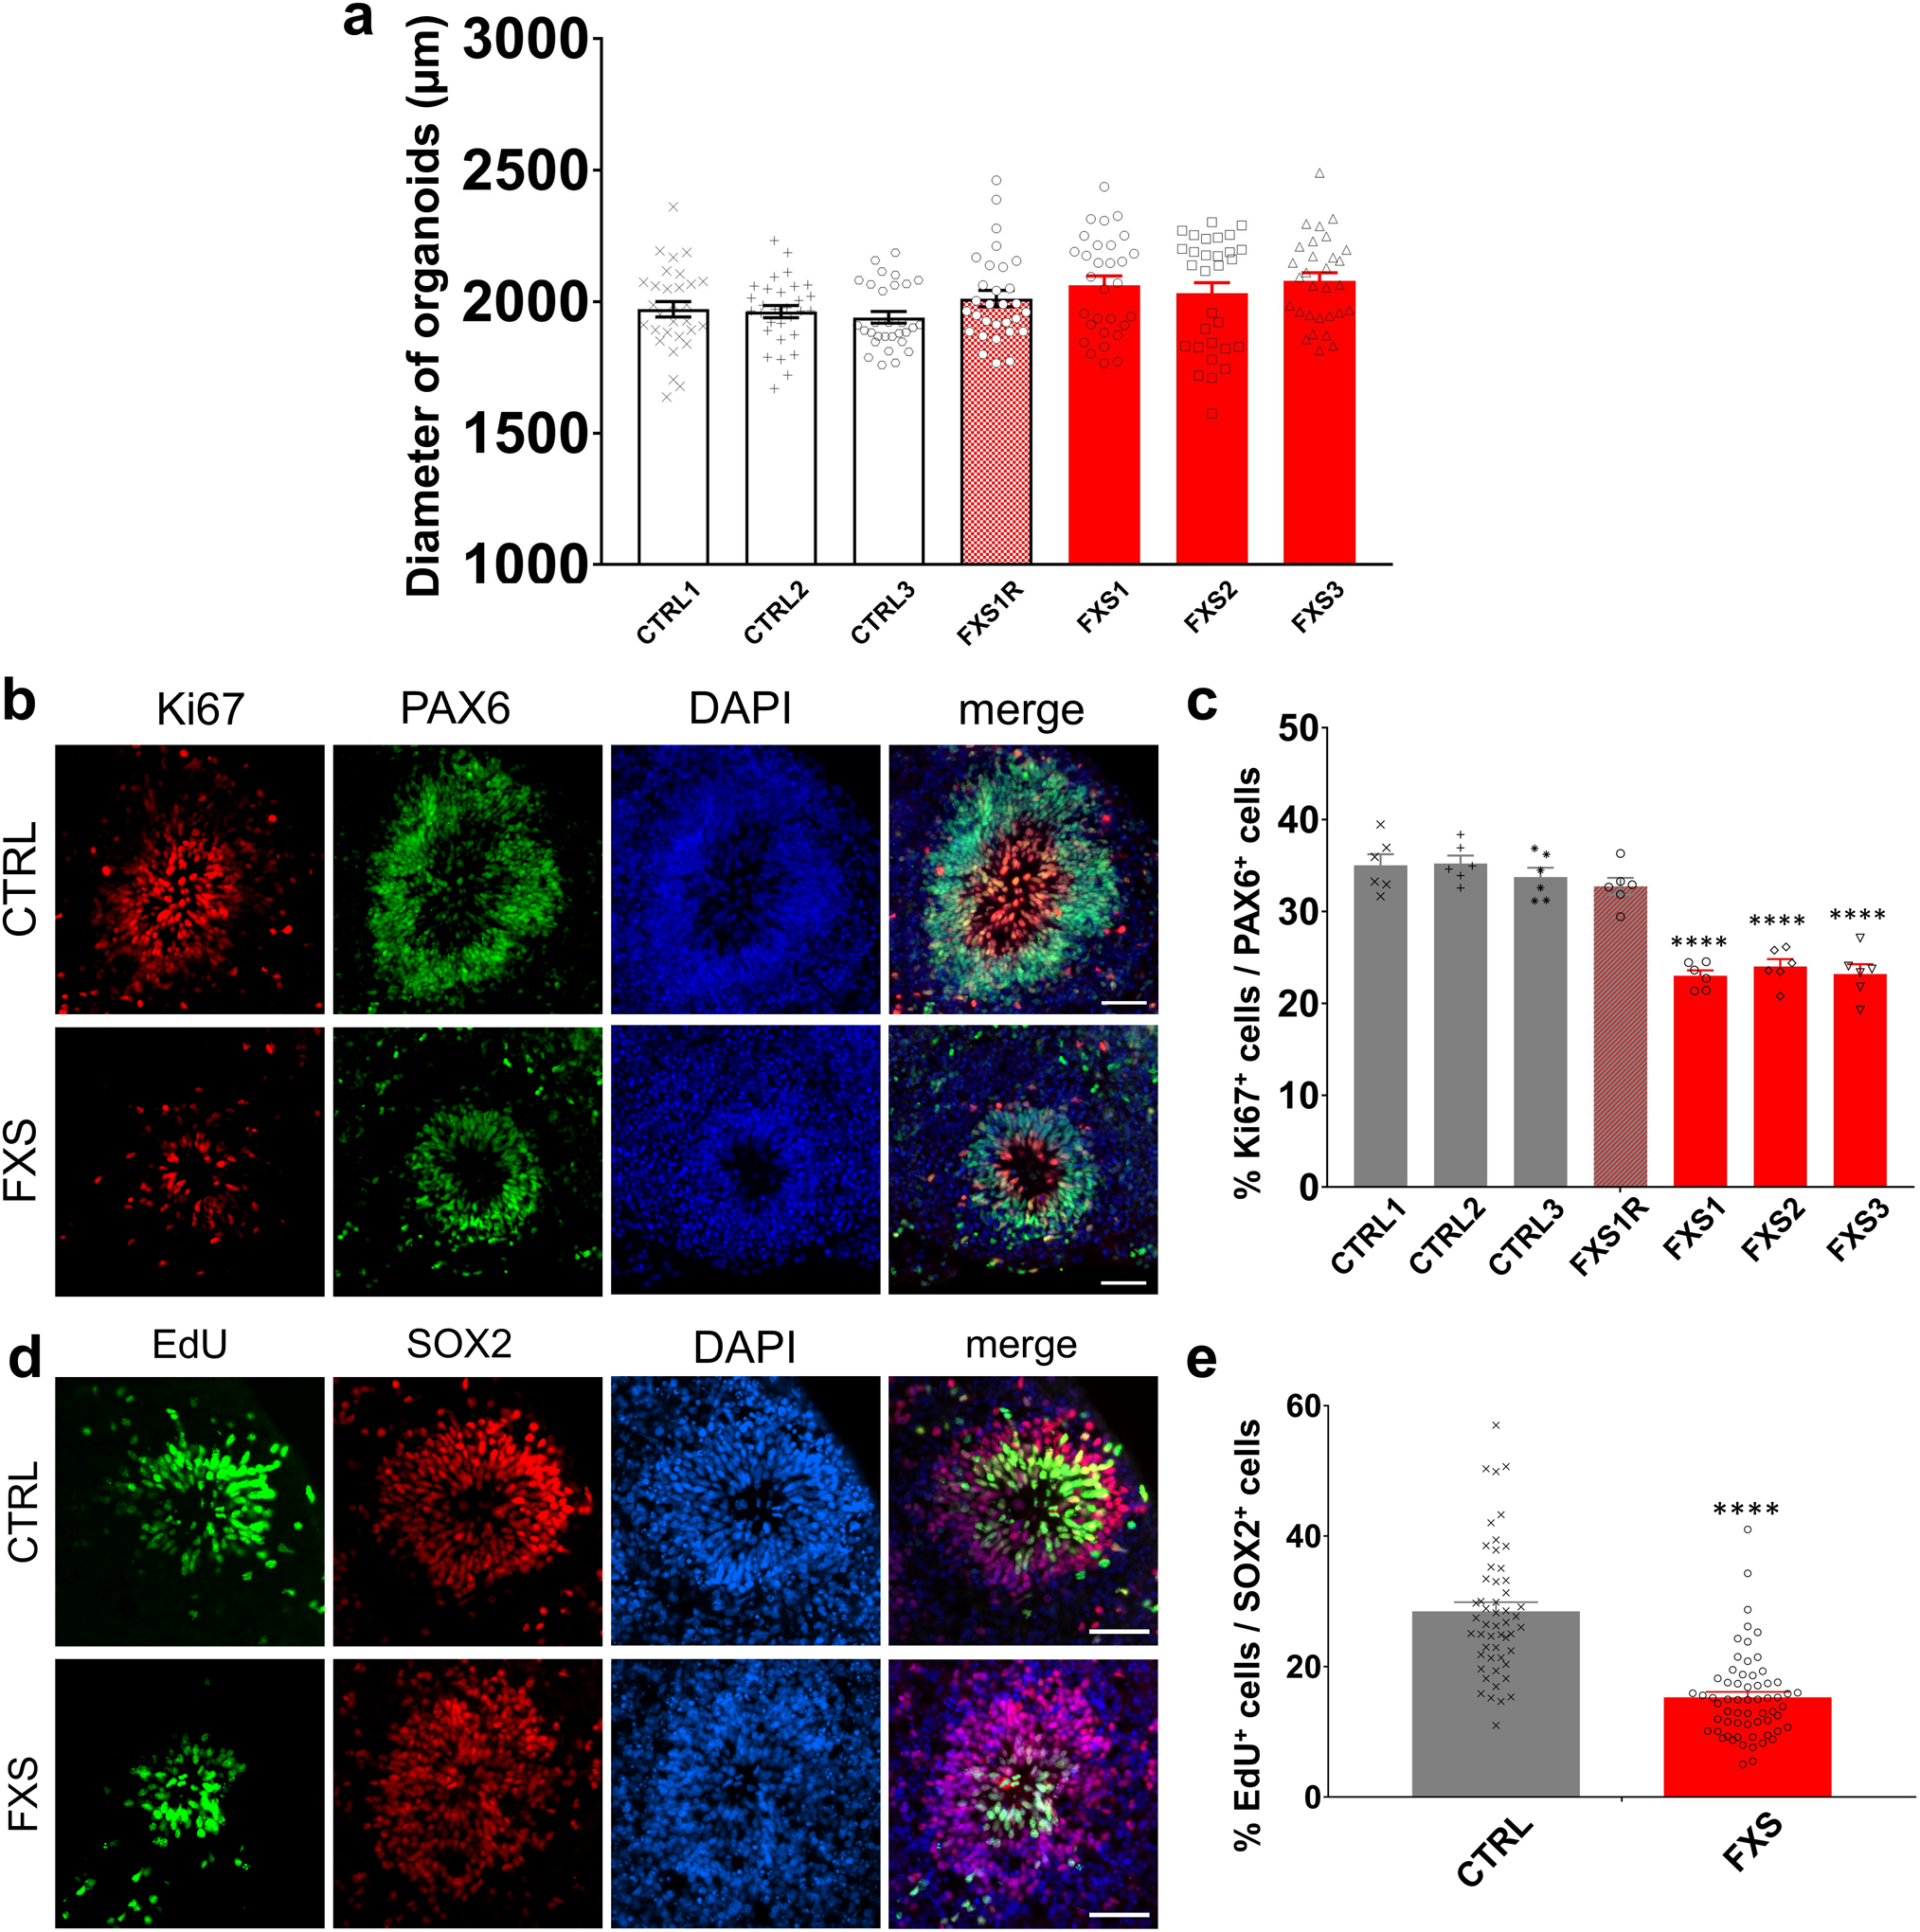
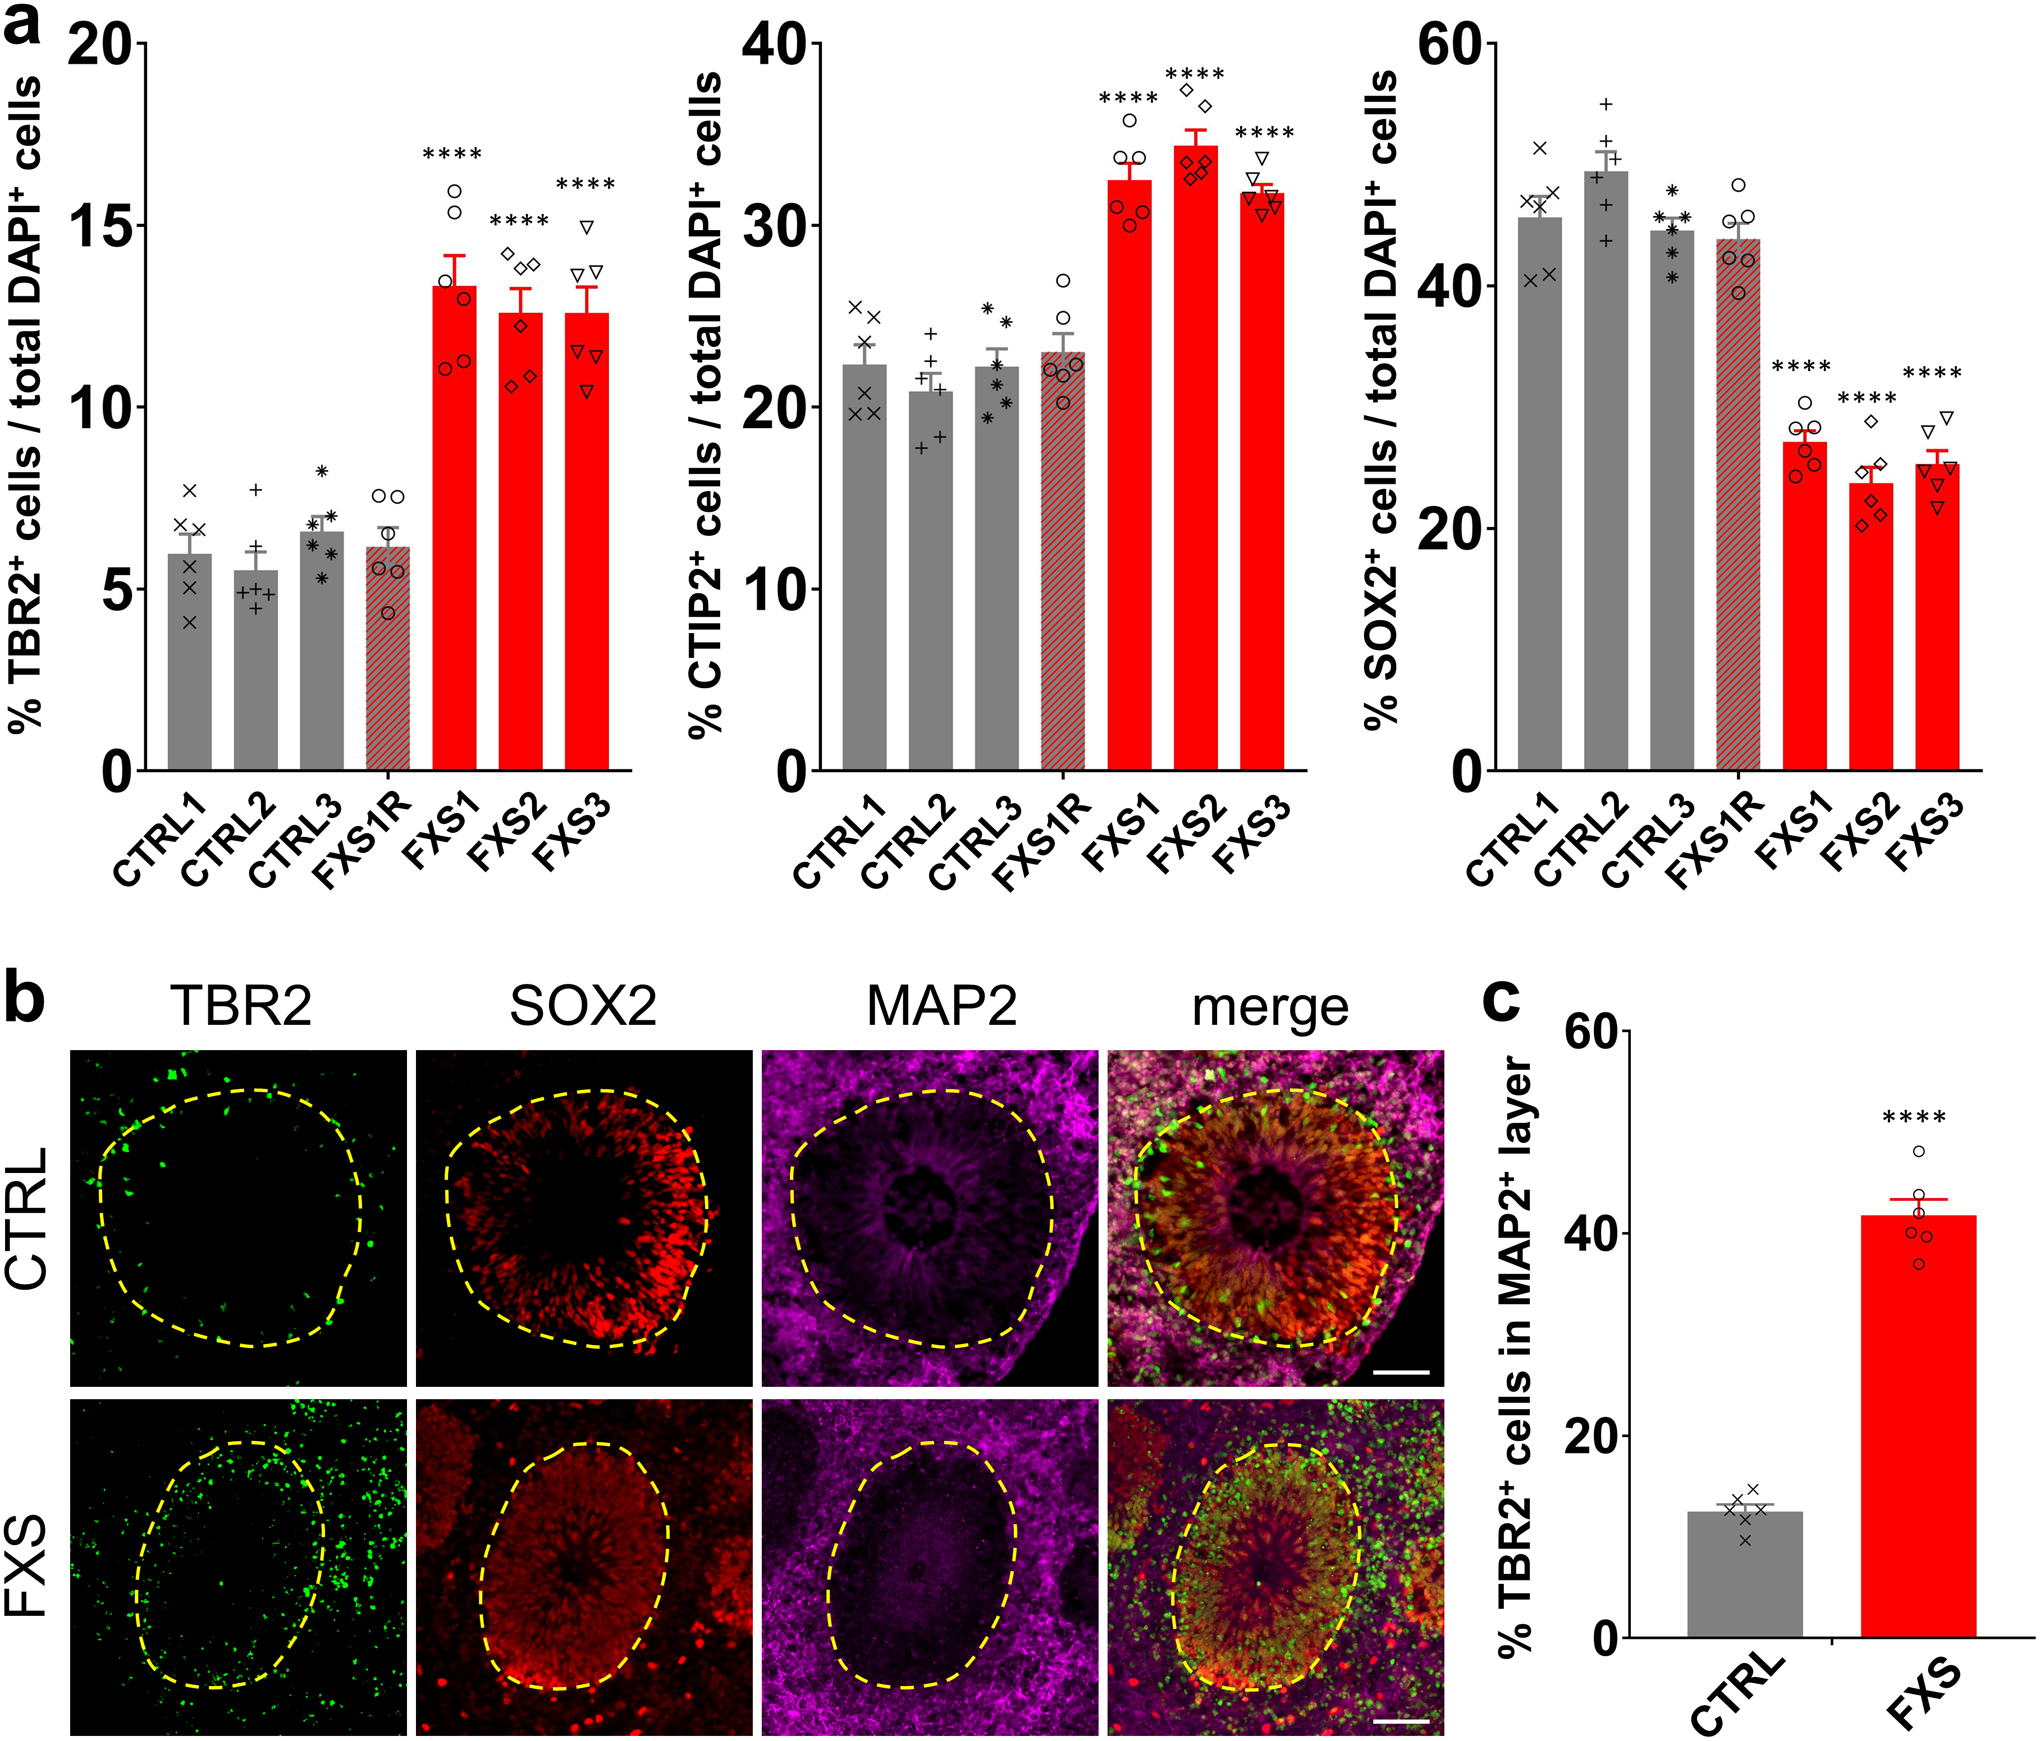
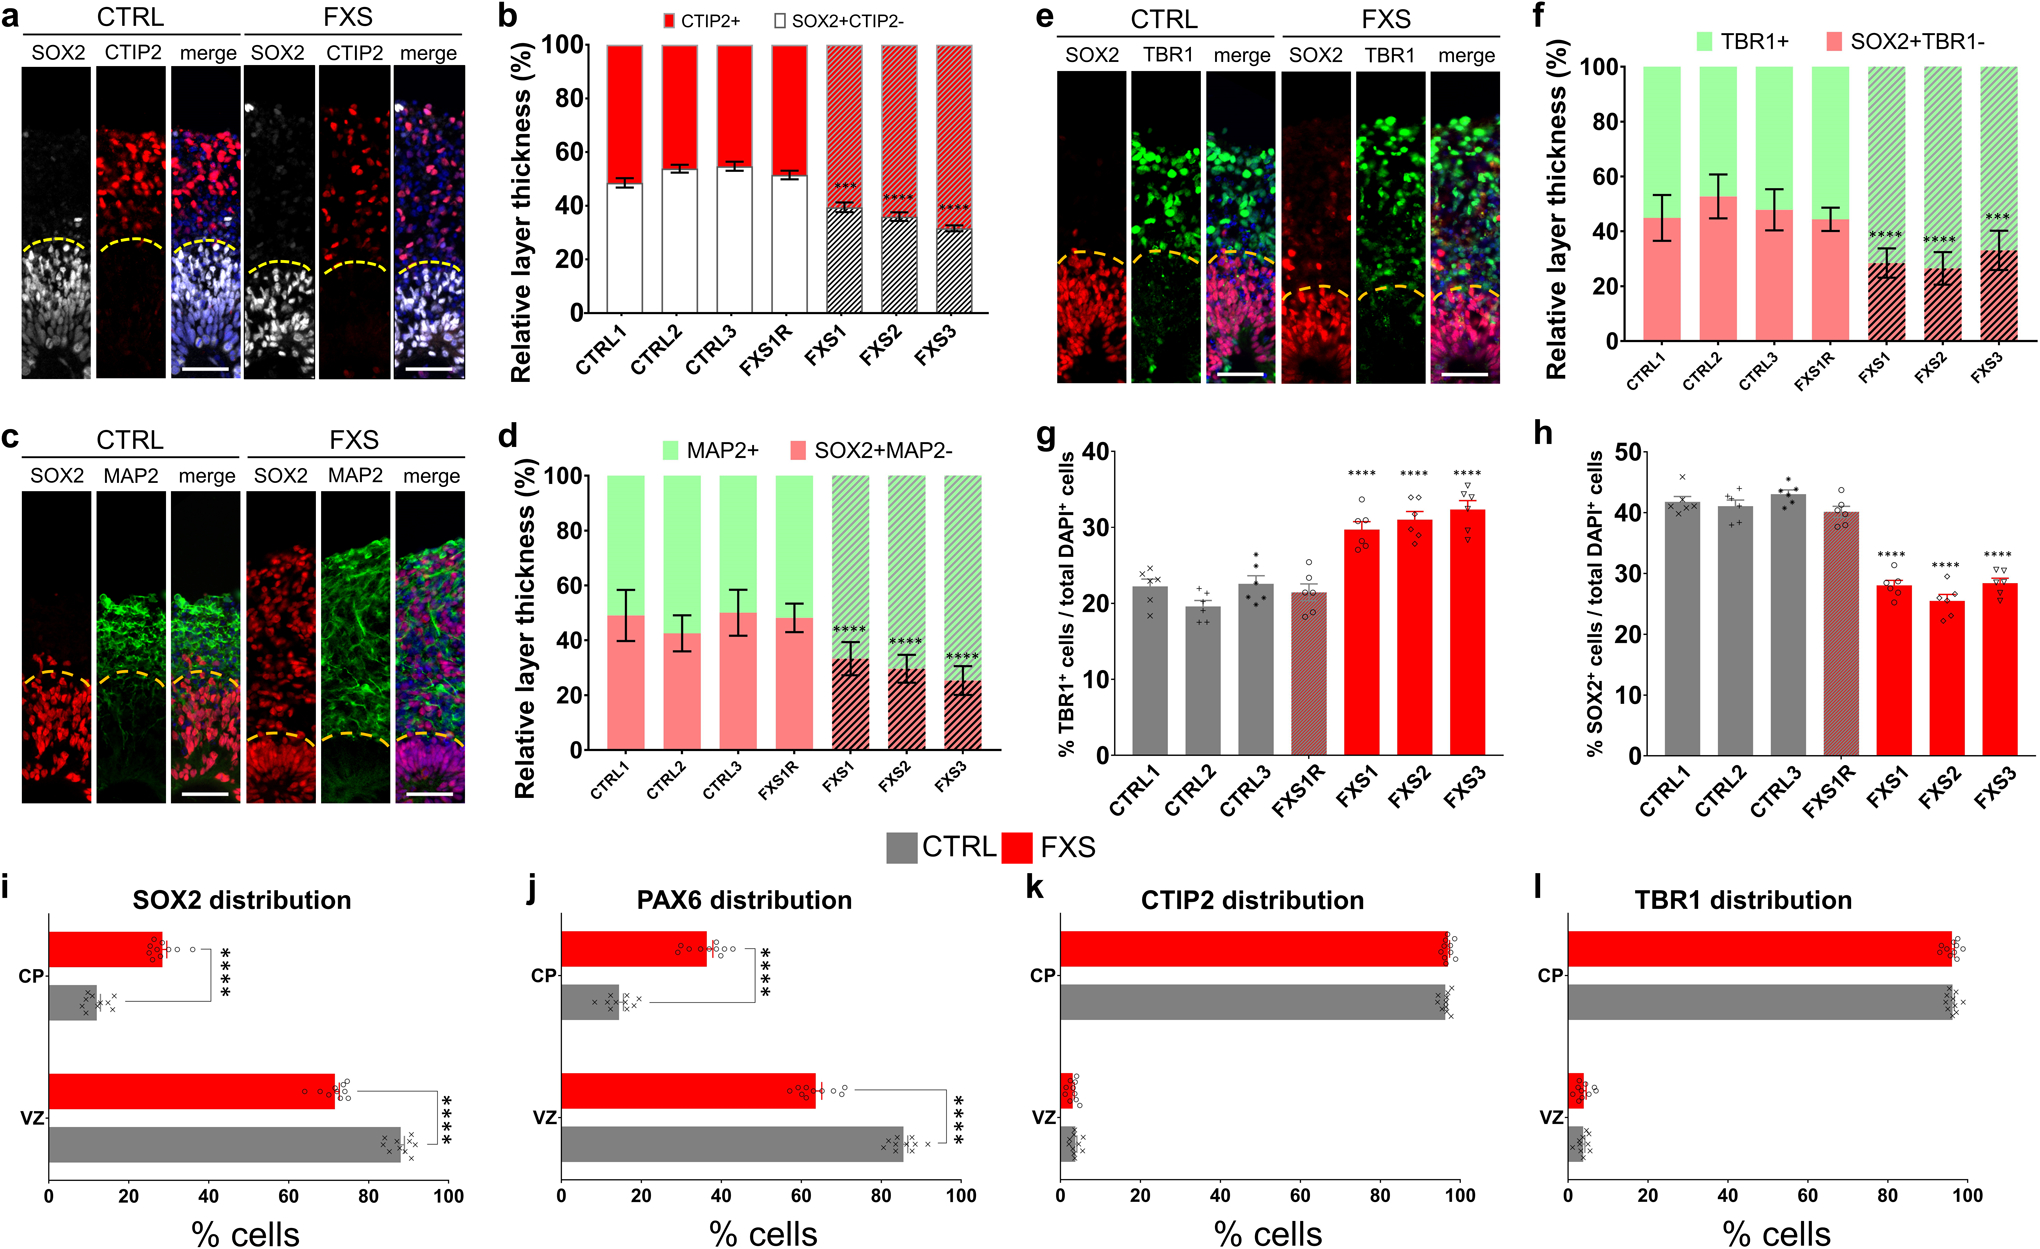
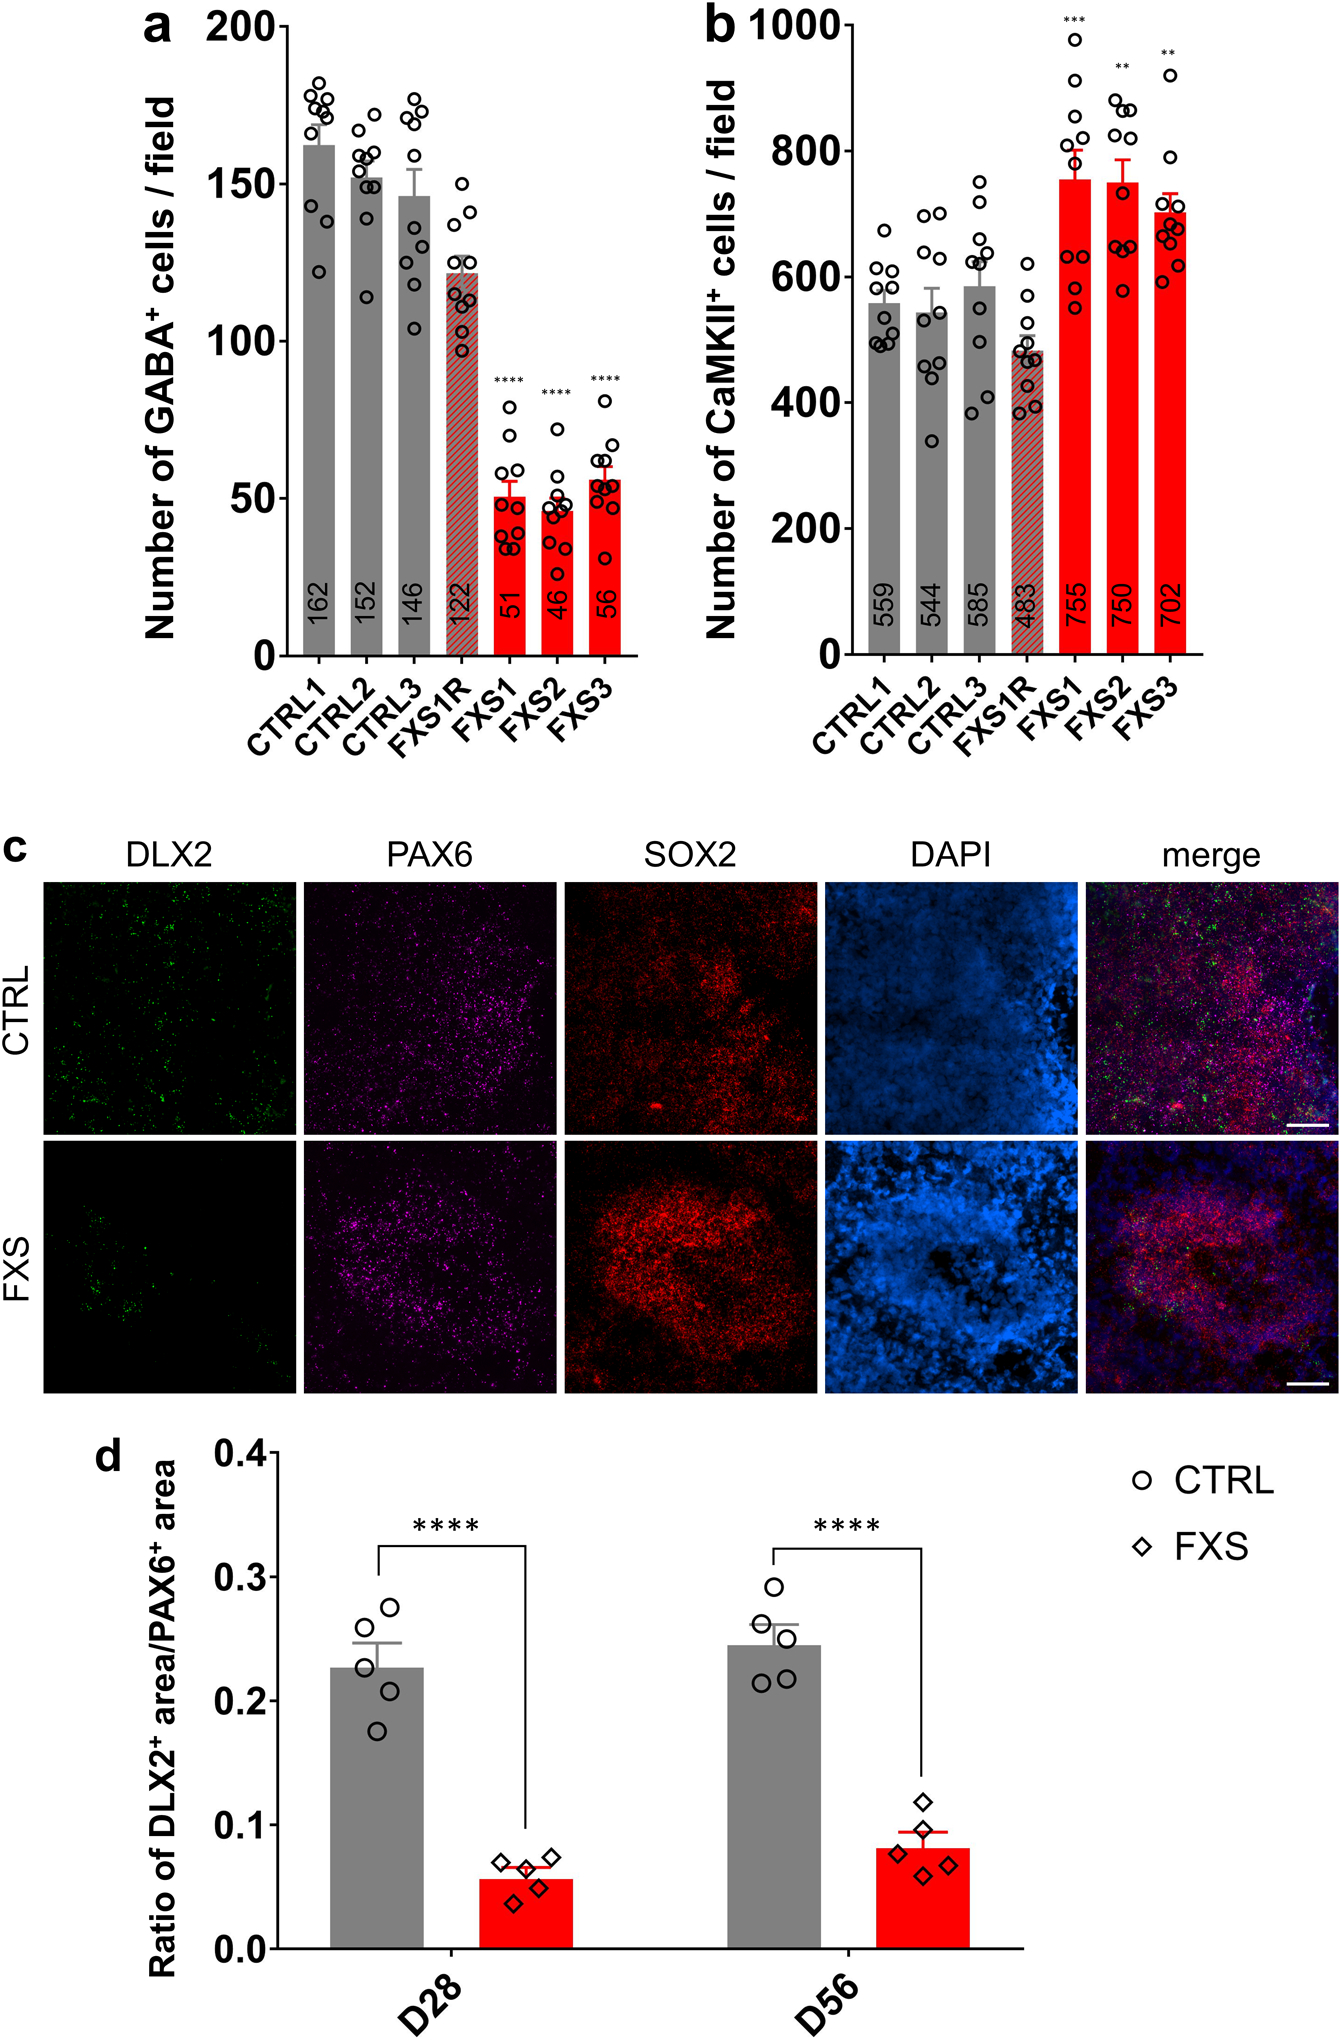
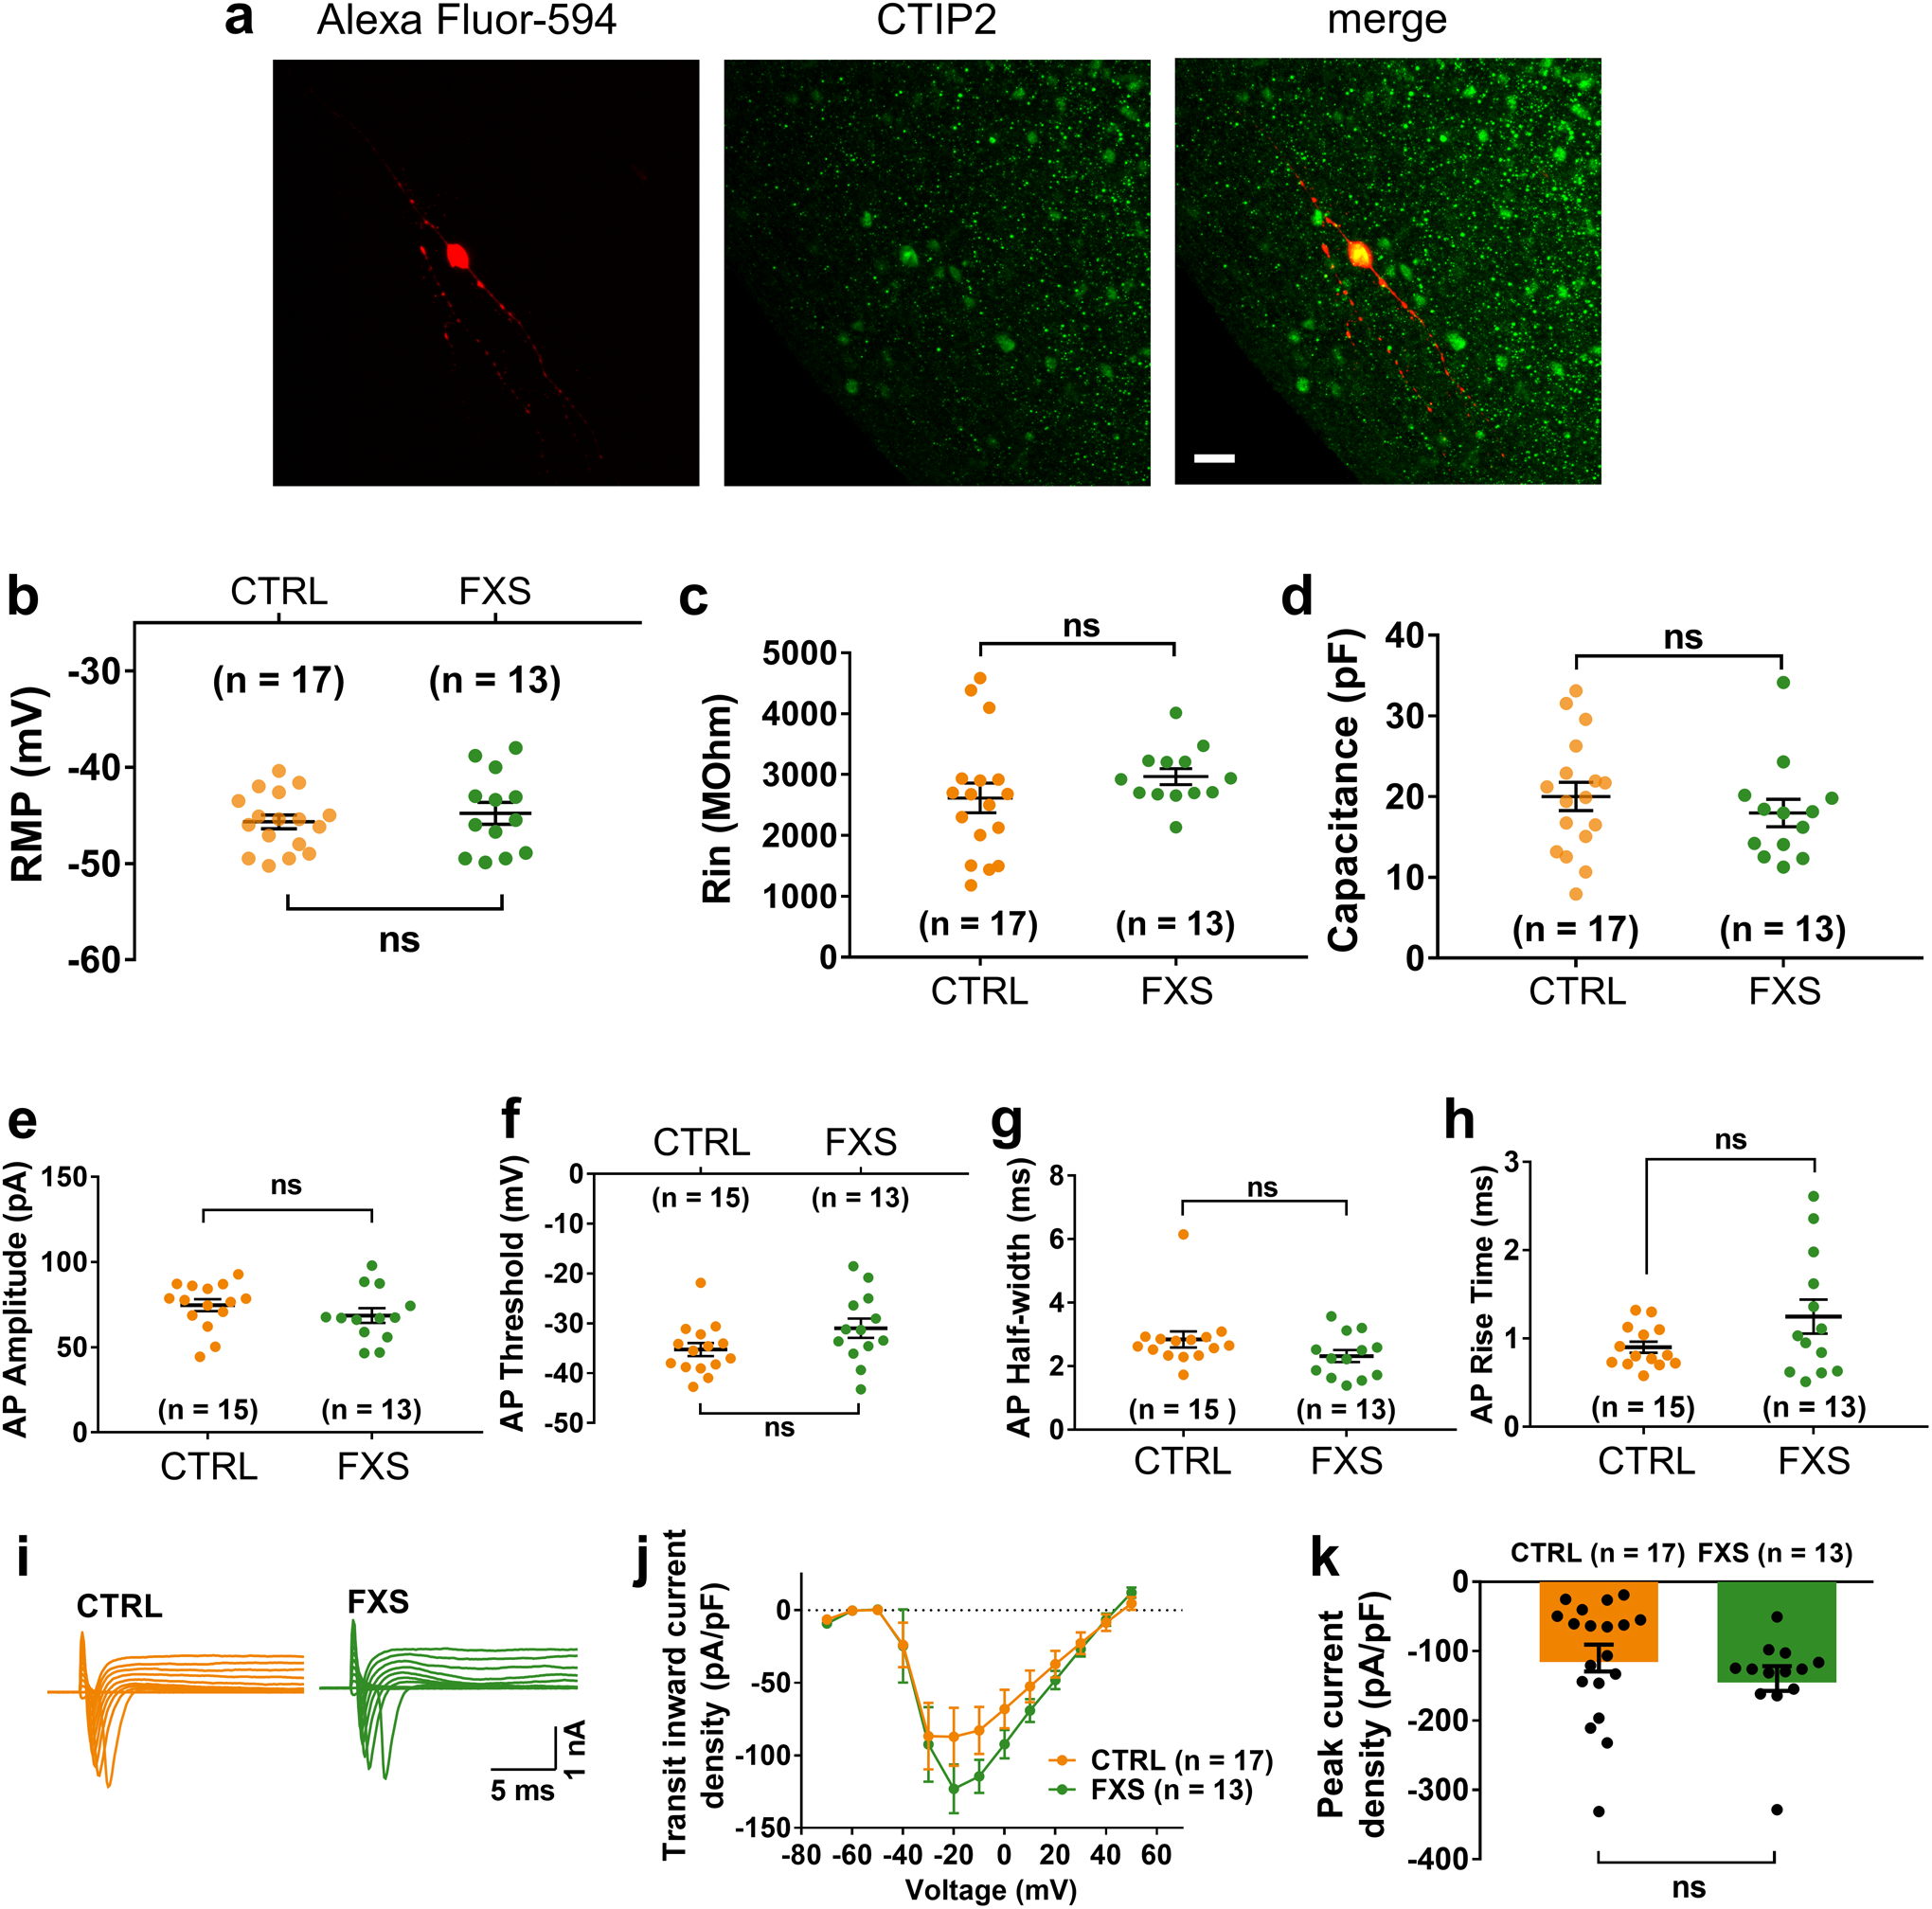
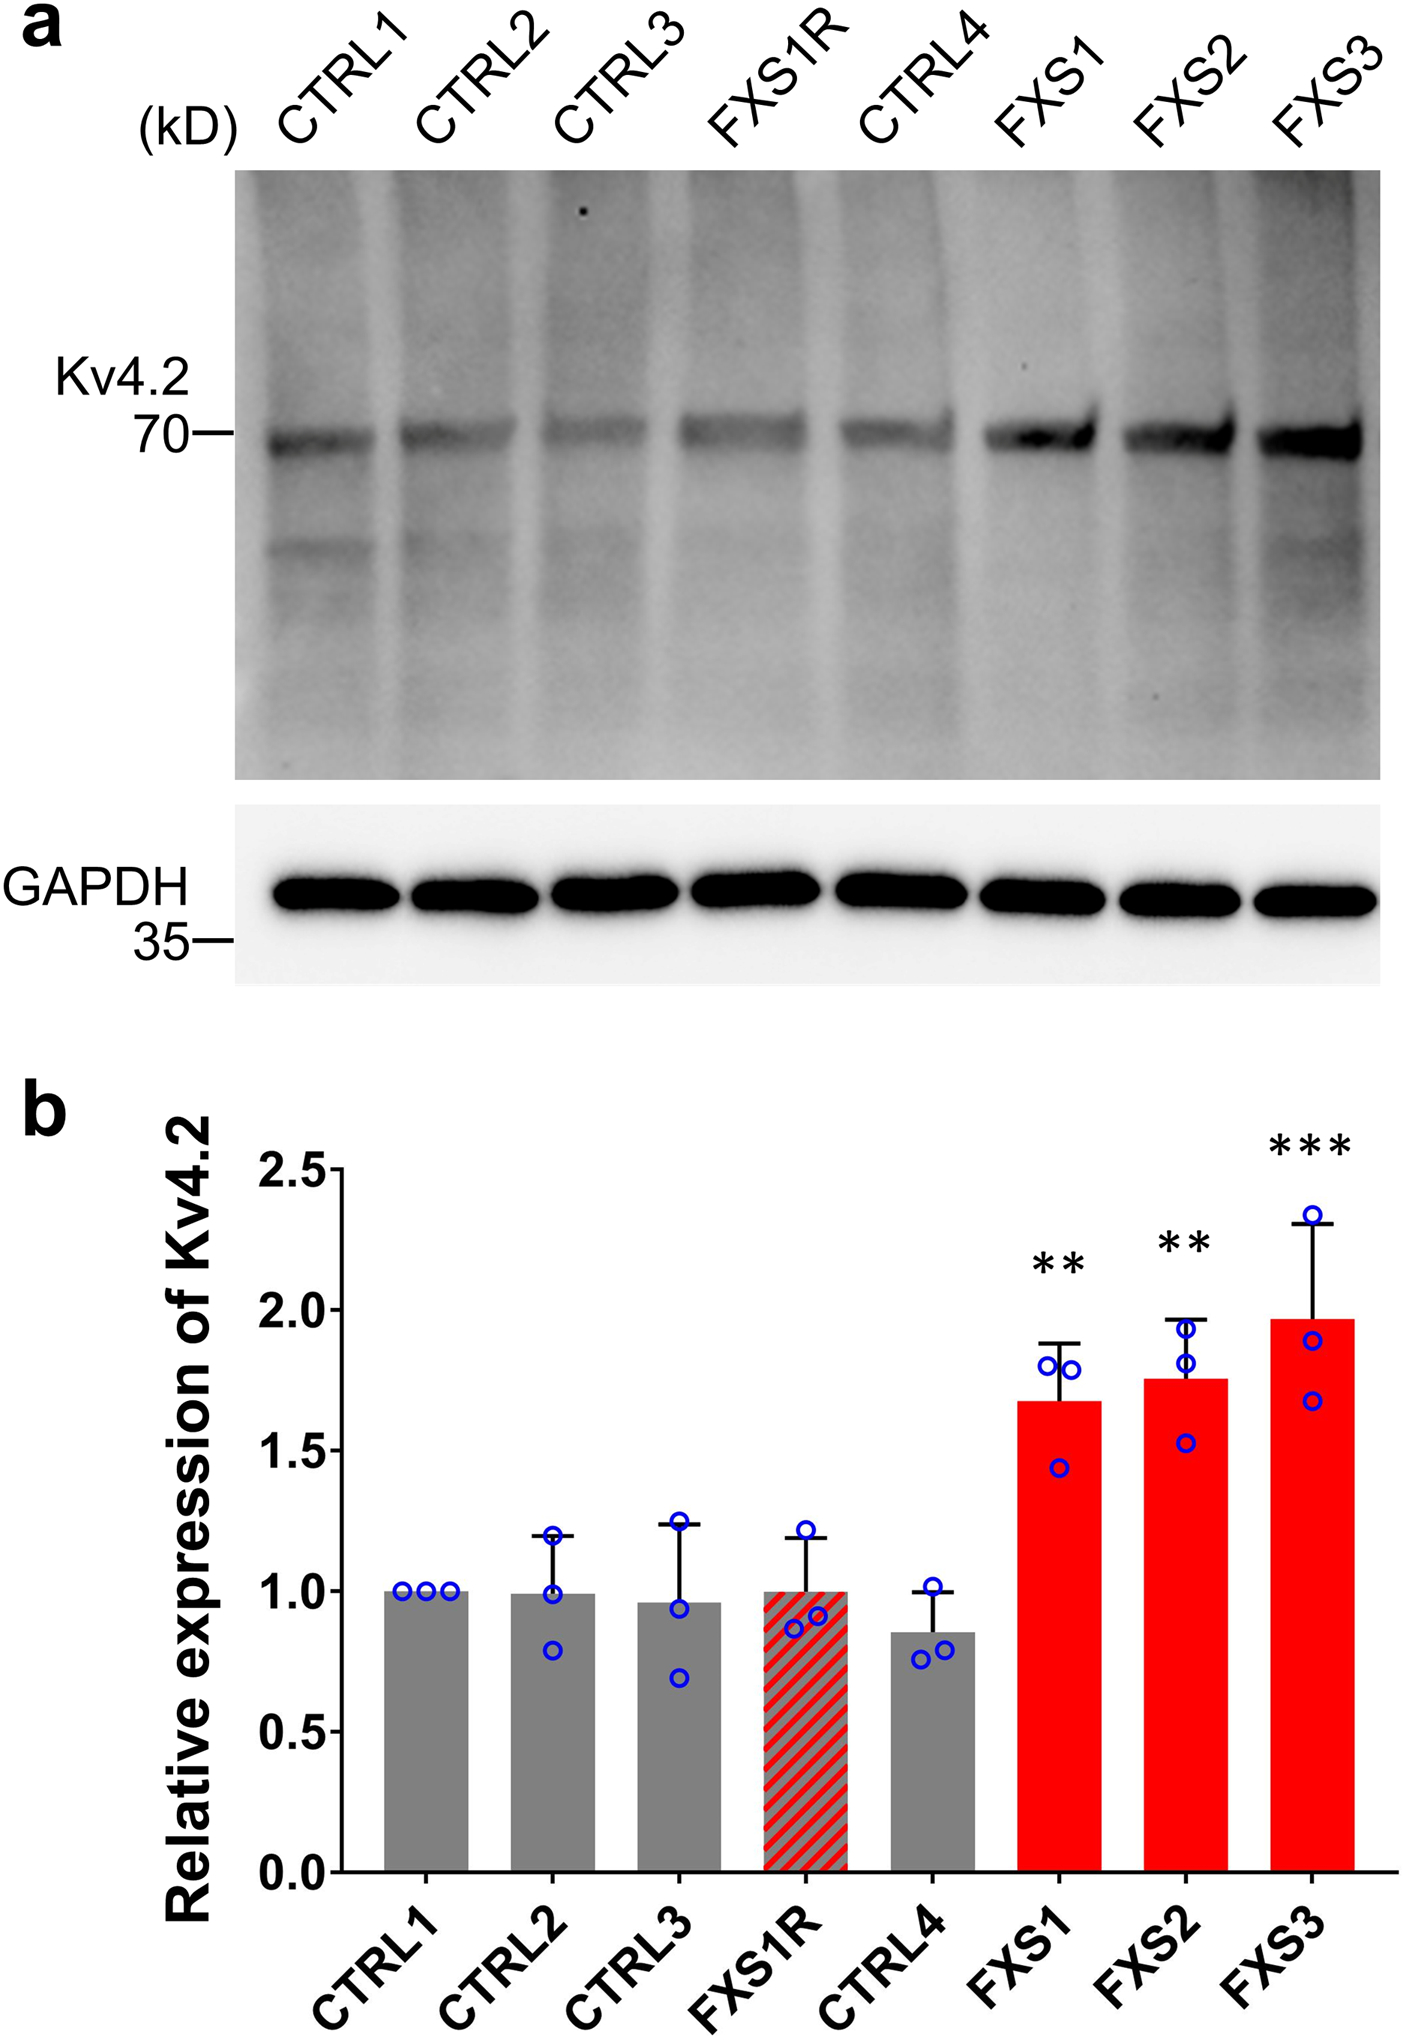
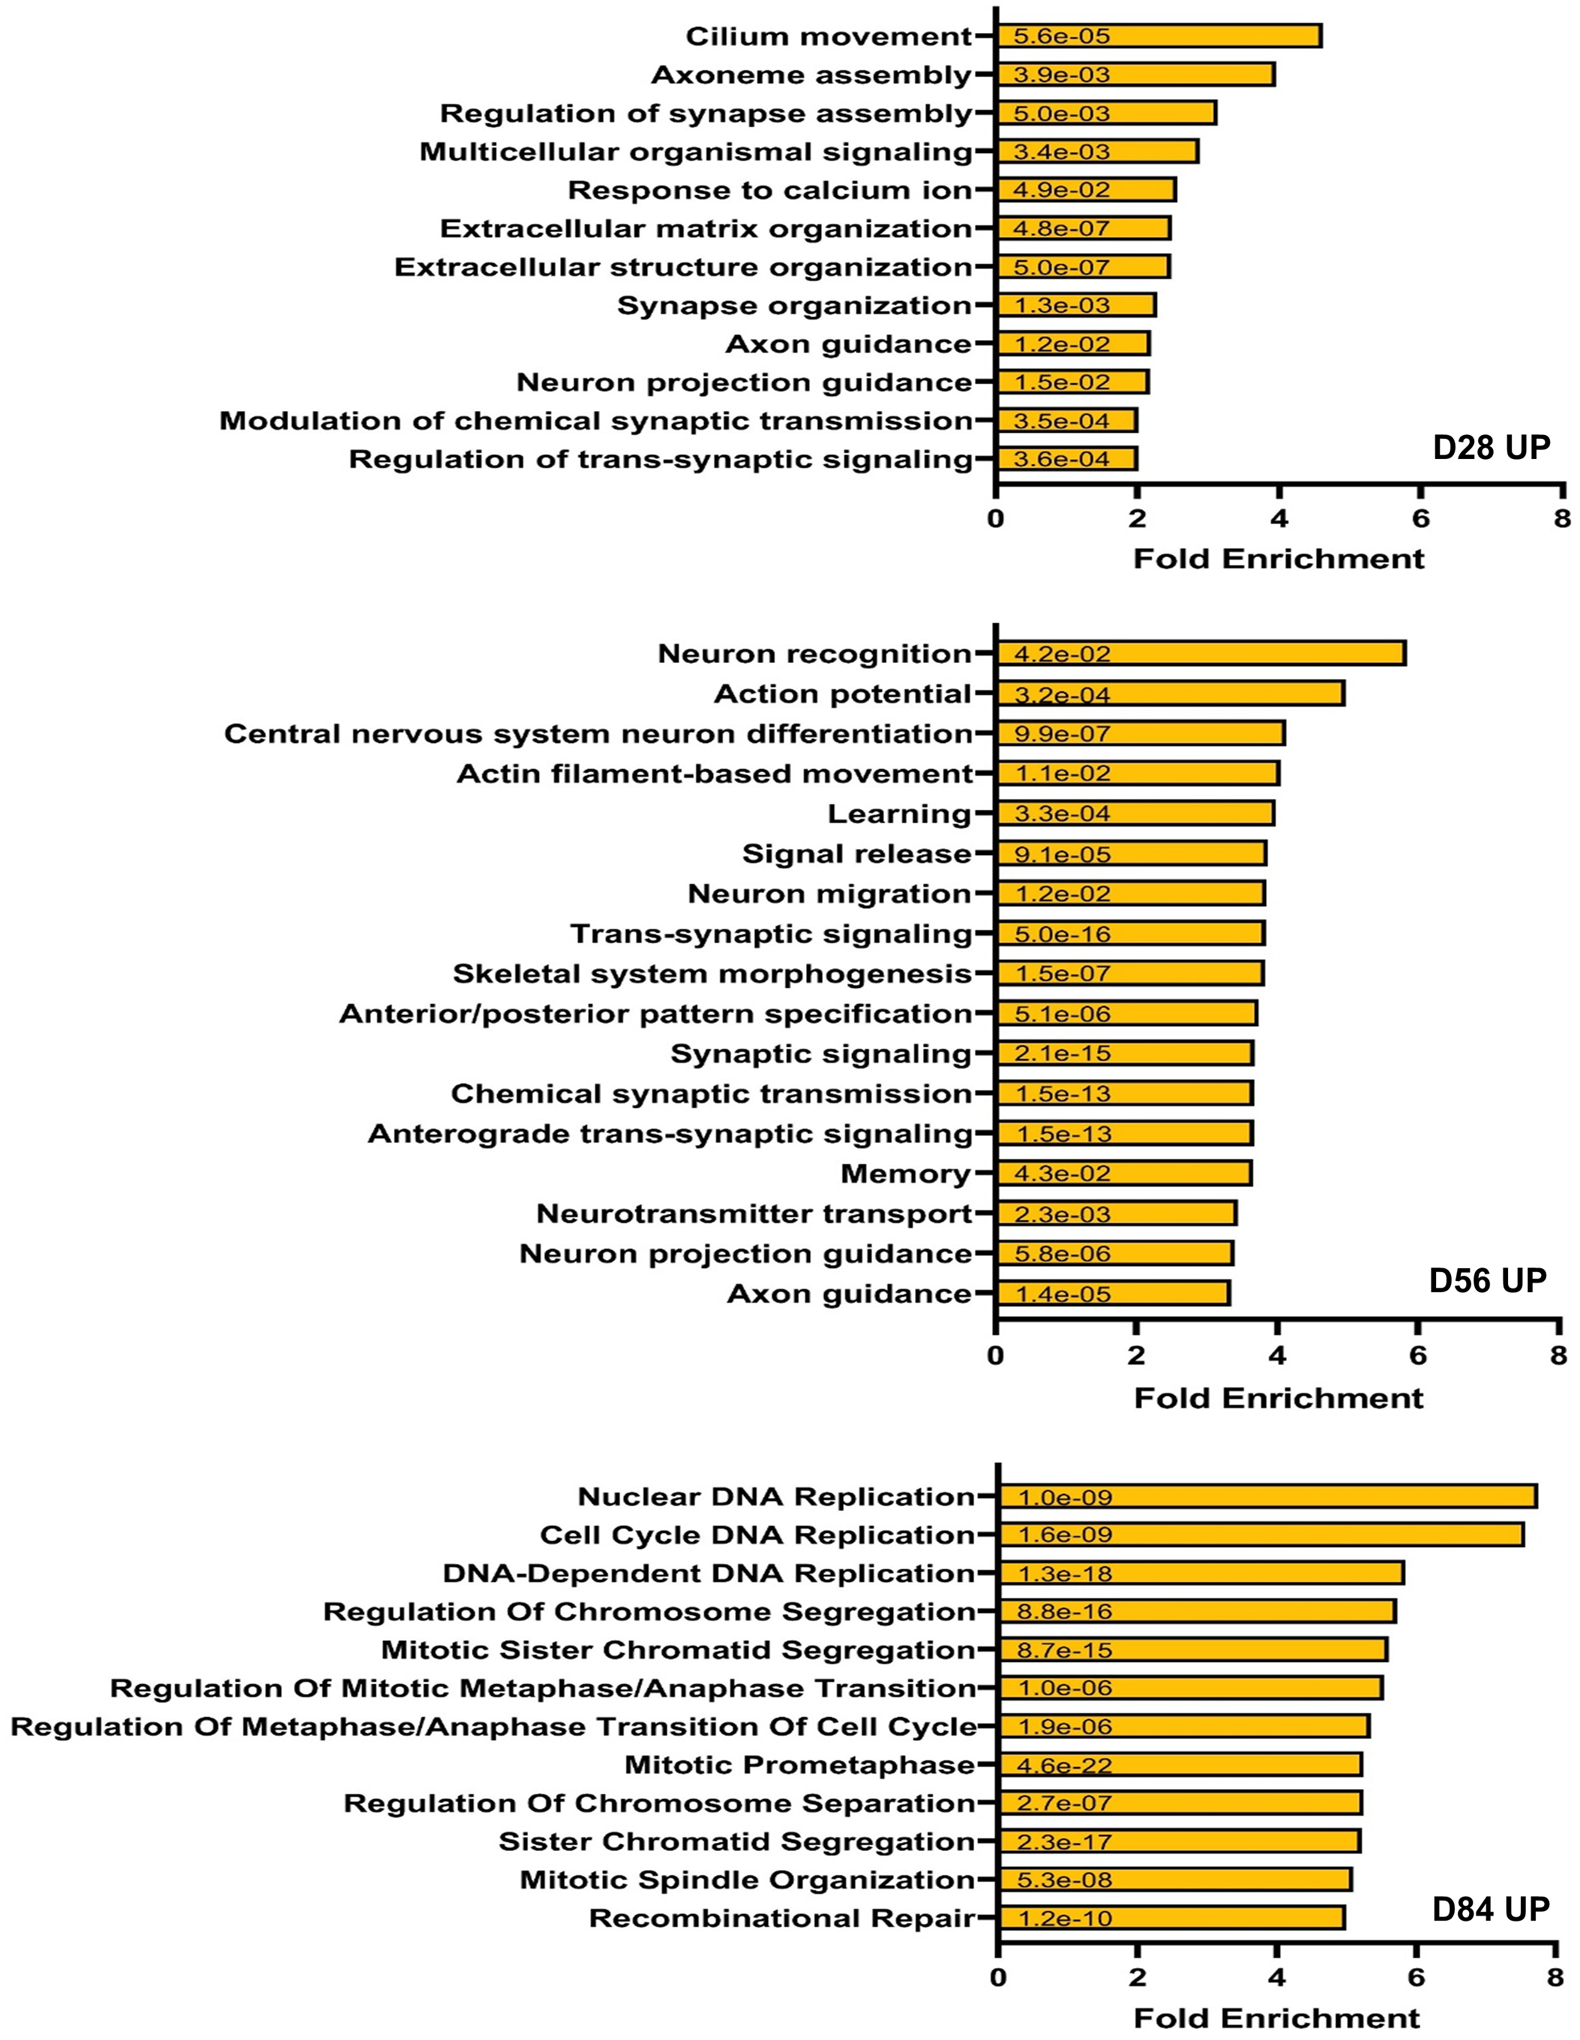
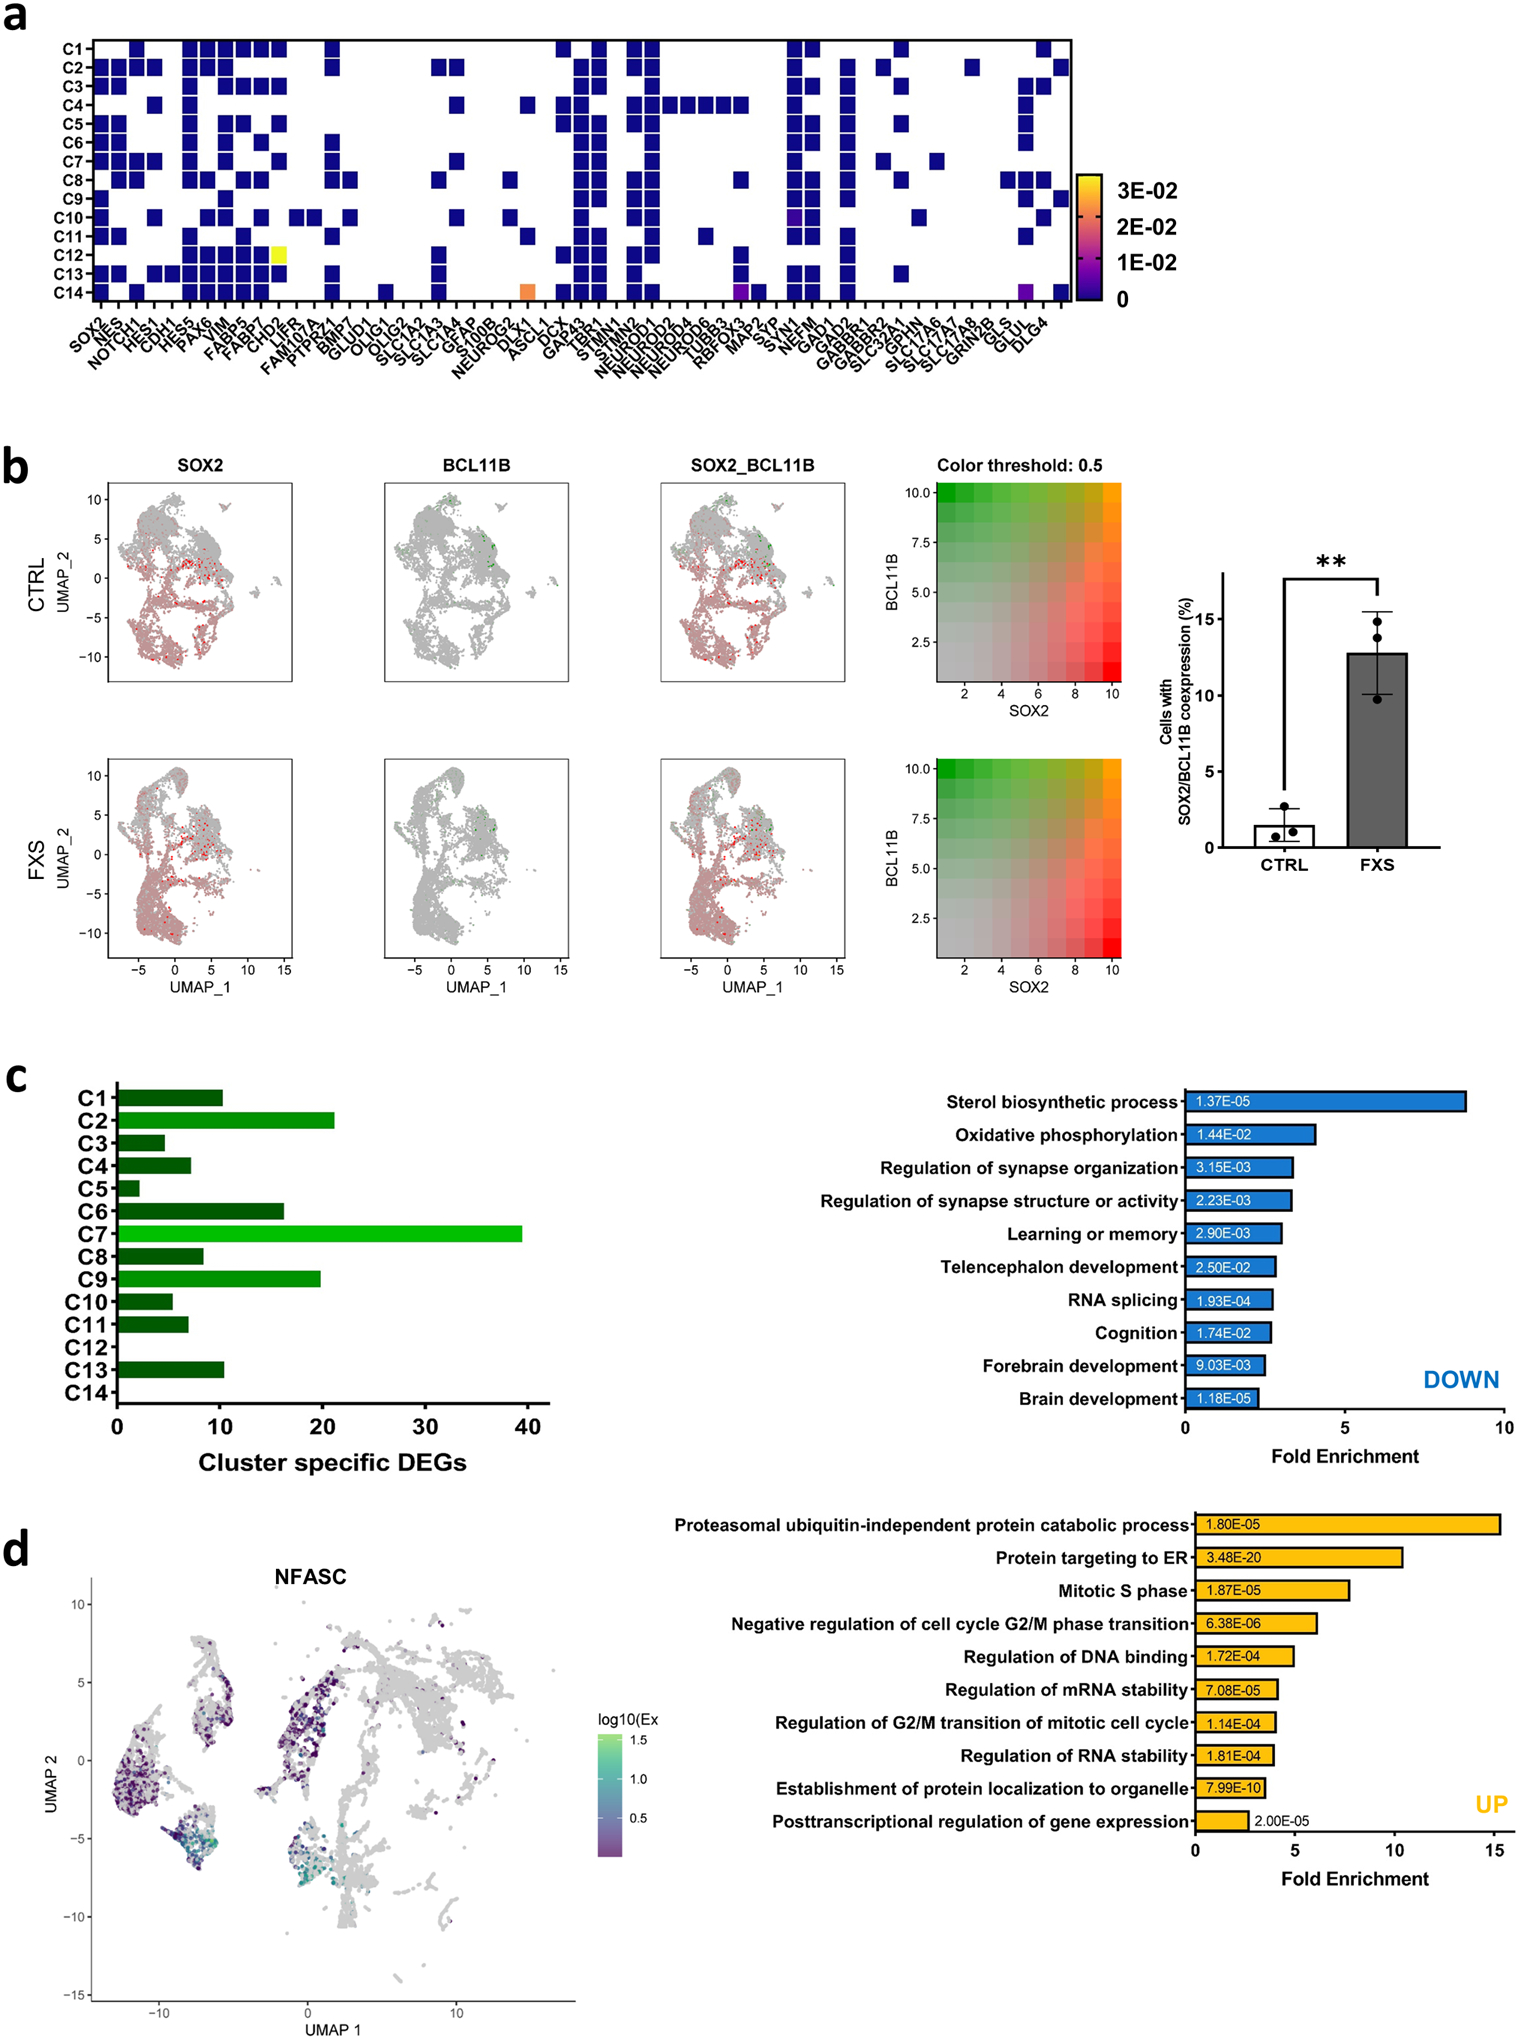
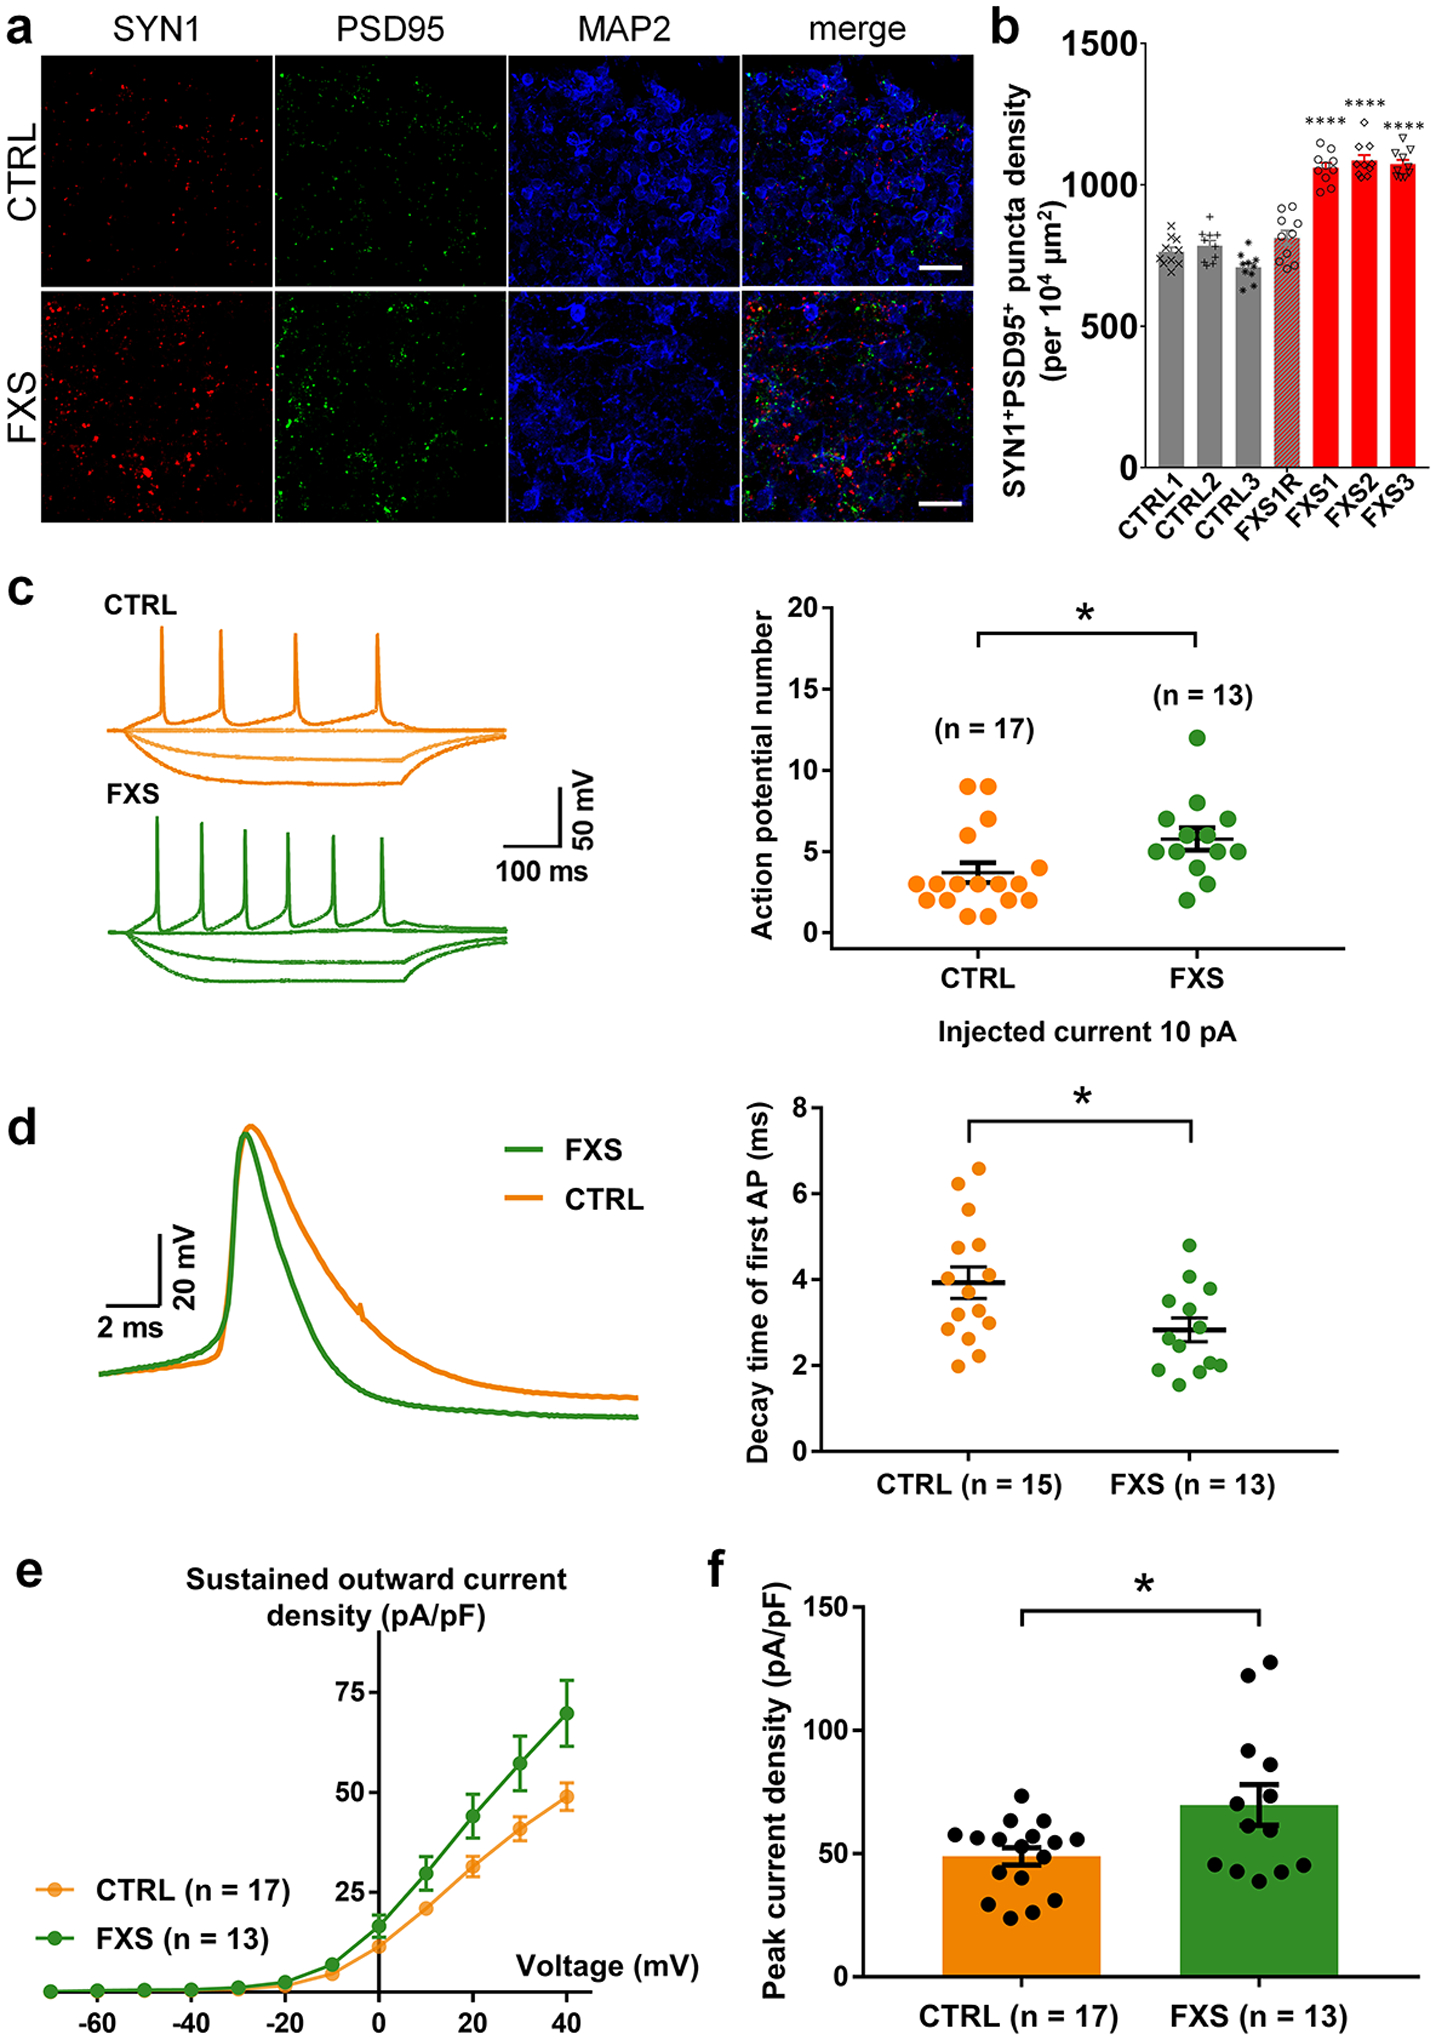
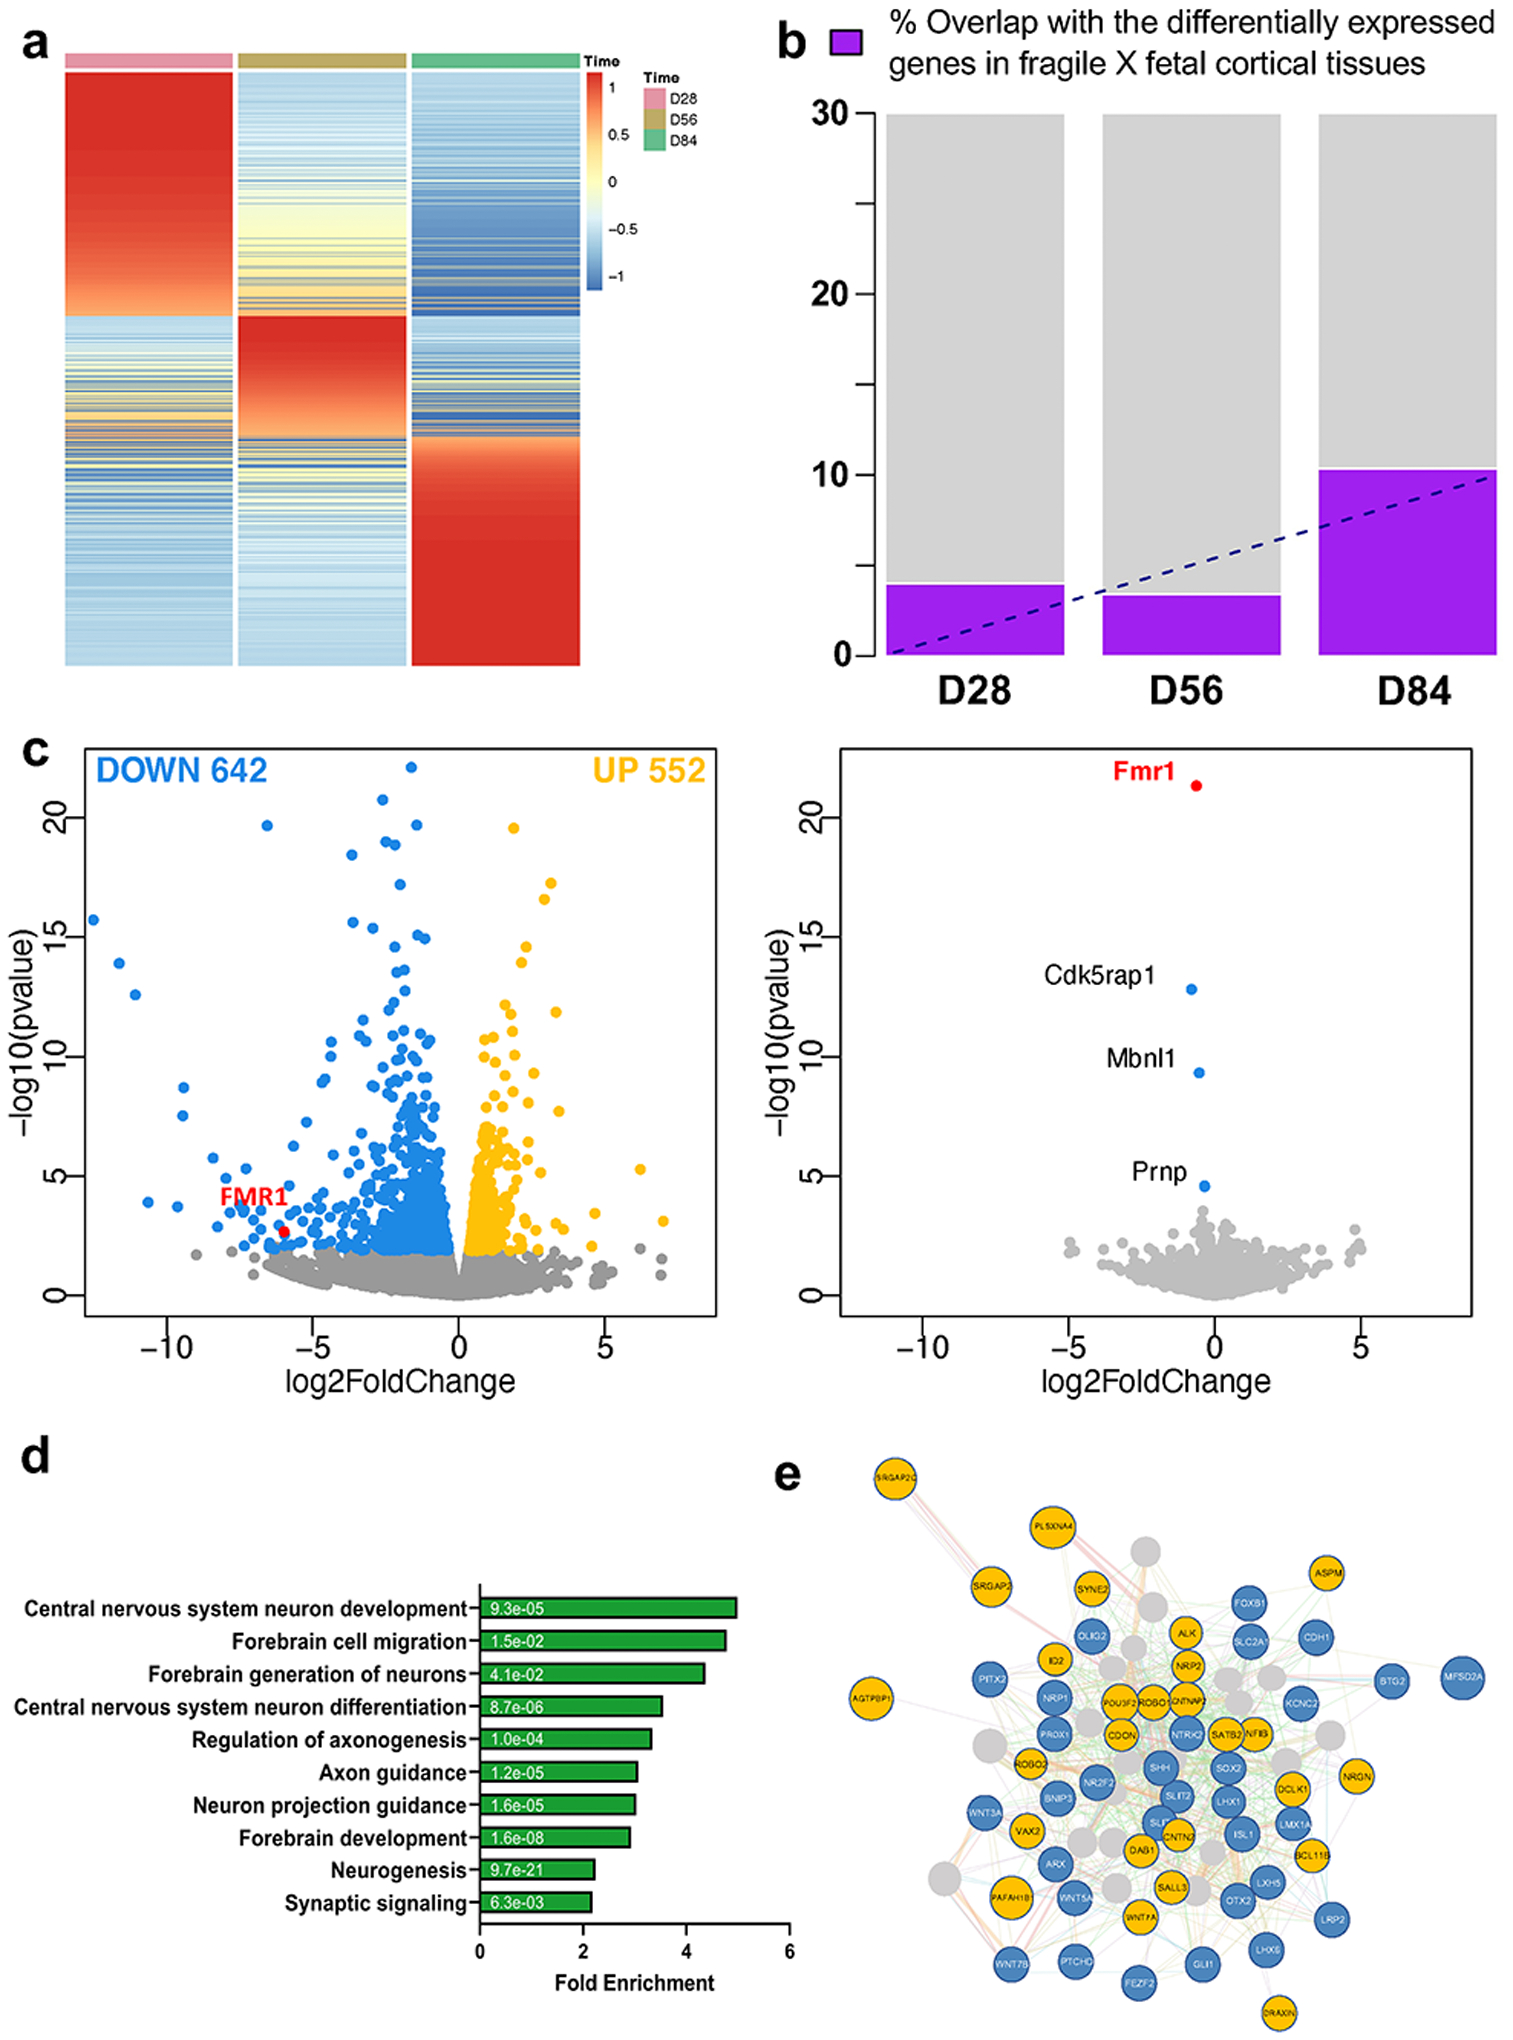
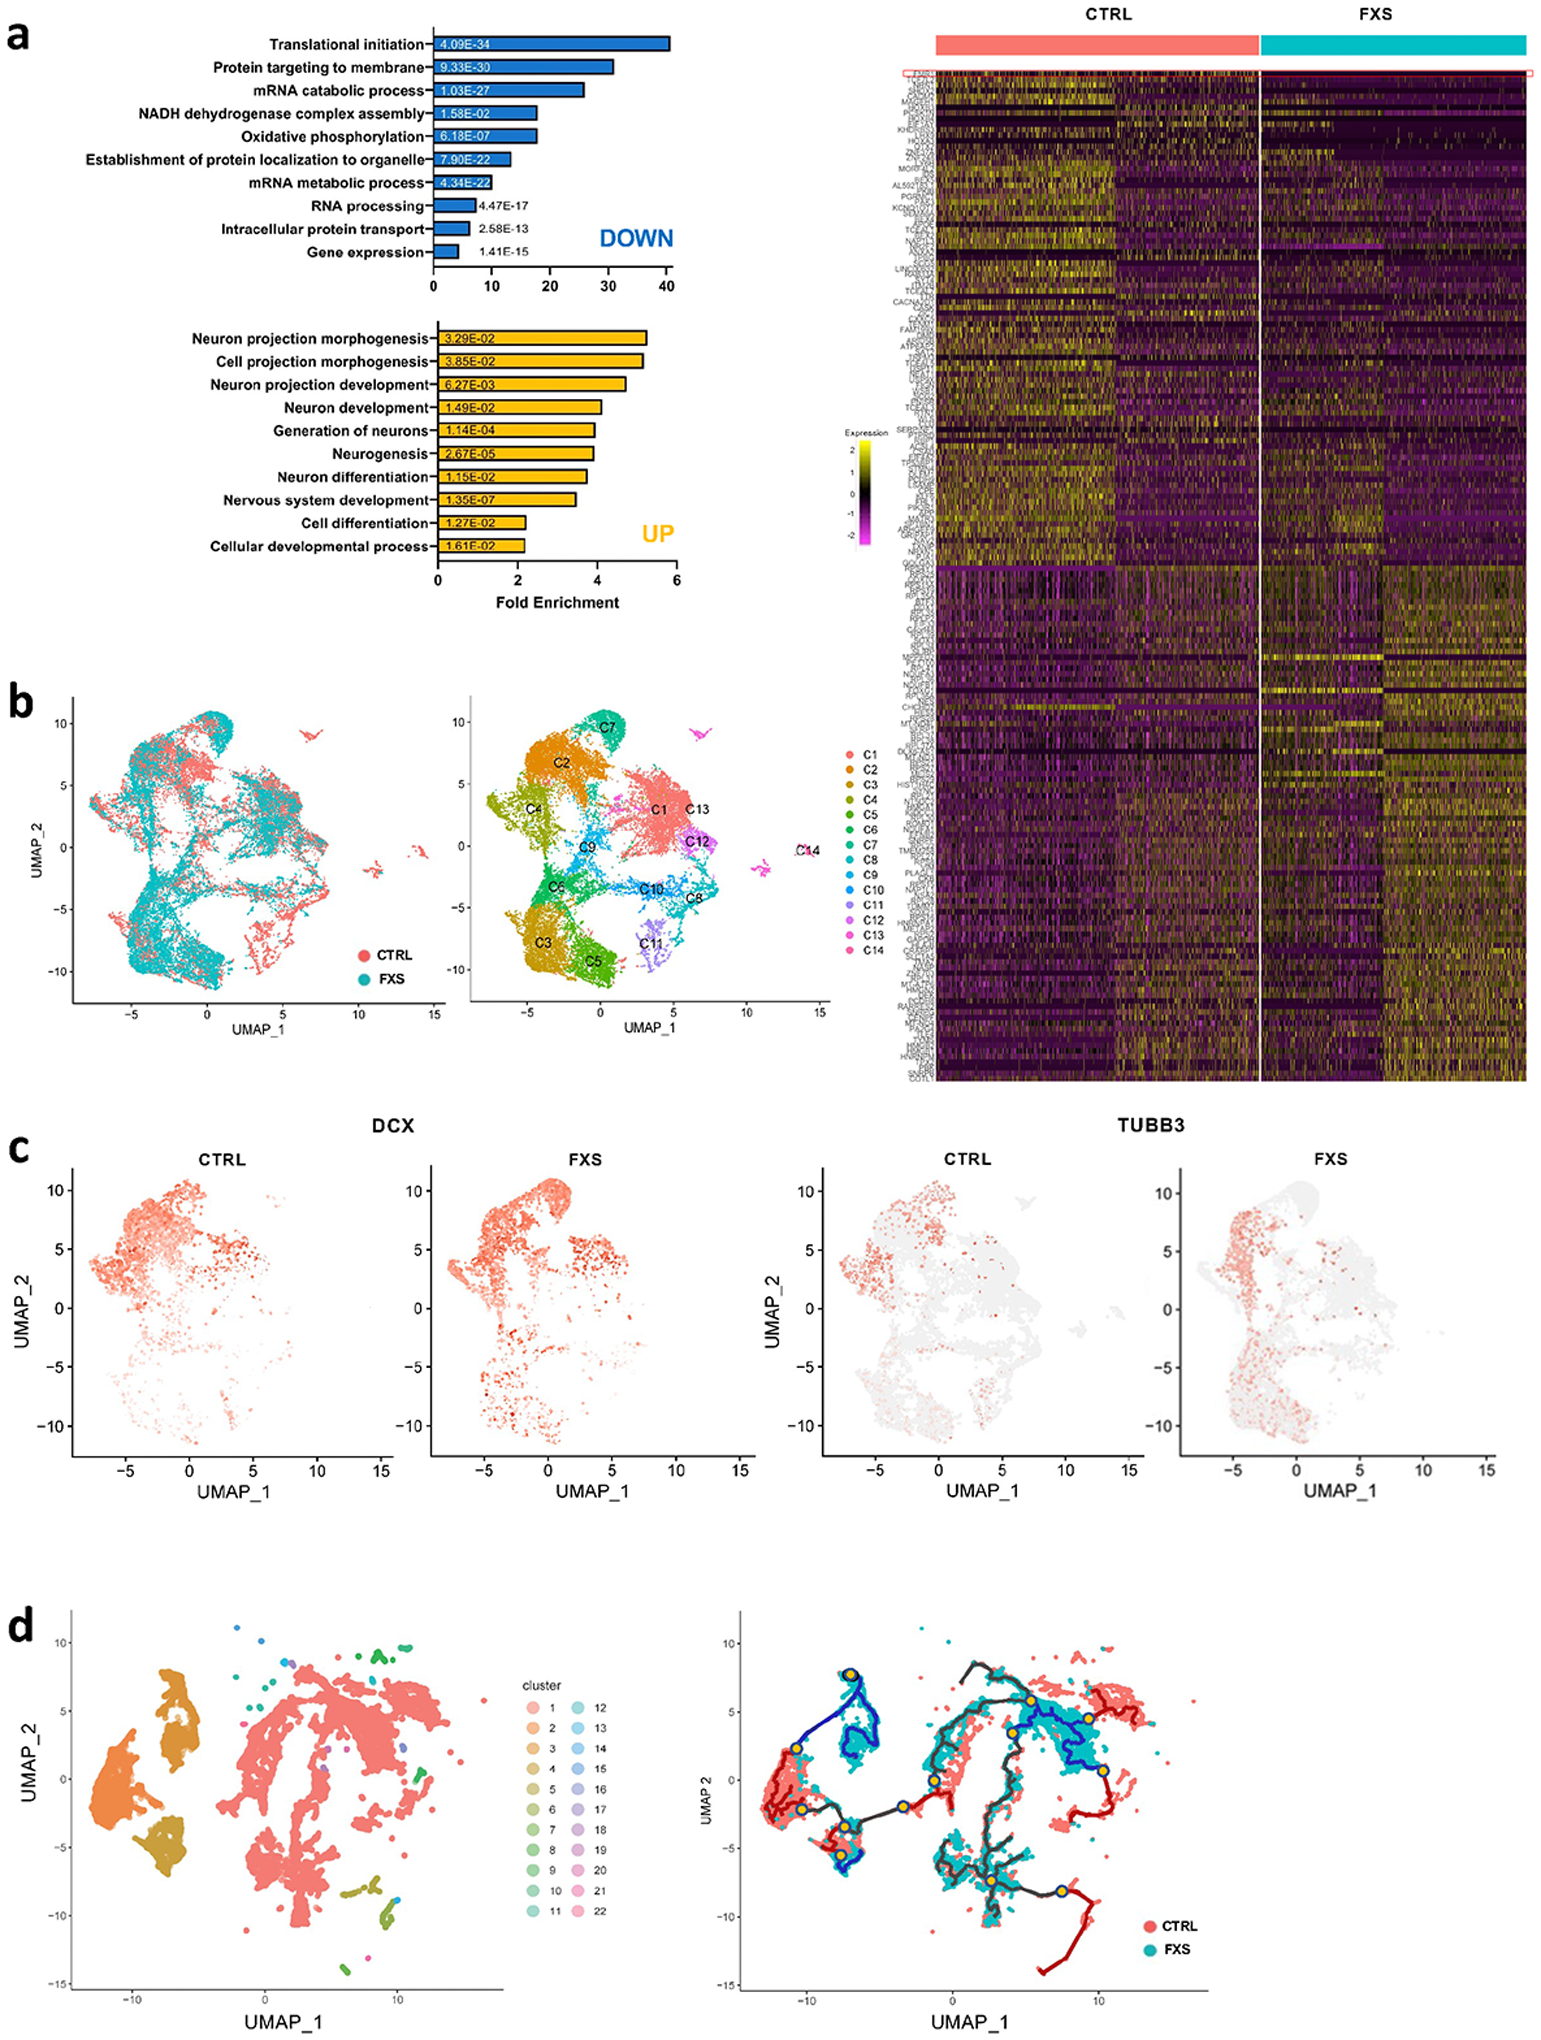
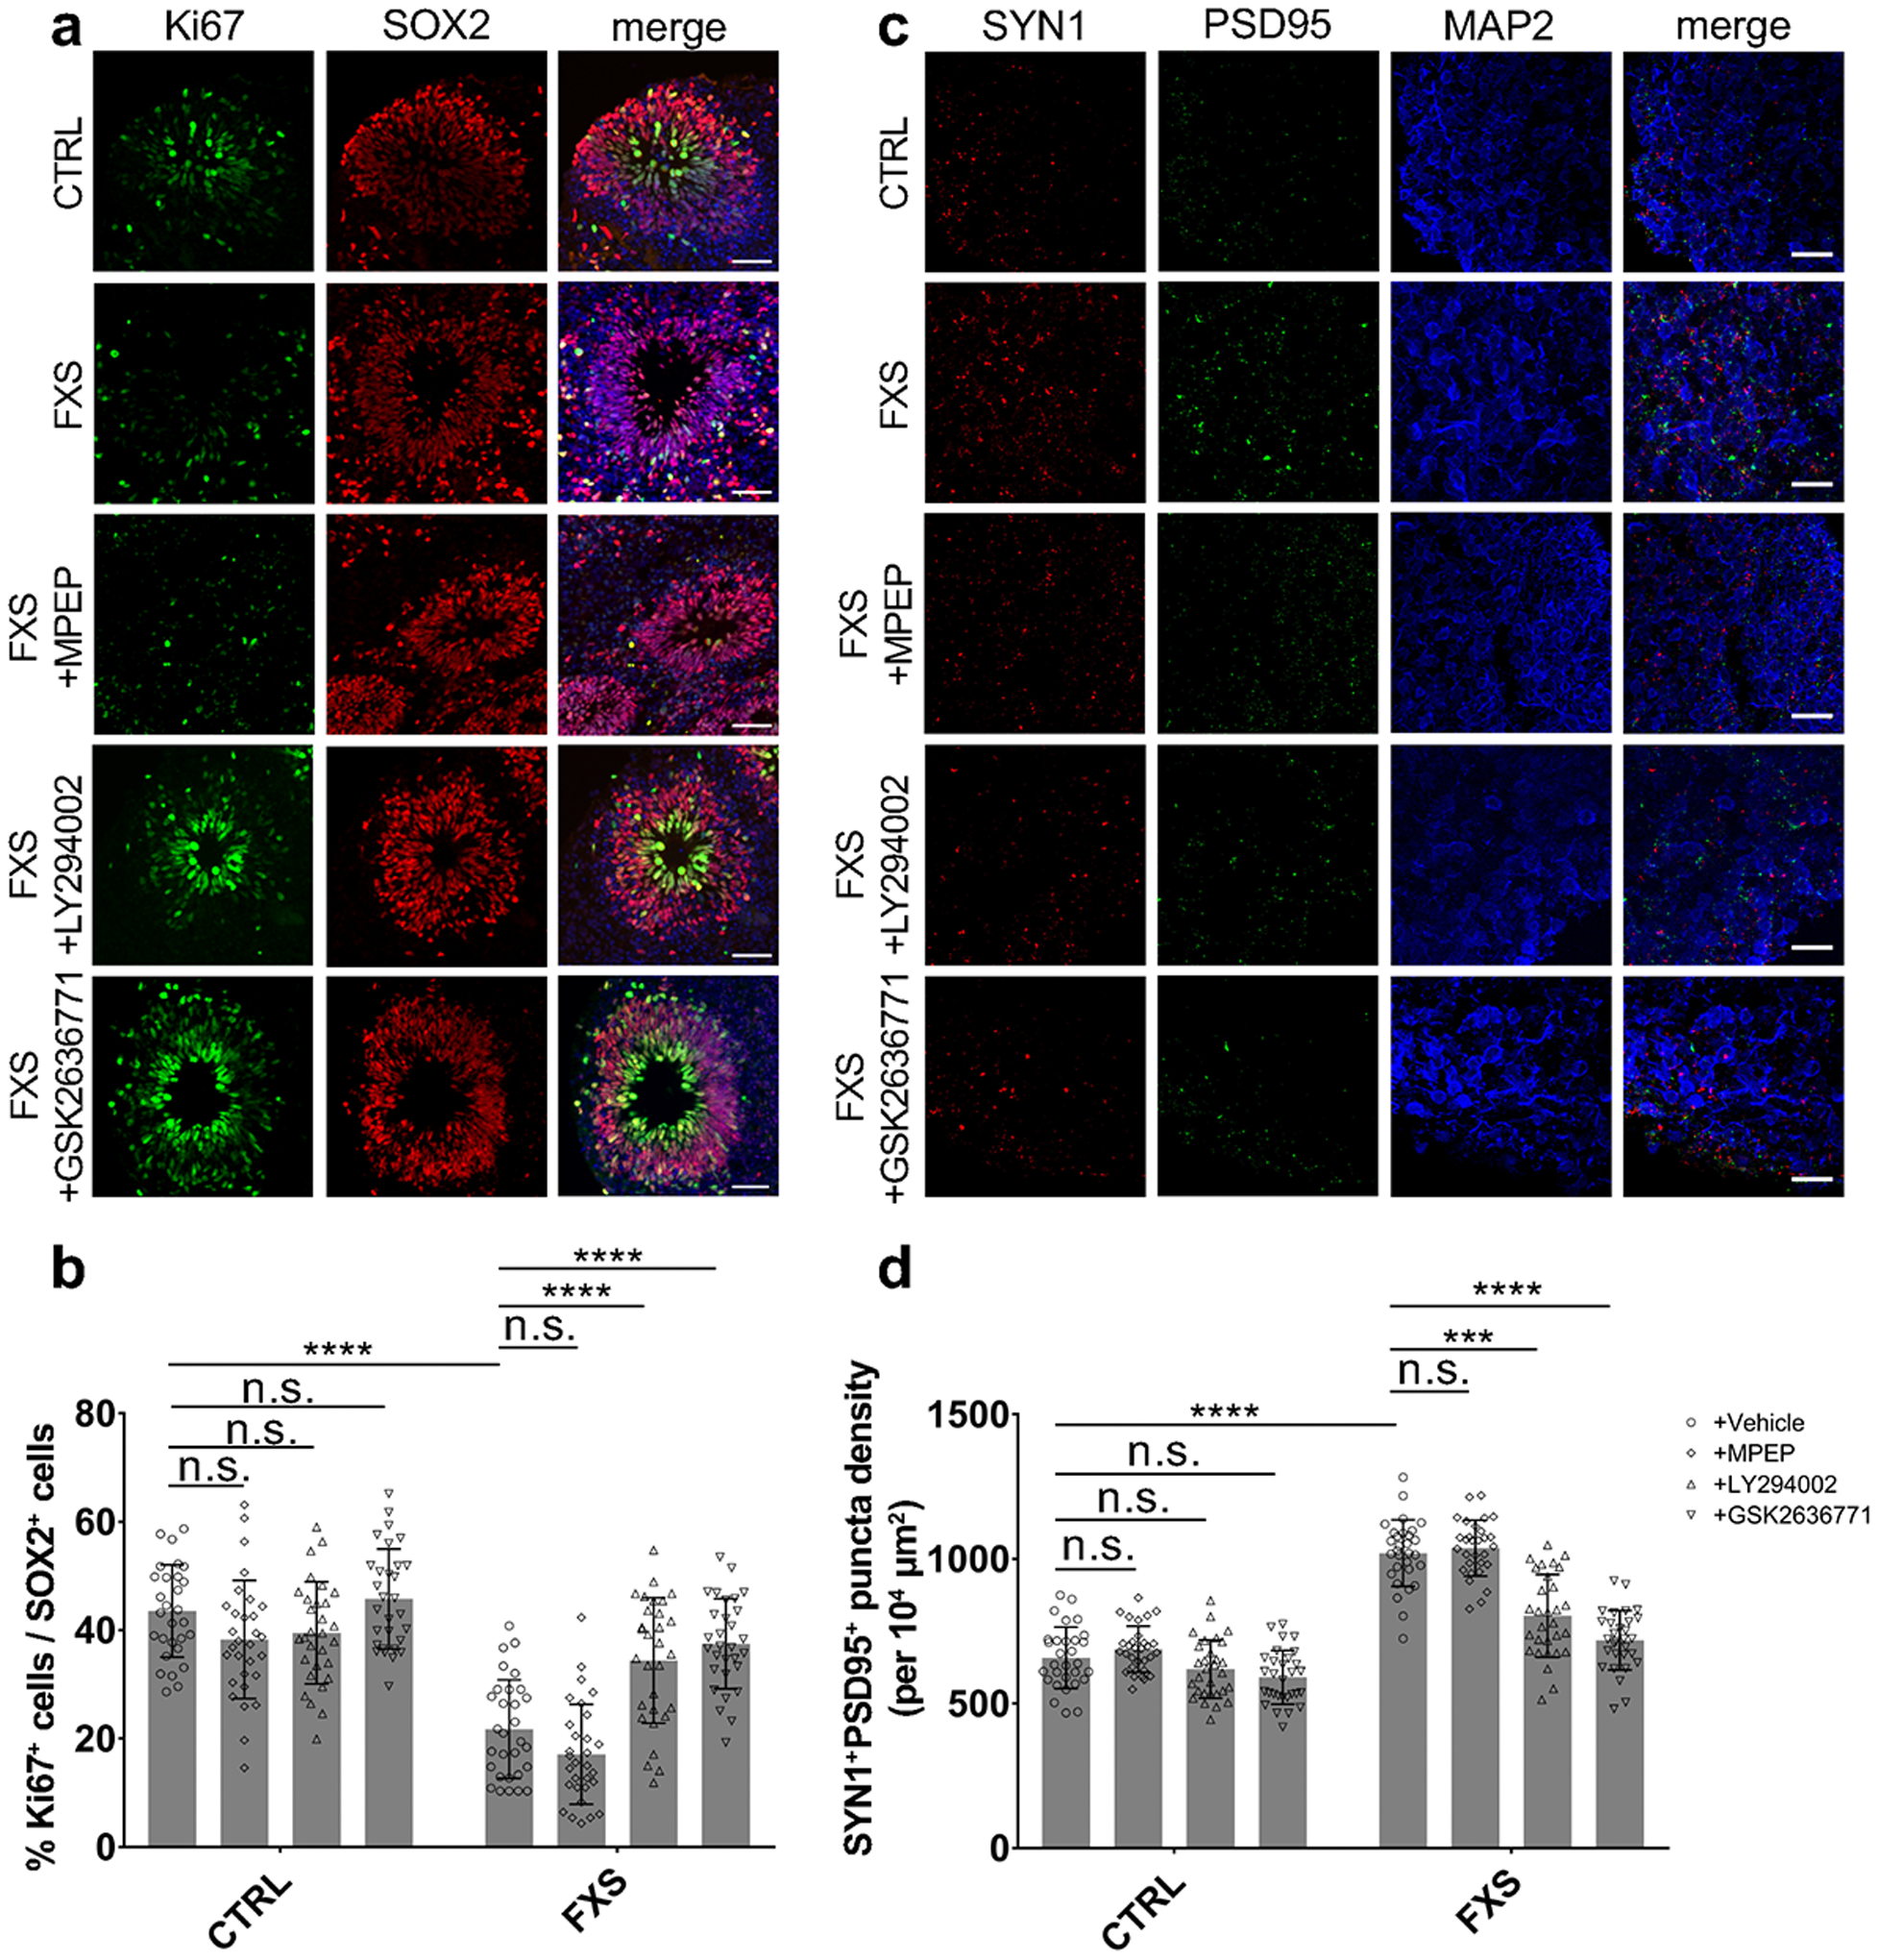
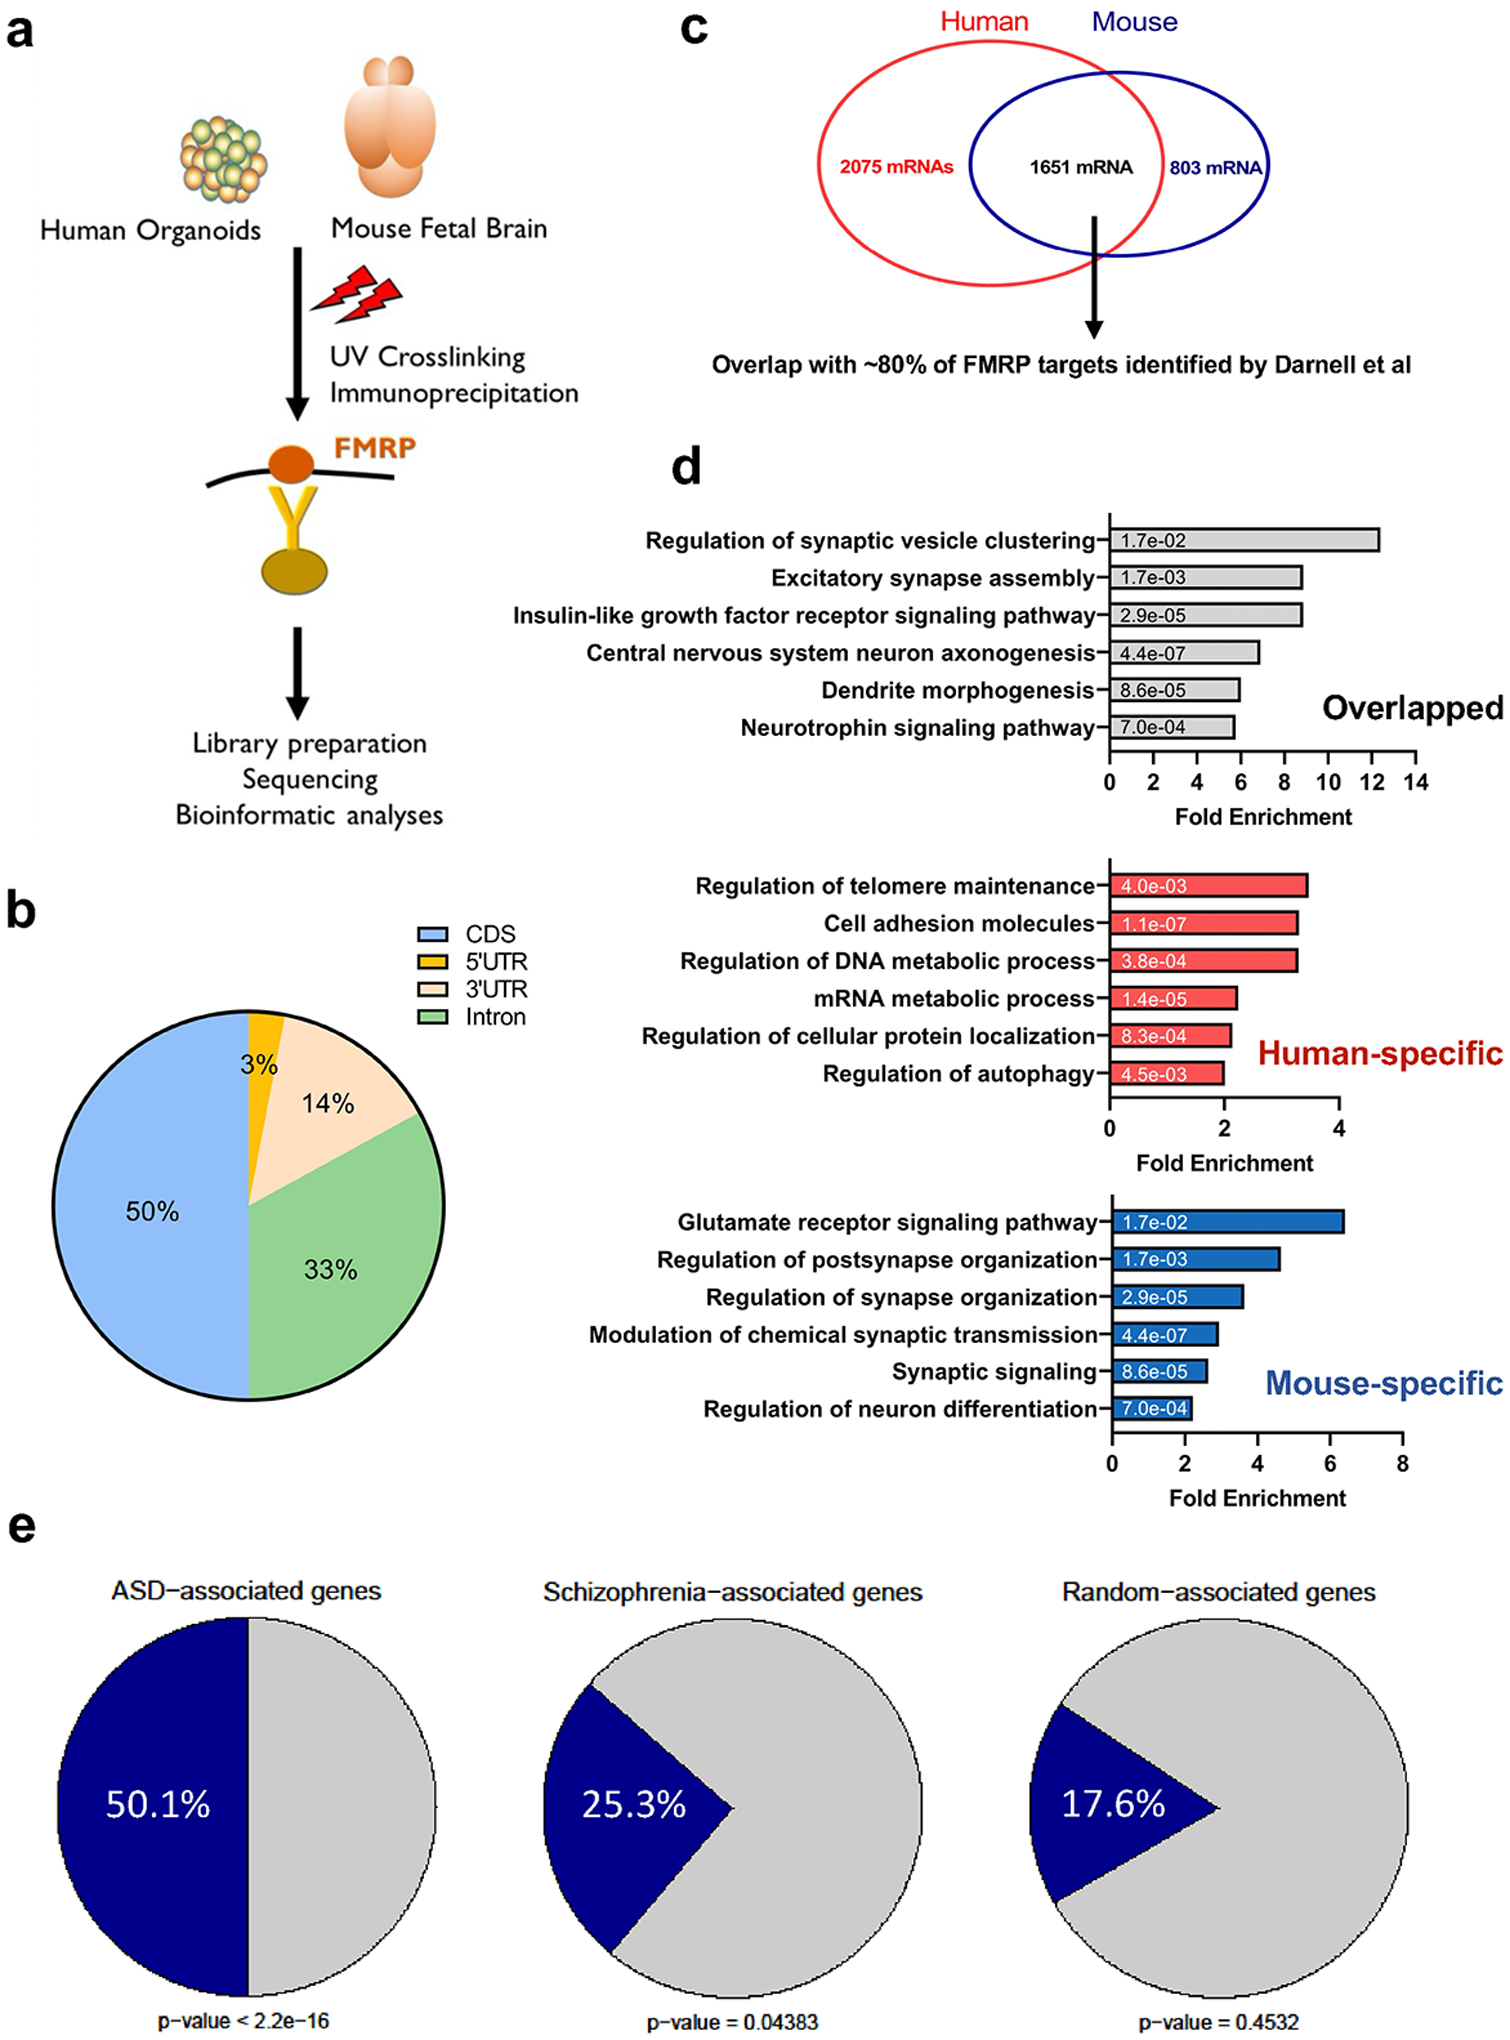
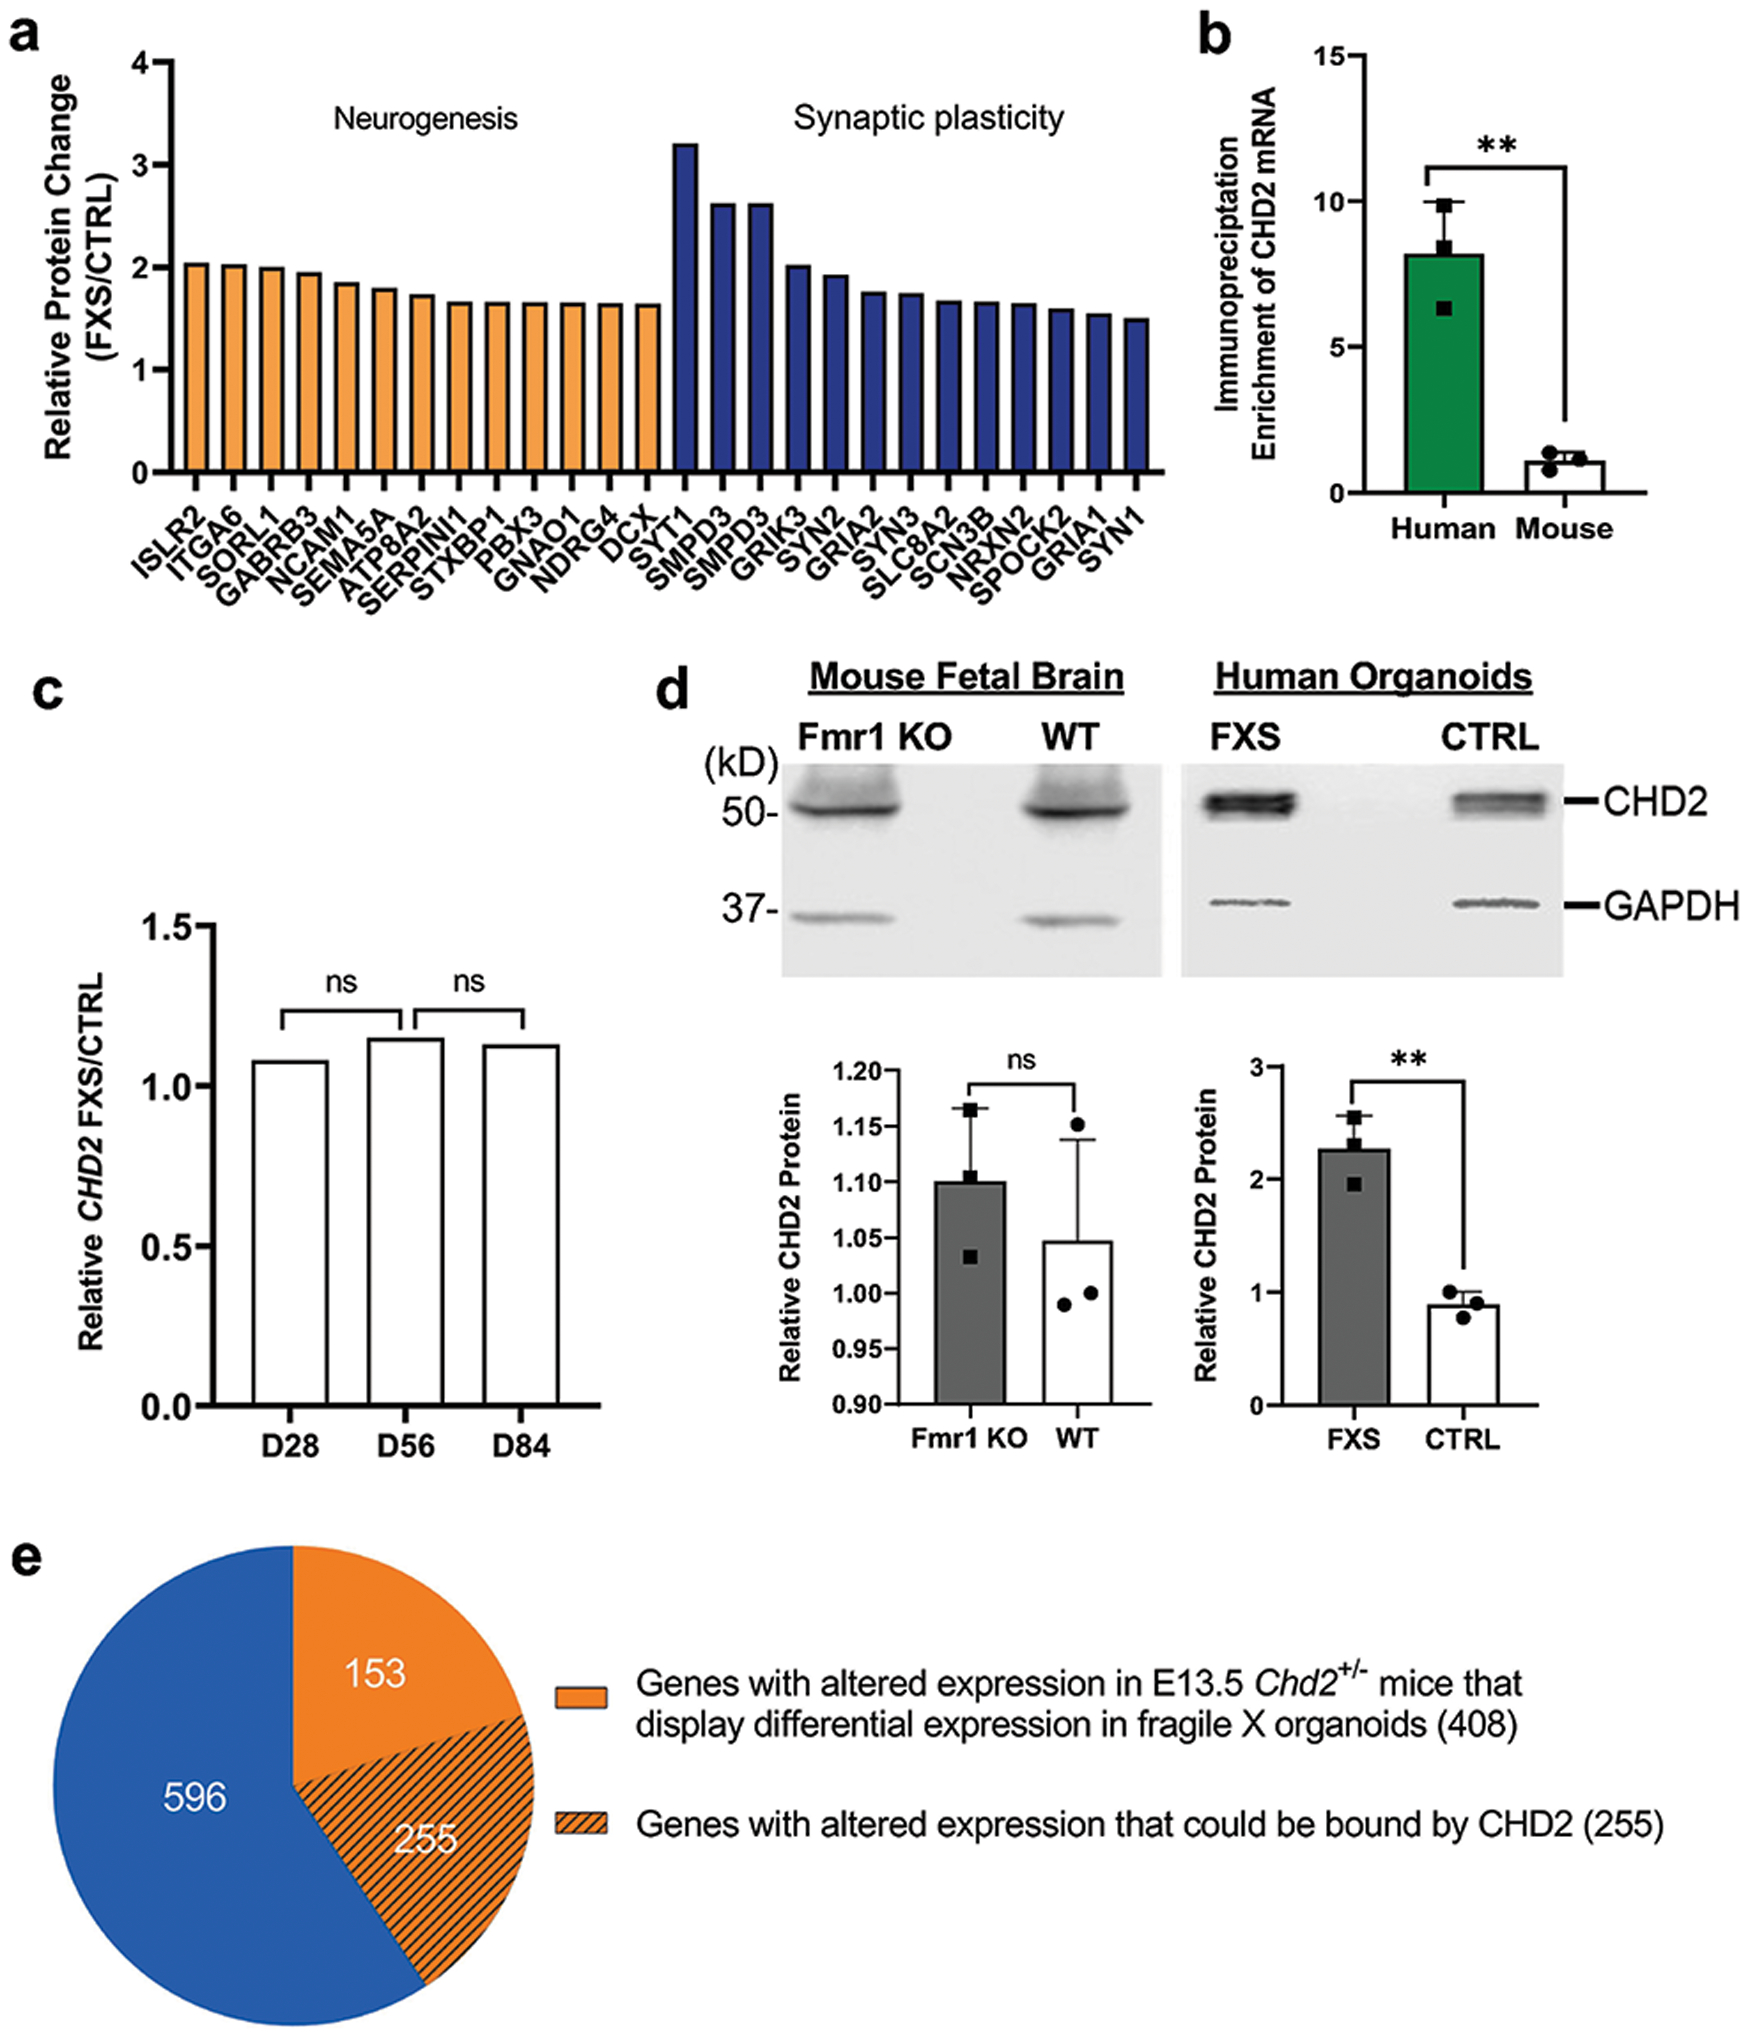
Fragile X syndrome (FXS) is caused by the loss of fragile X mental retardation protein (FMRP), an RNA-binding protein that can regulate the translation of specific mRNAs. In this study, we developed an FXS human forebrain organoid model and observed that the loss of FMRP led to dysregulated neurogenesis, neuronal maturation and neuronal excitability. Bulk and single-cell gene expression analyses of FXS forebrain organoids revealed that the loss of FMRP altered gene expression in a cell-type-specific manner. The developmental deficits in FXS forebrain organoids could be rescued by inhibiting the phosphoinositide 3-kinase pathway but not the metabotropic glutamate pathway disrupted in the FXS mouse model. We identified a large number of human-specific mRNAs bound by FMRP. One of these human-specific FMRP targets, CHD2, contributed to the altered gene expression in FXS organoids. Collectively, our study revealed molecular, cellular and electrophysiological abnormalities associated with the loss of FMRP during human brain development.


Conflict of interest statement

COMPETING FINANCIAL INTERESTS

The authors declare no competing interests.

Figures

Extended Data Fig. 1
Extended Data Fig. 1. FMRP regulates cortical neurogenesis in a human forebrain organoid model.
(a) Quantification of the size of control and FXS forebrain organoids. Data are presented as mean ± s.e.m. (n = 30 organoids from each line; one-way ANOVA). (b-c) Loss of FMRP reduces NPC proliferation. Shown are representative images (b) and quantification (c) of the proportion of Ki67+ proliferating neuronal progenitor cells in total PAX6+ dorsal forebrain neuronal progenitor cells of both control and FXS-derived forebrain organoids at day 56. Data are presented as mean ± s.e.m. (n = 6 organoids from each line with 15–20 cortical structures analyzed per organoid; ****P < 0.0001, one-way ANOVA). Scale bars: 50 μm. (d-e) D56 forebrain organoids were pulsed with EdU (10 μM) for 2 hr. Shown are representative images (d) and quantification (e) of the proportion of EdU+ proliferating cells in total SOX2+ NPCs in both control and FXS-derived forebrain organoids at day 56. Data are presented as mean ± s.e.m. (n = 62 cortical structures from at least ten organoids each condition; ****P < 0.0001, one-way ANOVA). Scale bars: 50 μm.
Extended Data Fig. 2
Extended Data Fig. 2. Loss of FMRP impairs cortical neurodevelopment.
(a) Quantification of the proportions of TBR2+ IPCs, CTIP2+ cortical neurons, and SOX2+ NPCs in total DAPI+ cells in control and FXS-derived forebrain organoids at day 56. Data are presented as mean ± s.e.m. (n = 6 organoids from each line with 15–20 cortical structures analyzed per organoid; ****P < 0.0001, one-way ANOVA). (b-c) Loss of FMRP dysregulates distribution of TBR2+ intermediate neural progenitor cells. Shown are representative images (b) and quantification (c) of the proportion of TBR2+ IPCs in MAP2+ layer of both control and FXS-derived forebrain organoids. Yellow dashed lines indicate the borders of VZ-like structures. Data are presented as mean ± s.e.m. (n = 6 organoids from each condition with 15–20 cortical structures analyzed per organoid; ****P < 0.0001, one-way ANOVA). Scale bars: 50 μm.
Extended Data Fig. 3
Extended Data Fig. 3. Loss of FMRP accelerates cortical layer formation.
(a-b) Shown are sample images (a) and quantification (b) of relative thickness of SOX2+CTIP2VZ layer and CTIP2+ CP layer in day 56 forebrain organoids. Yellow dashed lines indicate the borders between VZ and CP layers. Data are presented as mean ± s.e.m. (n = 15 cortical structures per organoid from at least 12 organoids each line; ***P = 0.0005, ****P < 0.0001, one-way ANOVA). Scale bars: 50 μm. (c-d) Shown are sample images (c) and quantification (d) of relative thickness of SOX2+MAP2 VZ layer and MAP2+ CP layer in day 56 forebrain organoids. Yellow dashed lines indicate the borders between VZ and CP layers. Data are presented as mean ± s.e.m. (n = 15 cortical structures per organoid from at least 12 organoids each line; ****P < 0.0001, two-way ANOVA). Scale bars: 50 μm. (e-f) Shown are sample images (e) and quantification (f) of relative thickness of SOX2+TBR1 VZ layer and TBR1+ CP layer in day 56 forebrain organoids. Yellow dashed lines indicate the borders between VZ and CP layers. Data are presented as mean ± s.e.m. (n = 15 cortical structures per organoid from at least 12 organoids each line; ***P = 0.0009, ****P < 0.0001, one-way ANOVA). Scale bars: 50 μm. (g-h) Quantification of the proportions of TBR1+ cortical neurons (c) and SOX2+ NPCs (d) in total DAPI+ cells in control and FXS-derived forebrain organoids at day 56. Data are presented as mean ± s.e.m. (n = 6 organoids from each line with 15–20 cortical structures analyzed per organoid; ****P < 0.0001, one-way ANOVA). (i-l) Analysis of marker distribution across the VZ/CP layers. Data are presented as mean ± s.e.m. (n = 10 organoids from control or FXS lines each with 15–20 cortical structures analyzed per organoid; ****p < 0.0001; one-way ANOVA).
Extended Data Fig. 4
Extended Data Fig. 4. Loss of FMRP prevents differentiation of GABAergic interneurons.
(a-b) Quantifications of the numbers of GABA+ inhibitory neurons (a) and CaMKIIα+ excitatory neurons (b) in a field of 588 μm X 588 μm in both control and FXS-derived forebrain organoids. Data are presented as mean ± s.e.m. (n = 10 sections from 10 organoids each line; **p = 0.0012 (FXS2 v.s. CTRL1 in b) or 0.0097 (FXS3 v.s. CTRL1 in b), ***p = 0.0008 (b), ****P < 0.0001, one-way ANOVA). (c) Sample images of RNA expression of DLX2, PAX6 and SOX2 by RNAscope in control and FXS forebrain organoids at day 56. Blue staining represents DAPI. Scale bars: 50 μm. (d) Quantification of ratio of DLX2+ MGE-like NPC area v.s. PAX6+ dorsal forebrain NPC area in D28 and D56 control and FXS-derived forebrain organoids. Data are presented as mean ± s.e.m. (n = 5 organoids from each condition with 15–20 sections analyzed per organoid; ****P < 0.0001, one-way ANOVA).
Extended Data Fig. 5
Extended Data Fig. 5. Basic electrophysiological characterization of FXS neurons in forebrain organoids.
(a) Shown are sample images of a CTIP2+ cortical neurons that was filled with Alexa Fluor-594 dye after the electrophysiological recording. Scale bars: 20 μm. Experiment was repeated at least 13 times independently for each condition with similar results. (b-d) Characterization of passive membrane properties, including the resting membrane potential (RMP; b), input resistance (RIN; c), and membrane capacitance (d). Data are presented as mean ± s.e.m. (two-tailed unpaired t test or one-way ANOVA). (e-h) Basic properties of action potentials, including the amplitude (e), threshold (f), half-width (g), and the rise time (h) of the first action potentials. Data are presented as mean ± s.e.m. (two-tailed unpaired t test or one-way ANOVA). (i-k) Characterization of transient inward currents and sustained outward currents of FXS neurons. Shown are sample tracings of transient inward and sustained outward currents (i), quantification of transient inward current-voltage curve (j) and peak density of transient inward currents (k). Data are presented as mean ± s.e.m. (two-tailed unpaired t test or one-way ANOVA). Cell number (n) recorded and analyzed in each condition is indicated.
Extended Data Fig. 6
Extended Data Fig. 6. Expression of Kv4.2 voltage-gated potassium channel in human forebrain organoids.
Sample images (a) and quantification (b) of Western blots are presented for comparing Kv4.2 protein level in D56 control and FXS forebrain organoids using GAPDH as loading control. Data are presented as mean ± s.d. (n = 3 cultures; **P = 0.0085 (FXS1 v.s. CTRL1) or 0.0033 (FXS2 v.s. CTRL1), ***P = 0.0003, one-way ANOVA).
Extended Data Fig. 7
Extended Data Fig. 7. The PANTHER overrepresentation test on the upregulated genes in FXS organoid at each stage show enrichment in distinct pathways.
The upregulated genes in FXS at a given developmental stage, D28, D56, or D84 show specific pathway enrichment. The upregulated genes at D28 in FXS organoids are enriched in ciliary locomotion of neuron, axoneme assembly, and other synaptogenesis related pathways while the up-regulated genes at D56 in FXS organoids show more relevance to the pathways associated with synaptic function. Interestingly, genes with higher expression in FXS than in control organoids at the more developed D84 are concentrated in DNA replication, cell division and cell cycle pathways. This suggests aberrant developmental manifestation in FXS organoids. The numbers on the bars indicate the two-sided p values by Fisher’s exact test. The p values have been adjusted for multiple testing using Bonferroni correction.
Extended Data Fig. 8
Extended Data Fig. 8. Lack of FMRP causes altered neural differentiation and aberrant developmental trajectory in forebrain organoids.
(a) A heat map of expression of annotation reference genes in 14 cell type specific clusters present during human forebrain organoids shows the differential expression of various marker genes for specific cell types in each cluster. (C1: fate determining stage neurons toward excitatory neuron, C2: excitatory neuron, C3: neural stem cell /radial glia2, C4: immature neuron, C5: neural stem cell /radial glia1 cell, C6: glial progenitor, C7: inhibitory neuron, C8: astrocyte, C9: radial glia, C10: astrocyte, C11: immature neuron very early stage, C12: oligodendrocyte, C13: ectodermal origin non-neuronal cells, C14: non-neuronal cells) (b) The expression of neural stem cell/progenitor marker, SOX2 (red) and differentiated cortical plate neuron marker, BCL11B (CTIP2, green) were presented simultaneously in the UMAP plot. Compared to control, cells in FXS organoids expressing BCL11B/CTIP2 at low level were increased and widely distributed spanning various cell types regardless of differentiation status and cell function. Many of these are accompanied by the expression of SOX2. Significantly high co-expression rate of the NPC marker, SOX2, and cortical plate marker, BCL11B in the C7, young inhibitory neuron cluster (19% in FXS forebrain organoids compared to 0% in control forebrain organoids), suggest that the spatiotemporal regulation of SOX2 and BCL11B expression critical for proper specification and lamination of neurons is severely perturbed in FXS organoids. Data are presented as mean ± s.e.m. (n=3 single cell RNAseq of 3 independent culture sets, **P=0.0025, two-tailed unpaired t test) (c) Among the 14 clusters, the highest number of DEGs were detected in the young inhibitory neuron cluster, C7. PANTHER analyses show high relevance to regulation of synapse organization, learning and memory, and forebrain development with down-regulated DEGs and protein targeting. mRNA stability and regulation of cell cycle. Yellow represents up-regulated genes and blue represents down-regulated genes. The numbers on the bars are the associated two-sided p-values by Fisher’s Exact test. The p values have been adjusted for multiple testing using Bonferroni correction. (d) Transcriptional features of the cluster 6 at the developmental break point between FXS and control (arrow in red) in the time trajectory was assessed. The Monocle cluster 4, one of the major break point in the time trajectory, has marker genes associated with cell proliferation and regulation of DNA methylation, (e.g., KMT2A), neuron migration and regulation of neuron projection development (ACAP3), synapse organization and axon guidance (NFASC).
Extended Data Fig. 9
Extended Data Fig. 9. The overlap between human fetal brain DEGs and cell type specific DEGs.
(a) all single cell cluster specific DEGs were compared with human fragile X fetal brain RNAseq DEGs. The highest overlap is marked with an asterisk above the bar. (b) PANTHER gene ontology revealed that theyare involved in GABAergic neuron differentiation, forebrain neuron generation and differentiation. Downregulated genes are enriched in regulation of neural precursor cell, neurogenesis and proliferation, cerebral cortex and forebrain development, gliogenesis, and cell differentiation. The numbers on the bars are two-sdied p-values by Fisher’s exact test. The p values have been adjusted for multiple testing using Bonferroni correction.
Extended Data Fig. 10
Extended Data Fig. 10. An overlap between disease risk genes and the subset of human and mouse FMRP binding genes are shown.
The percentage of overlap between Schizophrenia and ASD risk genes and human-specific, mouse-specific or human-mouse shared FMRP binding genes are indicated. Statistical significance was calculated by Pearson’s χ2 tests, and p-values are indicated.
Figure 1.
Figure 1.. FMRP regulates cortical neurogenesis in a human forebrain organoid model.
(a-b) Loss of FMRP reduces NPC proliferation. Shown are representative images (a) and stereological quantification (b) of the proportion of Ki67+ proliferating neuronal progenitor cells in both control and FXS-derived forebrain organoids at day 56. Yellow dashed lines indicate the borders of VZ-like structures. Data are presented as mean ± s.e.m. (n = 10 organoids from each line with 15–20 cortical structures analyzed per organoid; ***P = 0.0002 (FXS2 v.s. CTRL1) or 0.0001 (FXS3 v.s. CTRL1), ****P < 0.0001 (FXS1 v.s. CTRL1), one-way ANOVA). Scale bars: 50 μm. (c-d) FMRP deficiency accelerates NPC cell cycle exit during the 24-hour EdU exposure in FXS forebrain organoids. Shown are representative images (c) and quantification (d) of the proportion of Ki67 NPCs in total EdU+ cells in both control and FXS-derived forebrain organoids after 24-hour EdU exposure. Yellow dashed lines indicate the borders of VZ-like structures. Data are presented as mean ± s.e.m. (n = 29 cortical structures from at least ten organoids each condition; ****P < 0.0001, one sided student’s t-test). Scale bars: 50 μm. (e-f) Loss of FMRP accelerates neural differentiation. Day 49 control and FXS forebrain organoids were infected with retroviruses expressing GFP and analyzed 7 days later (day 56). Shown are sample images for immunostaining for GFP, SOX2 and MAP2 (e) and quantifications of percentages of MAP2+GFP+ cells among all GFP+ cells (f). Values represent mean ± s.e.m. (n = 6 organoids from control or FXS lines each with 10–12 cortical structures analyzed per organoid; ****p < 0.0001; one sided student’s t test). Scale bars: 50 μm.
Figure 2.
Figure 2.. Loss of FMRP impairs cortical neurodevelopment.
(a-b) Loss of FMRP dysregulates distribution of TBR2+ intermediate neural progenitor cells. Shown are representative images (a) and quantification (b) of the proportion of TBR2+ IPCs in CTIP2+ layer of both control and FXS-derived forebrain organoids. Yellow dashed lines indicate the borders of VZ-like structures. Data are presented as mean ± s.e.m. (n = 10 organoids from each line with 15–20 cortical structures analyzed per organoid; *** P = 0.0001, ****P < 0.0001, one-way ANOVA). Scale bars: 50 μm. (c-d) FMRP deficiency induces premature neural differentiation. Shown are sample images for immunostaining for PAX6, DCX, and MAP2 (c) and quantifications of relative expression level of DCX in PAX6+ NPCs in the VZ-like structures (d). Yellow dashed lines indicate the borders of VZ-like structures. Values represent mean ± s.e.m. (n = 10 organoids from control or FXS lines each with 15–20 cortical structures analyzed per organoid; ****p < 0.0001; one sided student’s t test). Scale bars: 50 μm. (e-i) Loss of FMRP alters cortical layer formation. Shown in (e) are sample images of the expanded neuroepithelium in D56 control and FXS organoids stained with SOX2 and CTIP2. Scale bars: 50 μm. Shown in (f-i) are quantifications of distributions of SOX2 (f), PAX6 (g), CTIP2 (h), and TBR1 (i) in the entire span of the neuroepithelium which was divided into five equal portions (bins). Data are presented as mean ± s.e.m. (n = 10 organoids from control or FXS lines each with 15–20 cortical structures analyzed per organoid; *p = 0.0240 (h) or 0.0488 (i), **p = 0.0014 (h), ****p < 0.0001; one-way ANOVA). (j-k) Loss of FMRP prevents differentiation of GABAergic interneurons. Shown are sample images for immunostaining for CaMKIIα, GABA, and MAP2 (g) and quantification (h) of percentages of GABA+ inhibitory neurons (left) and CaMKIIα+ excitatory neurons (right) in total DAPI+ cells in both control and FXS-derived forebrain organoids. Data are presented as mean ± s.e.m. (n = 10 sections from 10 organoids each line; ****P < 0.0001, one-way ANOVA). Scale bars: 50 μm.
Figure 3.
Figure 3.. Loss of FMRP alters synapse formation and enhances neuronal excitability.
(a-b) Loss of FMRP accelerates synapse formation. Shown are sample images (a) and quantification (b) of SYN1+PSD95+ puncta density in both control and FXS-derived forebrain organoids at day 56. Data are presented as mean ± s.e.m. (n = 10 organoids each line; ****P < 0.0001, one-way ANOVA). Scale bars: 50 μm. (c-f) FXS forebrain organoids exhibit hyperexcitability. Shown in (c) are sample tracings of action potentials (left) and quantification of action potential frequency (right); (d) are sample tracing of the first action potential (left) and quantification of the decay time of first action potential (right); (e,f) are quantification of current-voltage curve (e) and peak current density (f). Cell number (n) recorded and analyzed in each condition is indicated. Data are presented as mean ± s.e.m. (*P = 0.0336 (c), 0.0421 (d), 0.0173 (f), two-tailed unpaired t test or one-way ANOVA).
Figure 4.
Figure 4.. Loss of FMRP causes a more pervasive gene expression alteration in forebrain organoids than in mouse brain.
(a) Heatmap of the ratios of mRNA expression in FXS forebrain over control organoids at day 28, 56, and 84 is presented. Row normalization and ordering were applied for visualization purpose. (b) Bar plot of overlap of differentially expressed genes (DEG) in fragile X human fetal cortical tissue and DEG of forebrain organoids at day 28, 56, and 84. We only considered the DEG from human fetal tissue and DEG from forebrain organoids that showed the same directional change. (c) Shown is a volcano plot of gene expression change at day 56 human forebrain organoids (left panel) and in mouse fetal brain (right panel) upon lack of FMRP. Colored dots indicate statistically significant genes with false discovery rate < 0.20. Blue dots are down-regulated genes (log fold change < 0) and yellow dots are up-regulated genes (log fold change > 0) in FXS compared to controls. (d) GO Ontology overrepresentation tests using PANTHER (http://www.pantherdb.org/) for DEG identified from day 56 forebrain organoid RNA-seq is shown and the numbers on the bars are two-sided p-values by Fisher’s exact test. P values have been adjusted for multiple testing by Bonferroni correction. The overlapping analyses with the up and down-regulated genes are presented in Supplementary Fig. 5. (e) Interactome plot of forebrain development (GO: 0030900) is presented. Significant DE genes found in day 56 forebrain organoid RNA-seq results are shown and highlighted. Yellow represents up-regulated genes and blue represents down-regulated genes.
Figure 5.
Figure 5.. Lack of FMRP causes altered neural differentiation and aberrant developmental trajectory in forebrain organoids.
(a) Shown in the right panel is a heat map showing the normalized and scaled gene expression level in forebrain organoids at day 56 and bar plots of gene ontology analyses using PANTHER overrepresentation test on 100 upregulated genes (yellow bars) and 100 downregulated genes (blue bars) in left panel. FMR1 is shown on the top row. The numbers on the bars are two-sided p-values by Fisher’s exact test. P values have been adjusted for multiple testing by Bonferroni correction. (b) UMAP plots of control and FXS show the differential change in the population of specific cell types in FXS compared to control (left). Individual clusters were defined and annotated to distinct neural cell types (right). (c) UMAP plots of DCX, an immature neuron marker, and TUBB3, a mature neuron marker, reveal developmental progression alterations in FXS compared to control. (d) Twenty-two Monocle 3 clusters were identified and cluster-specific marker genes were determined (left). The overall pseudo-time trajectory of cells was obtained. The developmental trajectory indicated as a blue line for the FXS trajectory is quite distinct from the control organoid time trajectory in red (right). Branches are indicated in yellow dots. The progression direction is indicated by black arrowheads.
Figure 6.
Figure 6.. PI3K inhibitors, not an mGluR5 antagonist, rescue neurodevelopmental defects in FXS organoids.
Both control and FXS-derived forebrain organoids were treated by pan-PI3K inhibitor LY294002 (10 μM), selective PI3Kβ inhibitor GSK2636771 (1 μM), mGluR5 antagonist MPEP (10 μM), or DMSO (vehicle) from day 42 to day 56 for two weeks. (a-b) Inhibition of PI3K increases NPC proliferation in FXS organoids. Representative images (a) and quantification (b) of the proportion of Ki67+ neuronal progenitor cells under different treatment conditions in both control and FXS-derived forebrain organoids at day 56. Data are presented as mean ± s.d. (n = 30 sections from at least from 10 organoids each condition; ****P < 0.0001, two-way ANOVA). Scale bars: 50 μm. (c-d) Inhibition of PI3K recues deficit of synaptic formation in FXS organoids. Shown are sample images (c) and quantification (d) of SYN1+PSD95+ puncta density under different treatment conditions in both control and FXS-derived forebrain organoids. Data are presented as mean ± s.d. (n = 30 sections from at least from 10 organoids each condition; ***P = 0.0002, ****P < 0.0001, two-way ANOVA). Scale bars: 50 μm.
Figure 7.
Figure 7.. Identification of human FMRP mRNA targets
(a) A schematic plot demonstrates the experimental procedure for eCLIP using human forebrain organoids and mouse fetal brains. (b) Pie charts display the genomic location of all human FMRP-binding sites identified from eCLIP using human forebrain organoids, mostly in CDS. (c) The number of FMRP targets and the overlap between human and mouse eCLIP genes are shown in the Venn diagram. The shared eCLIP mRNAs overlap with more than 80 percent of FMRP targets previously identified by Darnell et al. (p < 2.2e-16 using Person’s Chi-square test). (d) Shown are bar plots of gene ontology analyses using PANTHER overrepresentation test on the human-specific, the mouse-specific, and the shared FMRP targets. Numbers on the bars indicate the two-sided p-values by Fisher’s exact test and the x-axis represents fold enrichment. P values have been adjusted for multiple testing by Bonferroni correction. (e) A significant overlap between autism spectrum disorders (ASD)-related risk genes, schizophrenia (SCZ)-related risk genes and FMRP binding genes are indicated. The genes that are randomly selected did not show significant enrichment. Statistical significance was calculated by Pearson’s χ2 tests, and p-values are indicated.
Figure 8.
Figure 8.. CHD2 is a human-specific mRNA target of FMRP.
(a) FMRP target genes identified by eCLIP and related to neurogenesis and synaptic plasticity showed alteration at the protein expression level. (b) Shown is the fold enrichment of CHD2 mRNA by FMRP immunoprecipitation followed by qRT-PCR in human forebrain organoids and mouse brain. Data are presented as mean ± s.e.m. (N=3, ** P=0.0024, two-tailed t test). (c) CHD2 mRNA level did not display significant alteration in D28, D56, and D84 fragile X forebrain organoids based on chi-square test. “ns” indicates that it is not statistically significant (p-value > 0.05). (d) Western blots are presented for comparing the CHD2 protein level in human organoids (Control vs FXS) and mouse embryonic brains (WT vs. Fmr1 KO) using GAPDH as loading control. Upper panel shows Western blot of CHD2 and GAPDH and the lower panel is quantification of the Western blot in human (lower left, N=3, ** P=0.0016, two-tailed t test) and mouse (lower right, N=3, NS P>0.05, two-tailed t-test). Data are presented as mean ± s.e.m. (e) Shown is overlap of the DE genes between FXS organoids and E13.5 Chd2+/− mice. Approximately half of the common DE genes (408) between human forebrain organoids and Chd2+/− mice were also verified to be bound by CHD2 in human cell (255).

References

    1. Santoro MR, Bray SM & Warren ST Molecular mechanisms of fragile X syndrome: a twenty-year perspective. Annual review of pathology 7, 219–245 (2012). - PubMed
    1. Richter JD, Bassell GJ & Klann E Dysregulation and restoration of translational homeostasis in fragile X syndrome. Nat Rev Neurosci 16, 595–605 (2015). - PMC - PubMed
    1. Nelson DL, Orr HT & Warren ST The unstable repeats--three evolving faces of neurological disease. Neuron 77, 825–843 (2013). - PMC - PubMed
    1. Hagerman RJ, et al.Fragile X syndrome. Nat Rev Dis Primers 3, 17065 (2017). - PubMed
    1. Lancaster MA, et al.Cerebral organoids model human brain development and microcephaly. Nature 501, 373–379 (2013). - PMC - PubMed

Publication types

MeSH terms