. 2021 Oct;24(10):1429-1440.
doi: 10.1038/s41593-021-00912-7. Epub 2021 Aug 19.

Divergent projections of the paraventricular nucleus of the thalamus mediate the selection of passive and active defensive behaviors

Affiliations

Divergent projections of the paraventricular nucleus of the thalamus mediate the selection of passive and active defensive behaviors

Jun Ma et al. Nat Neurosci. 2021 Oct.

Abstract

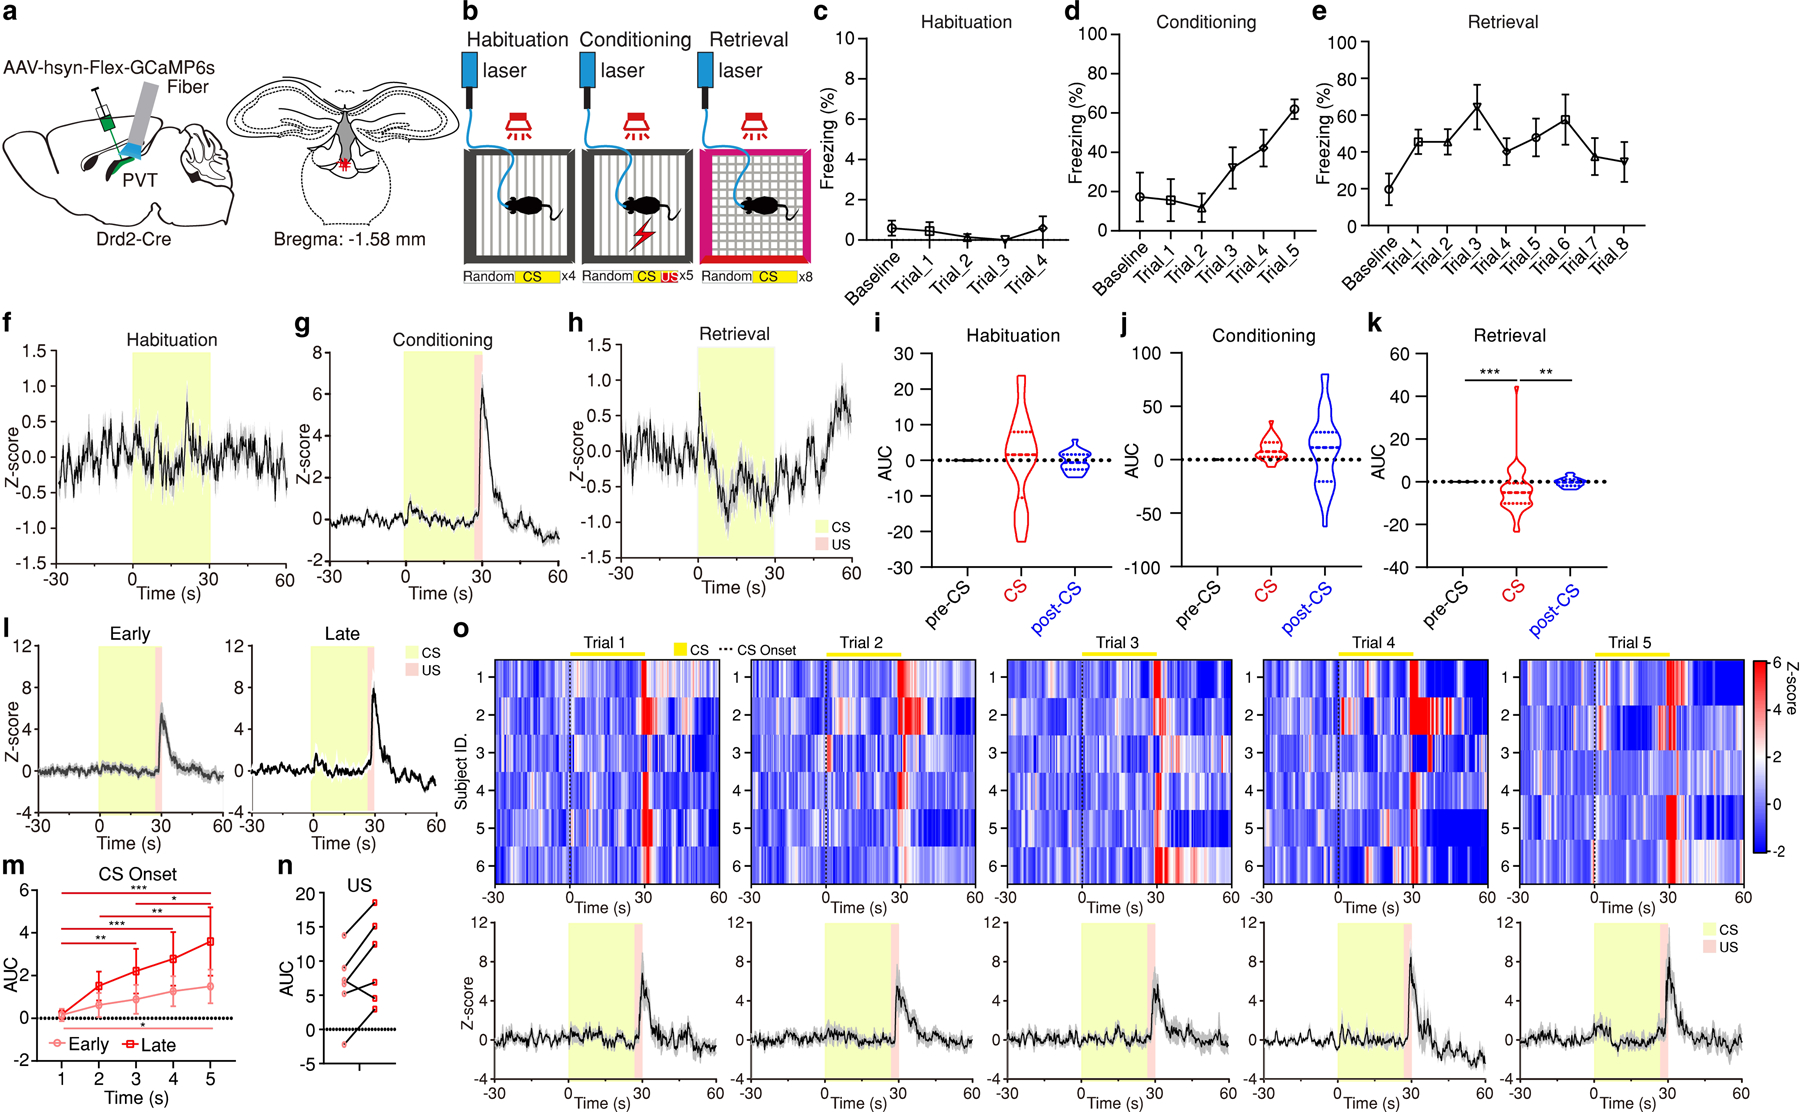
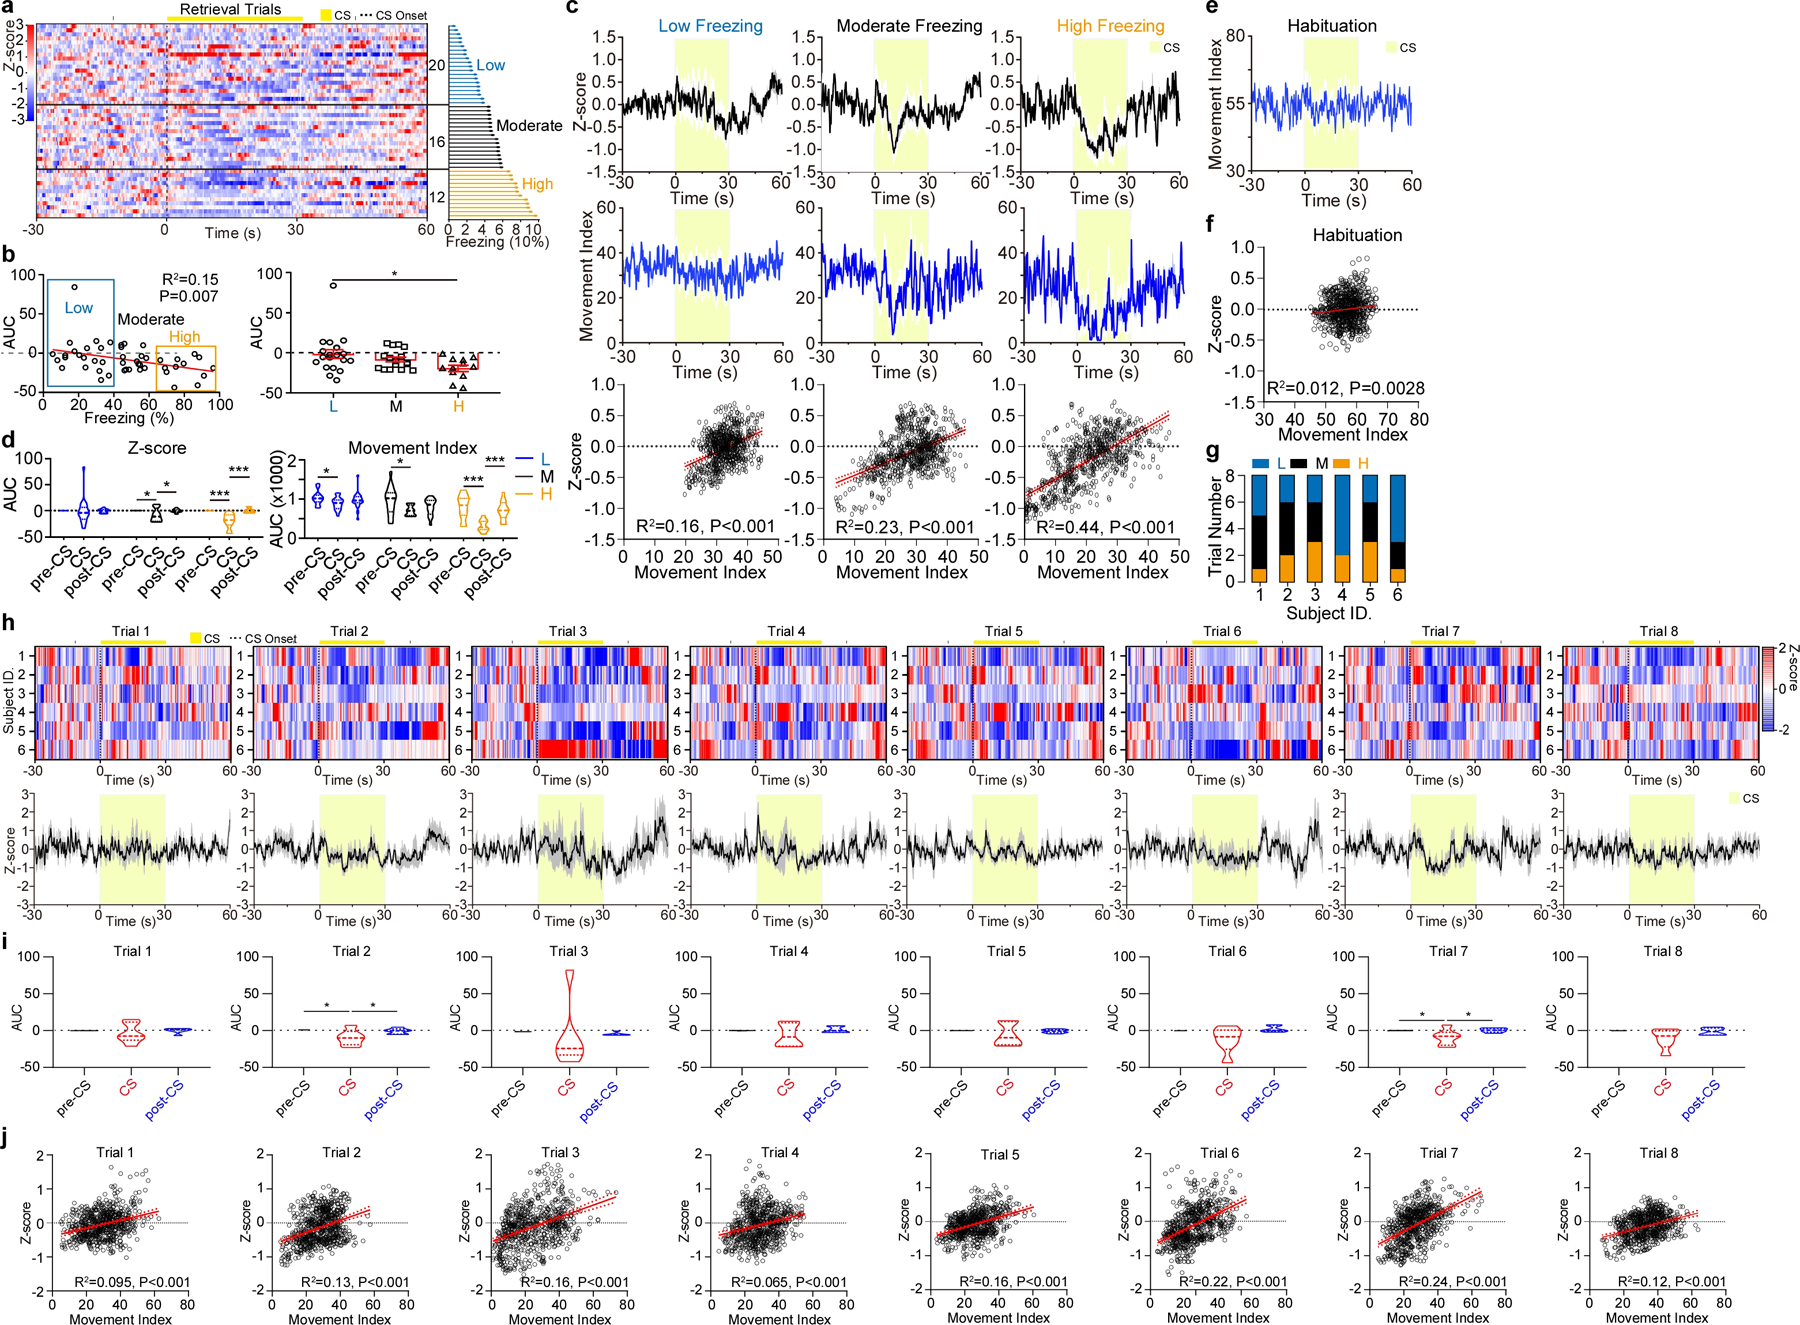
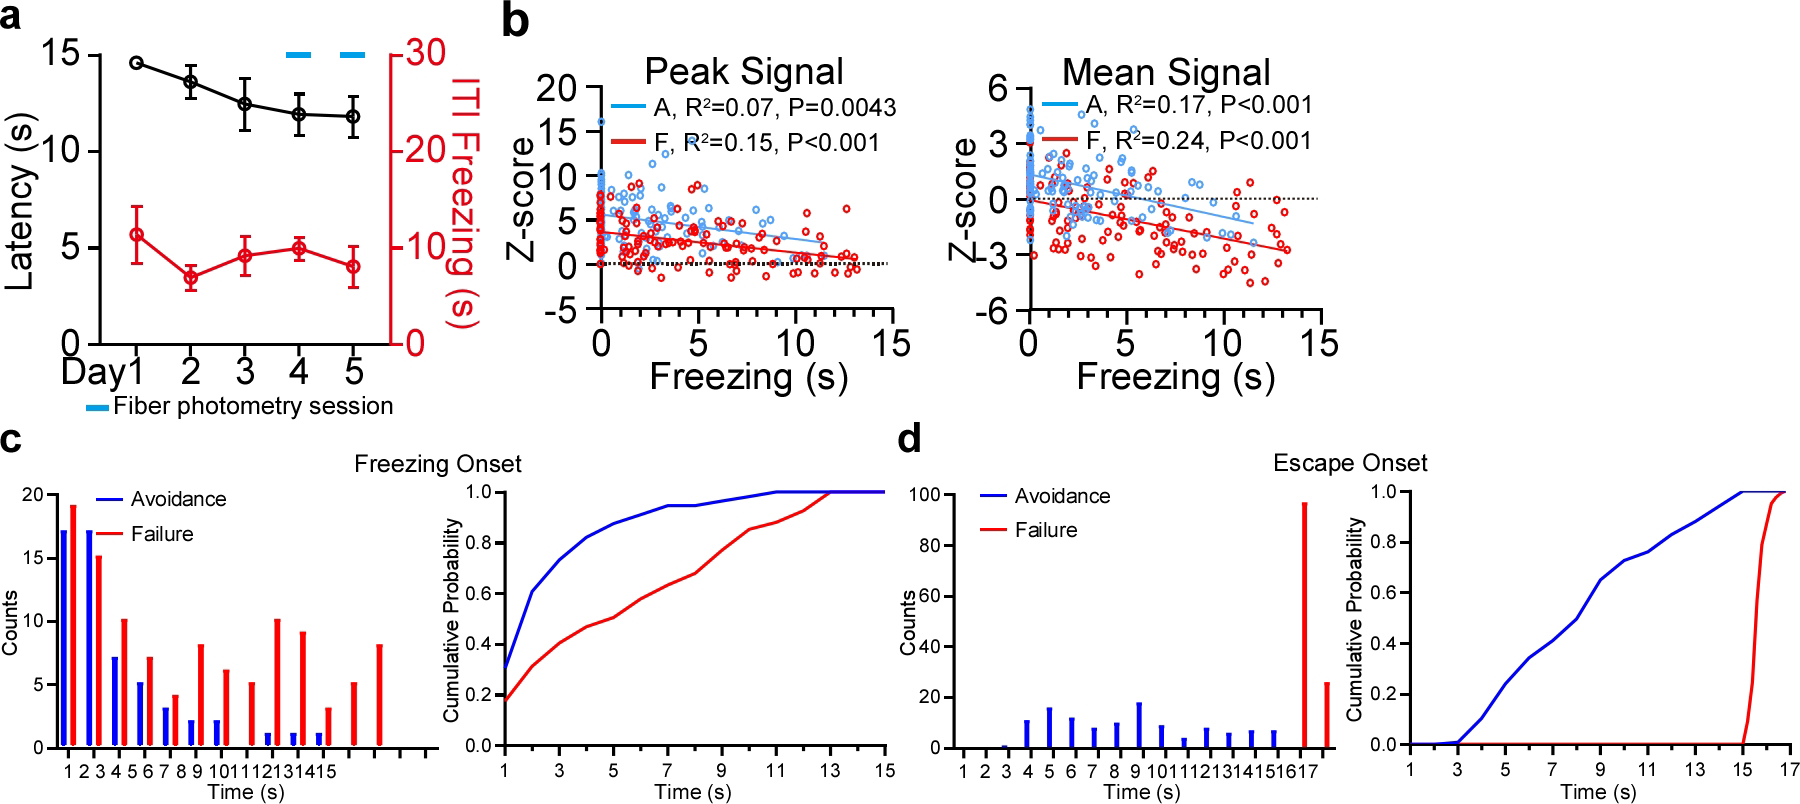
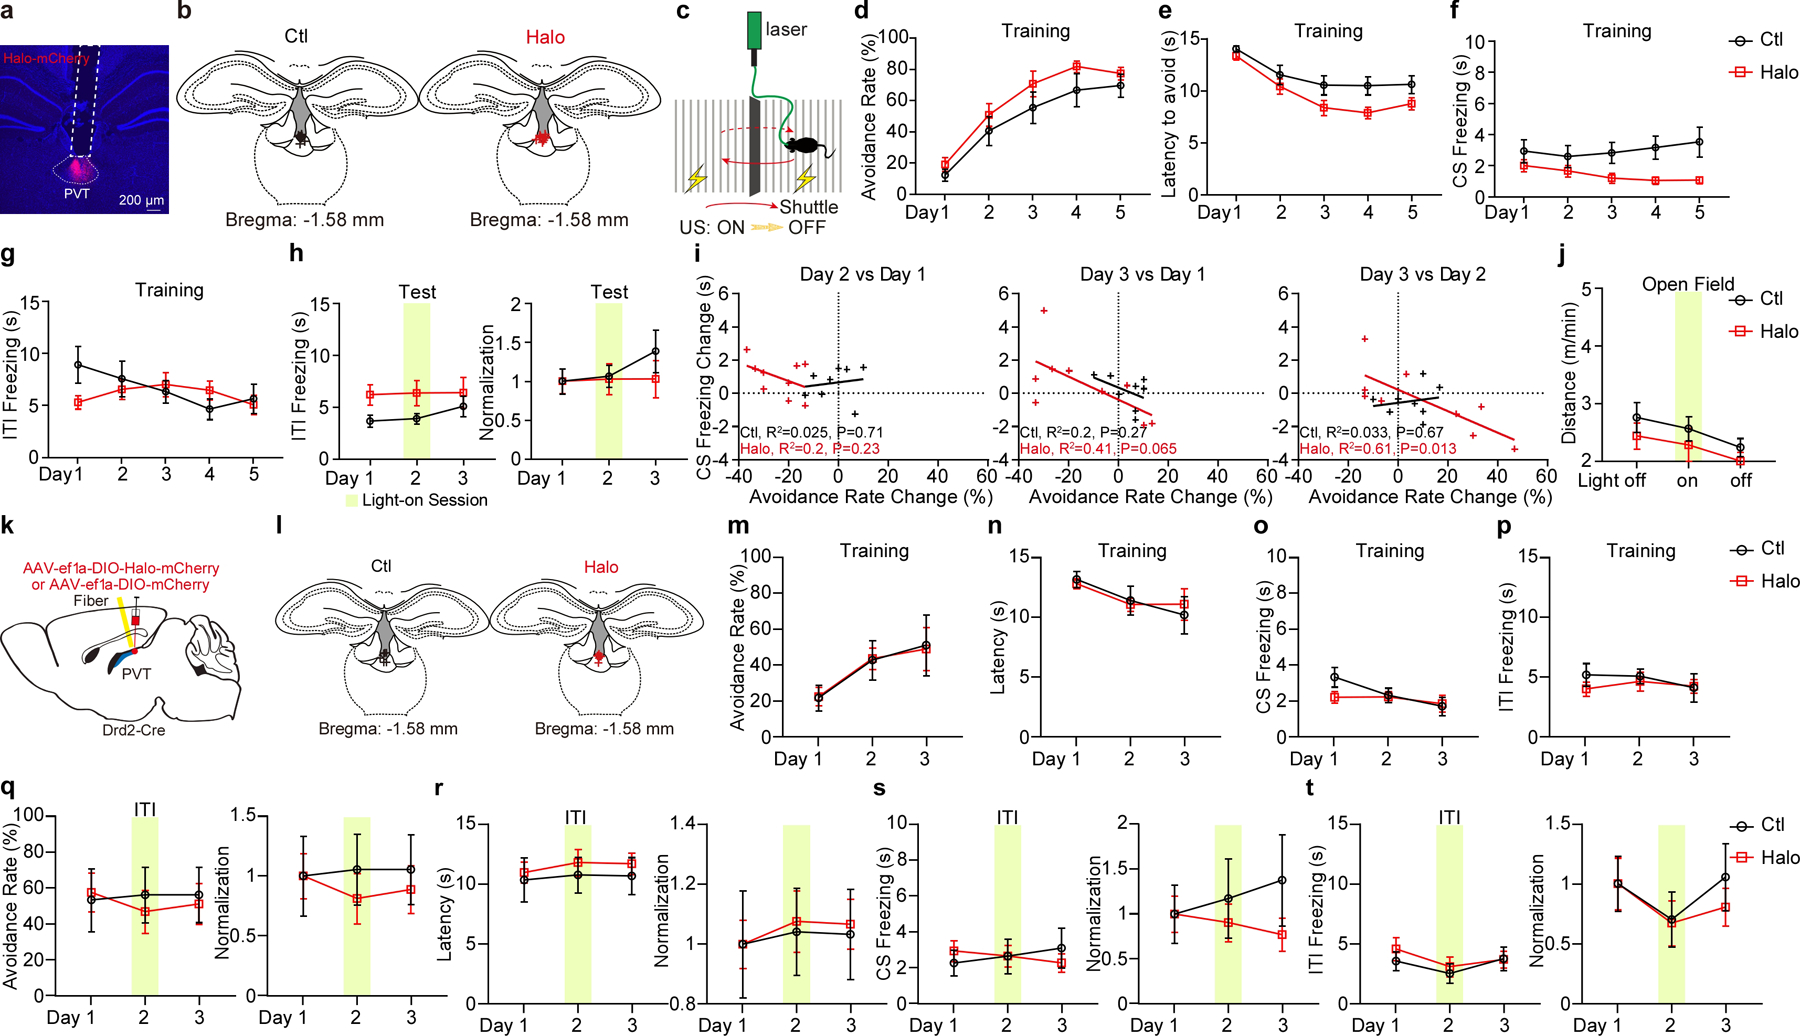
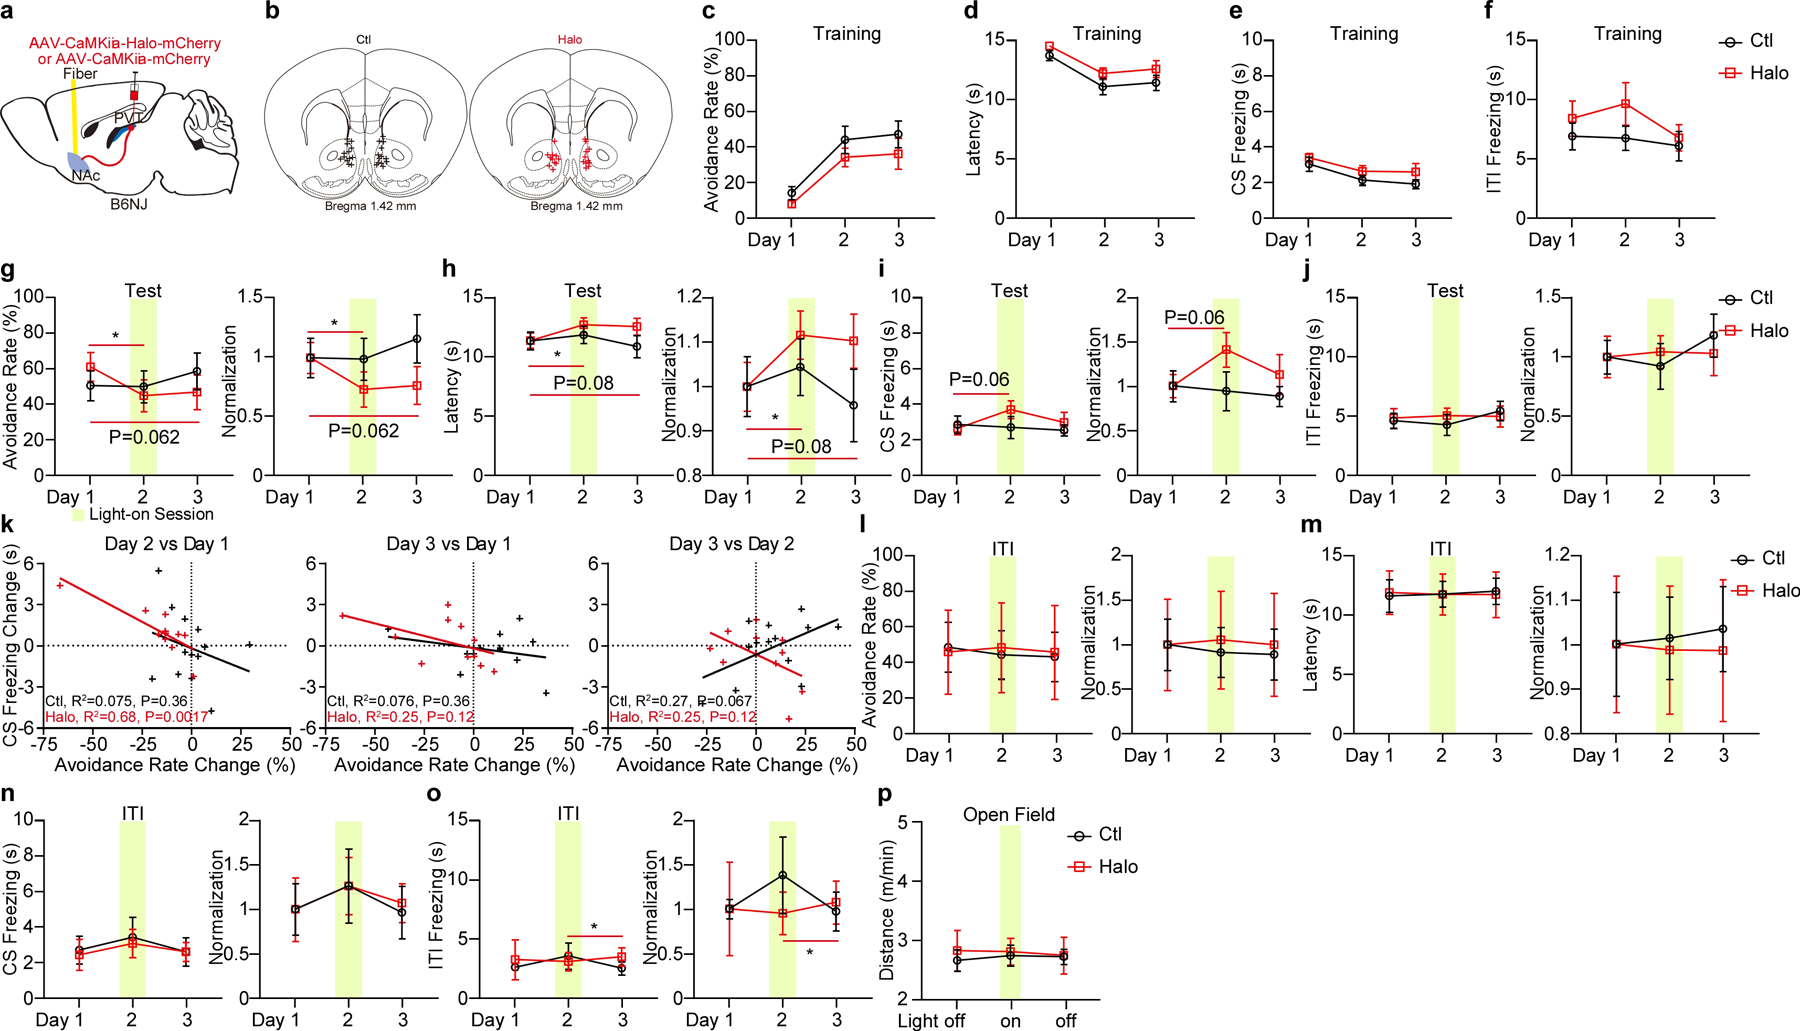
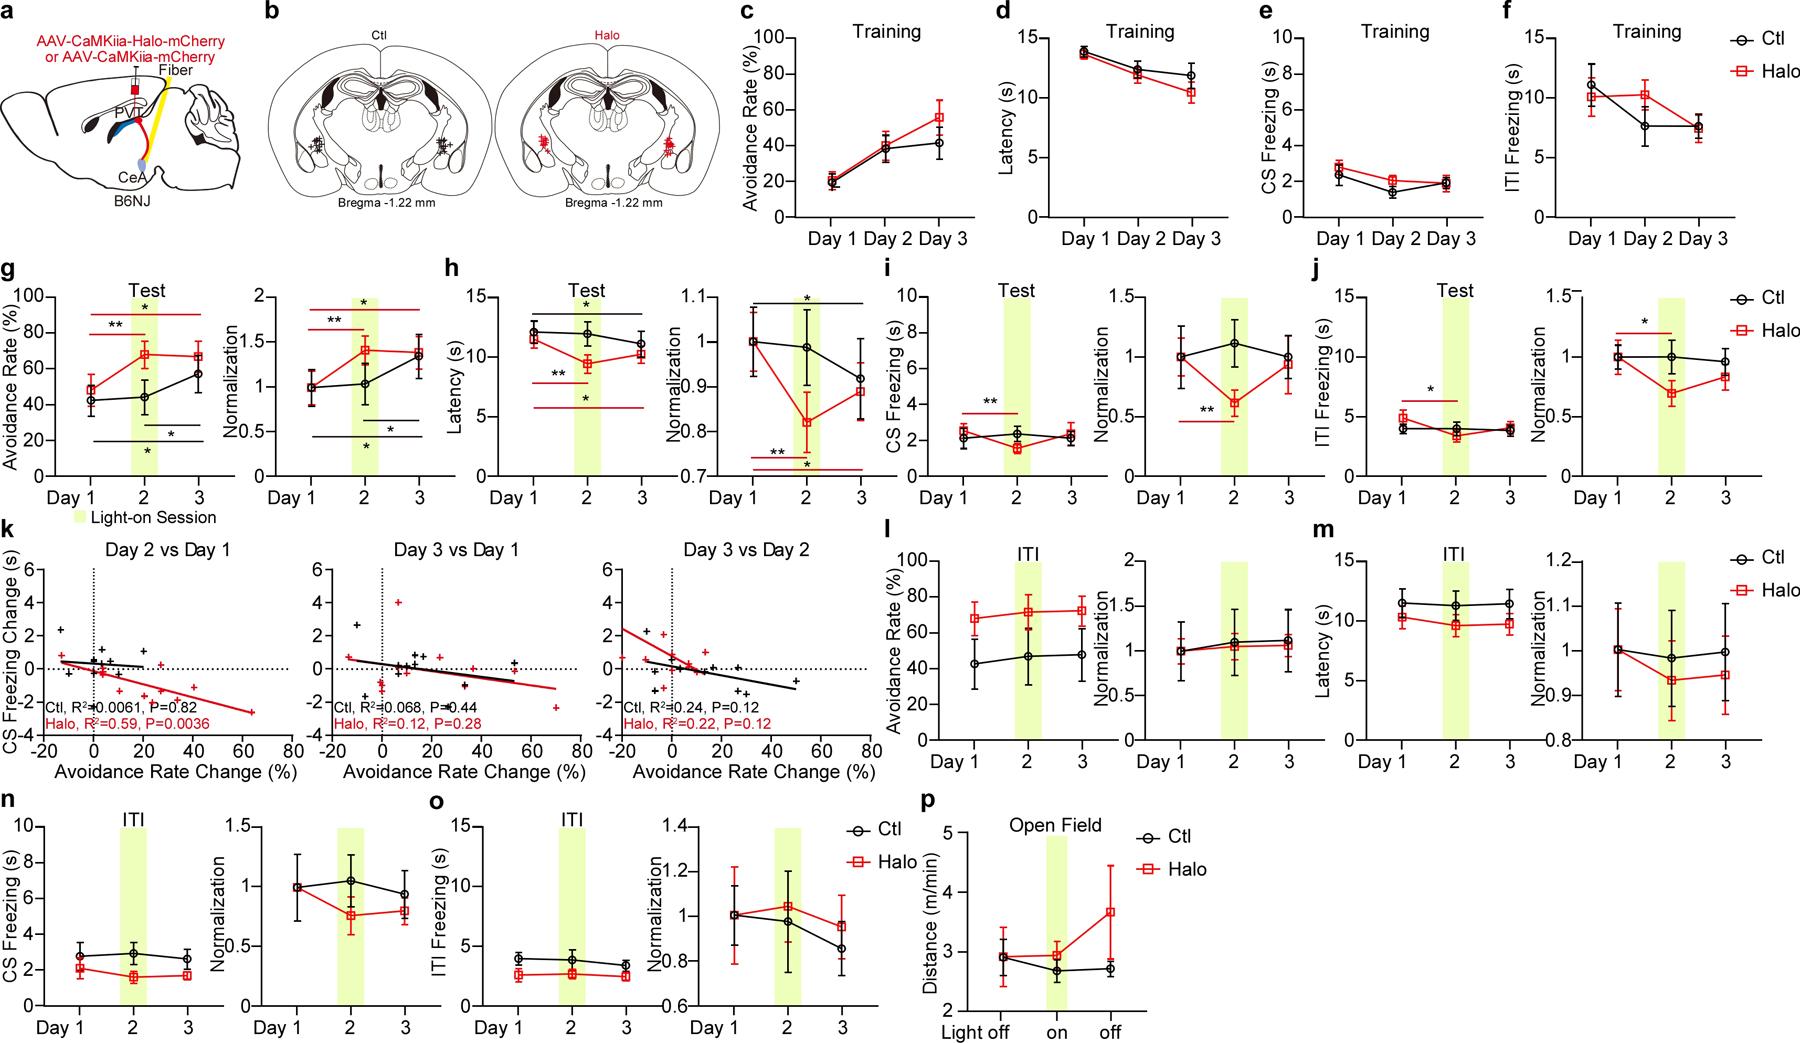
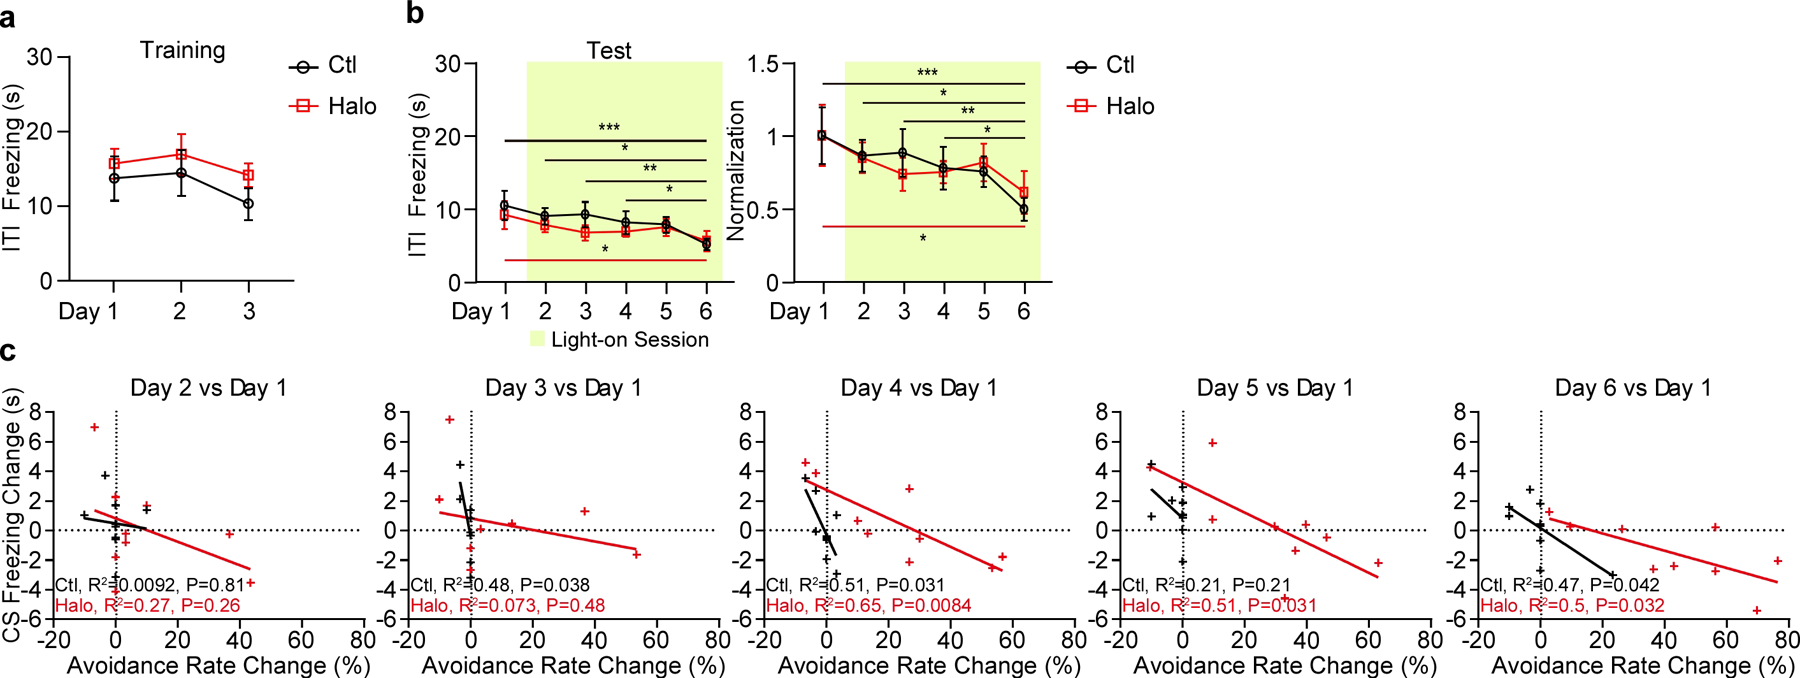
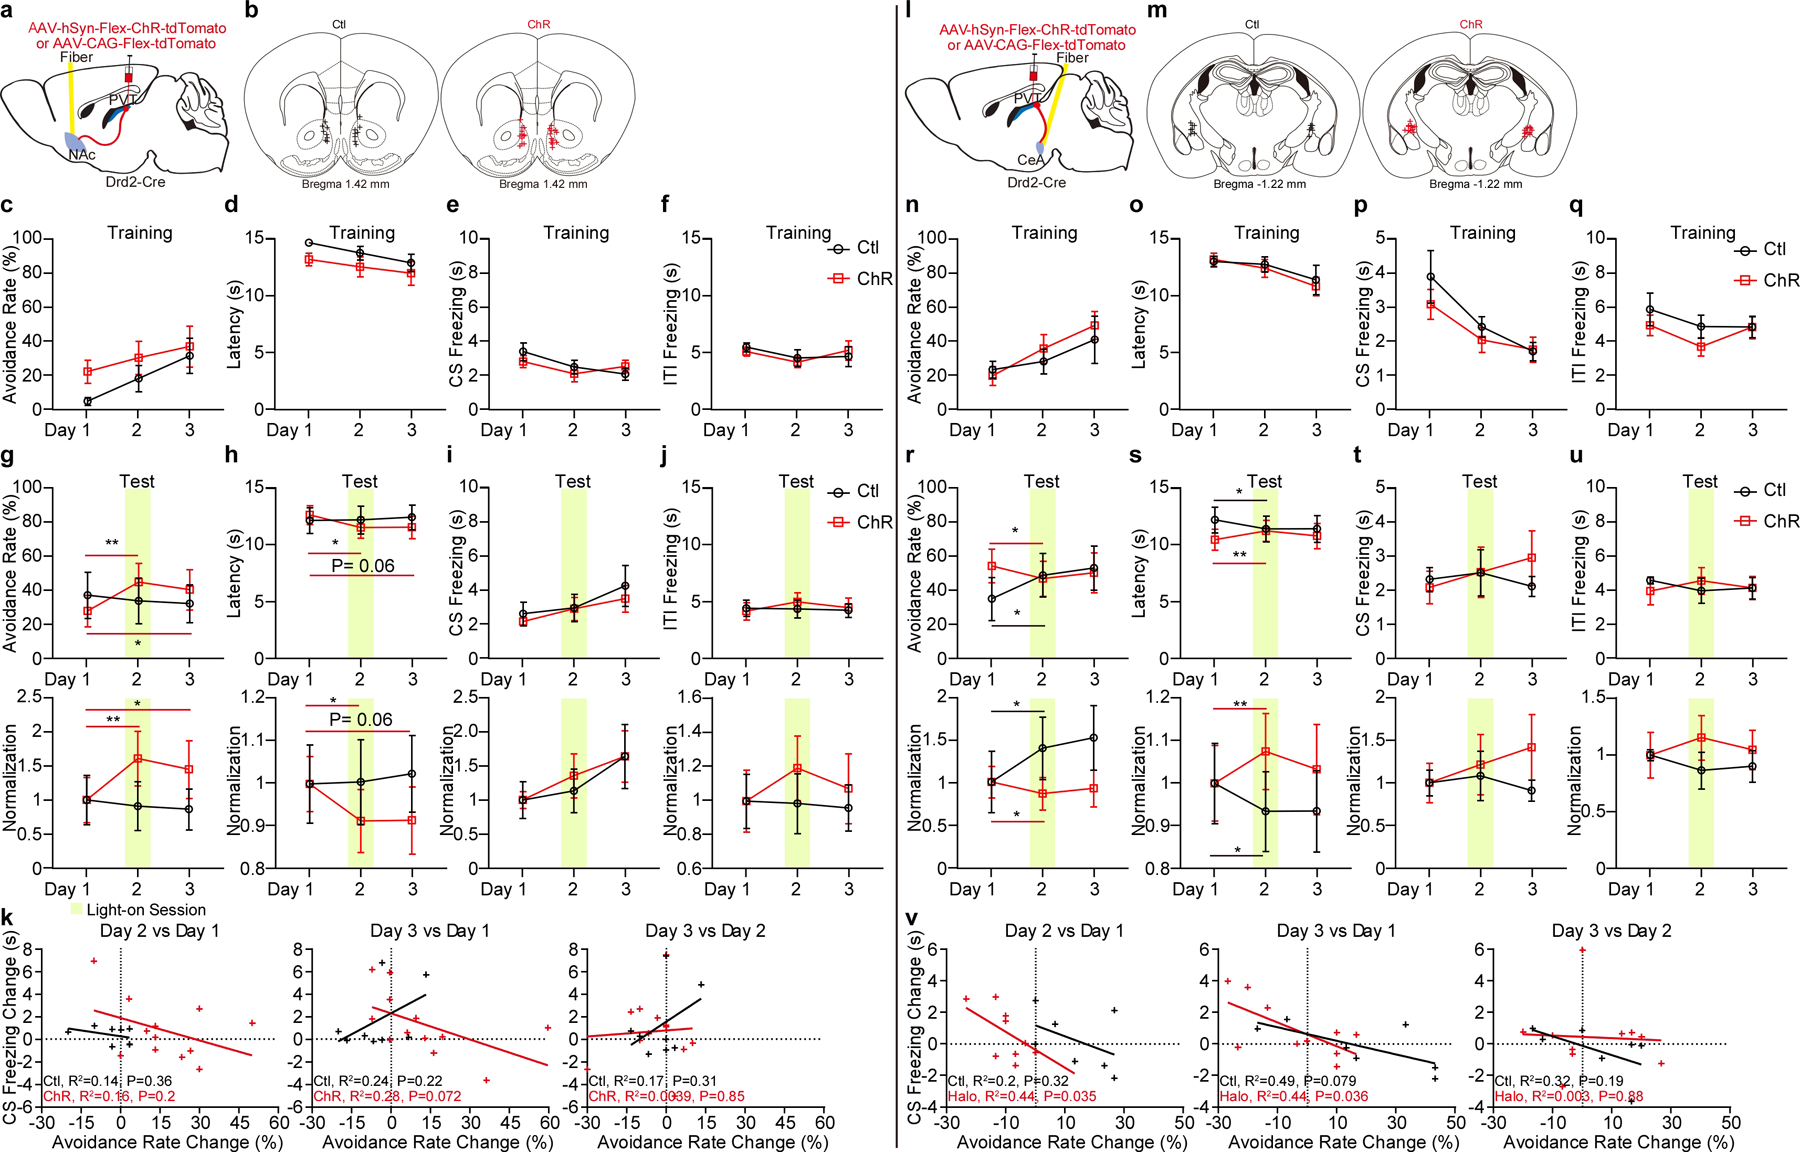
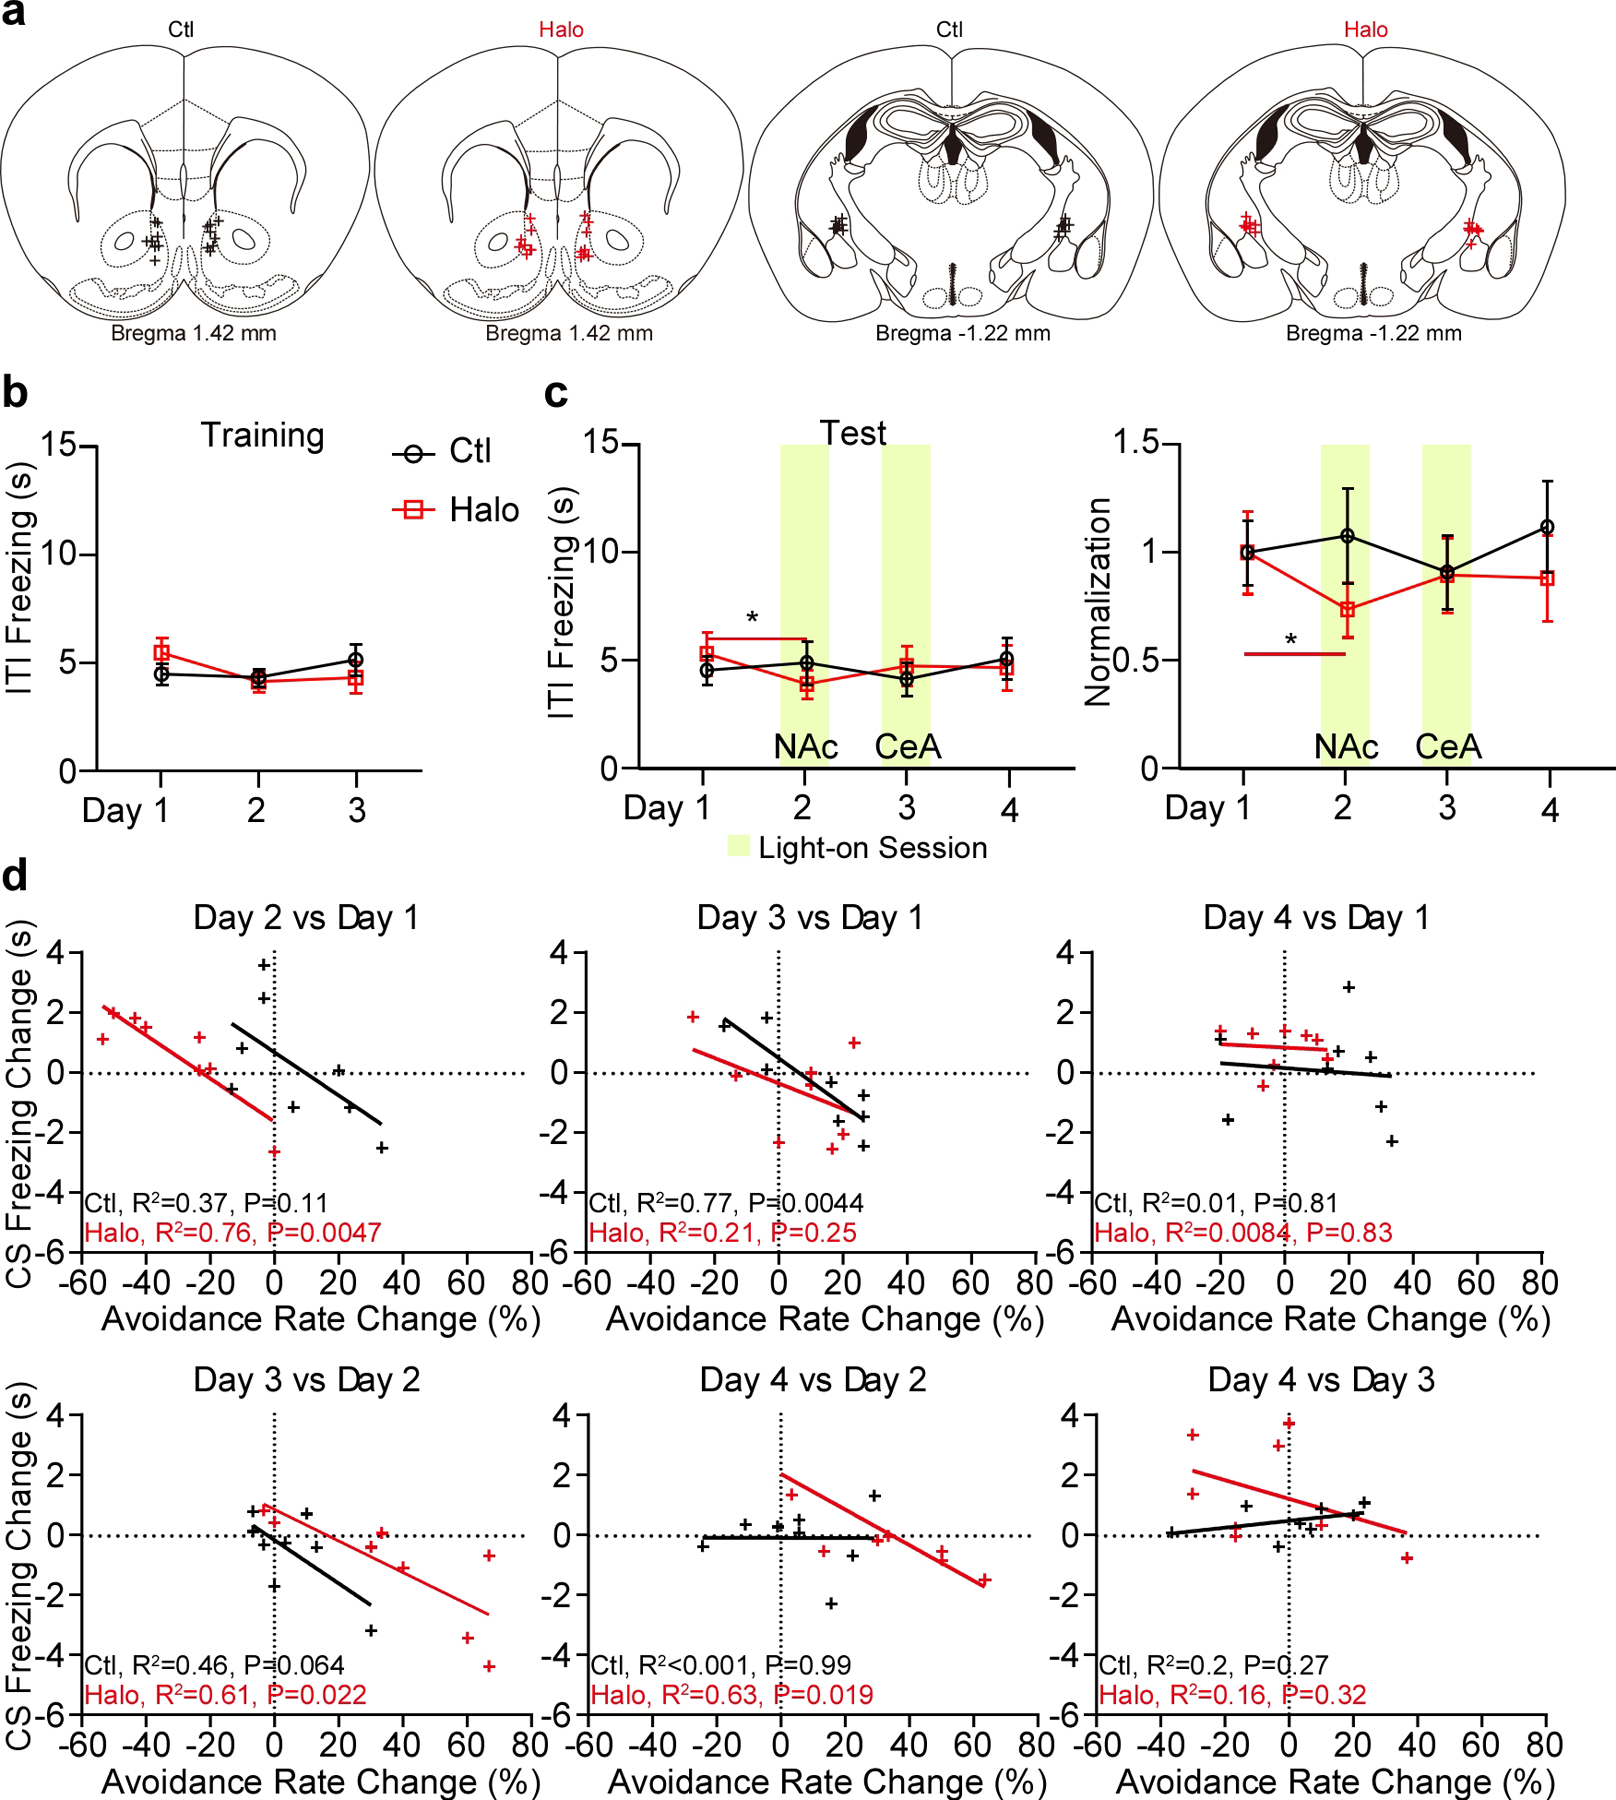
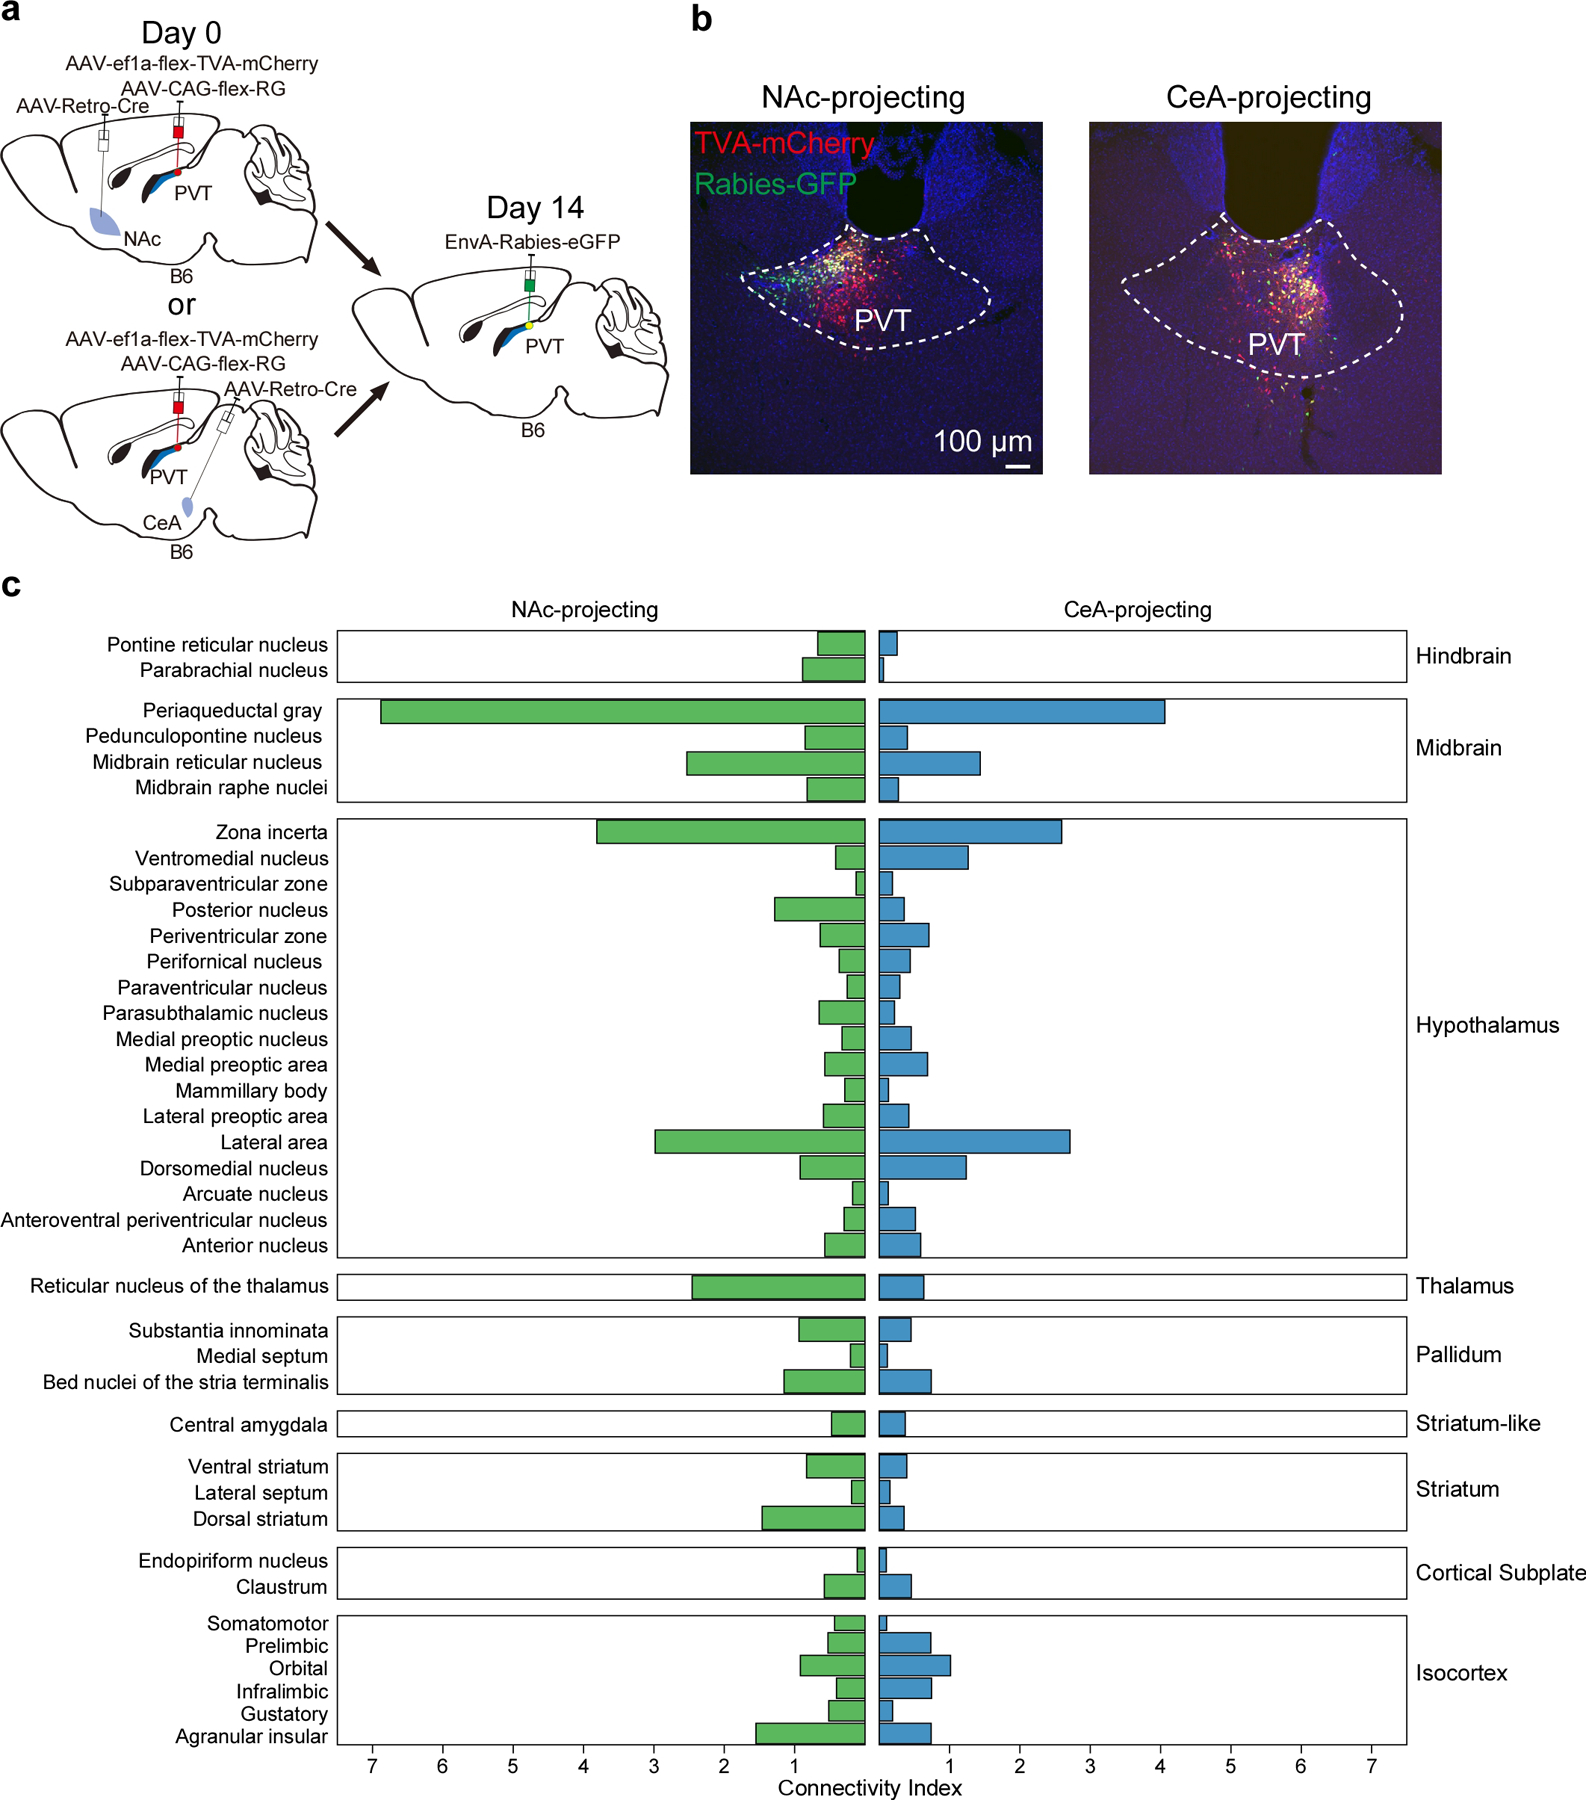
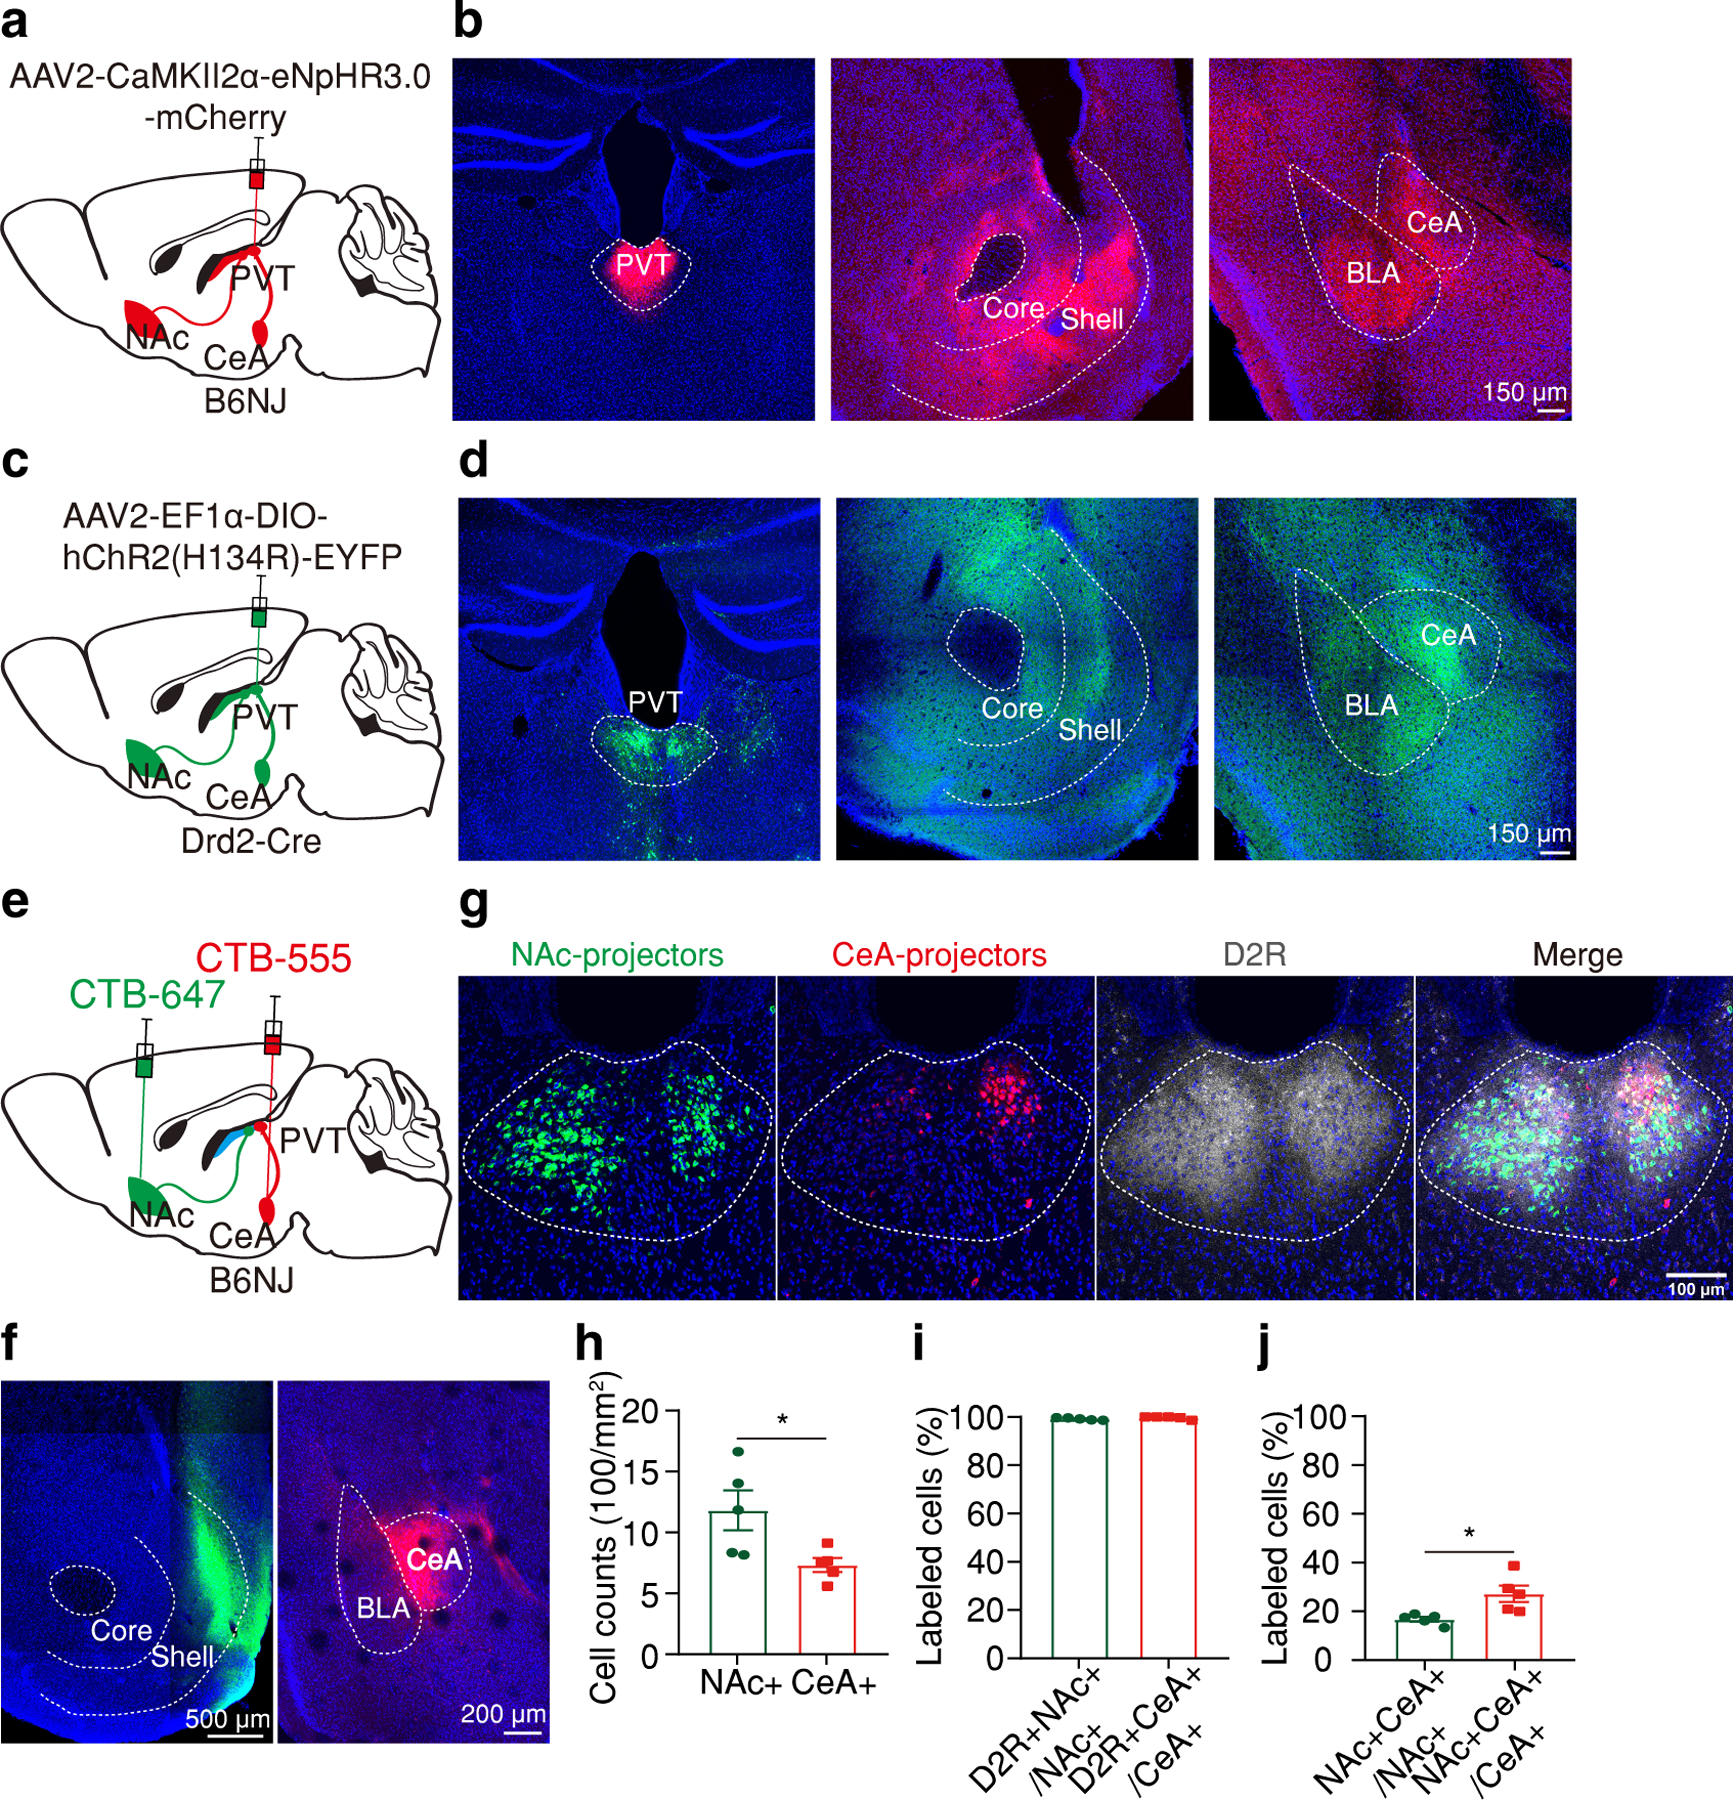
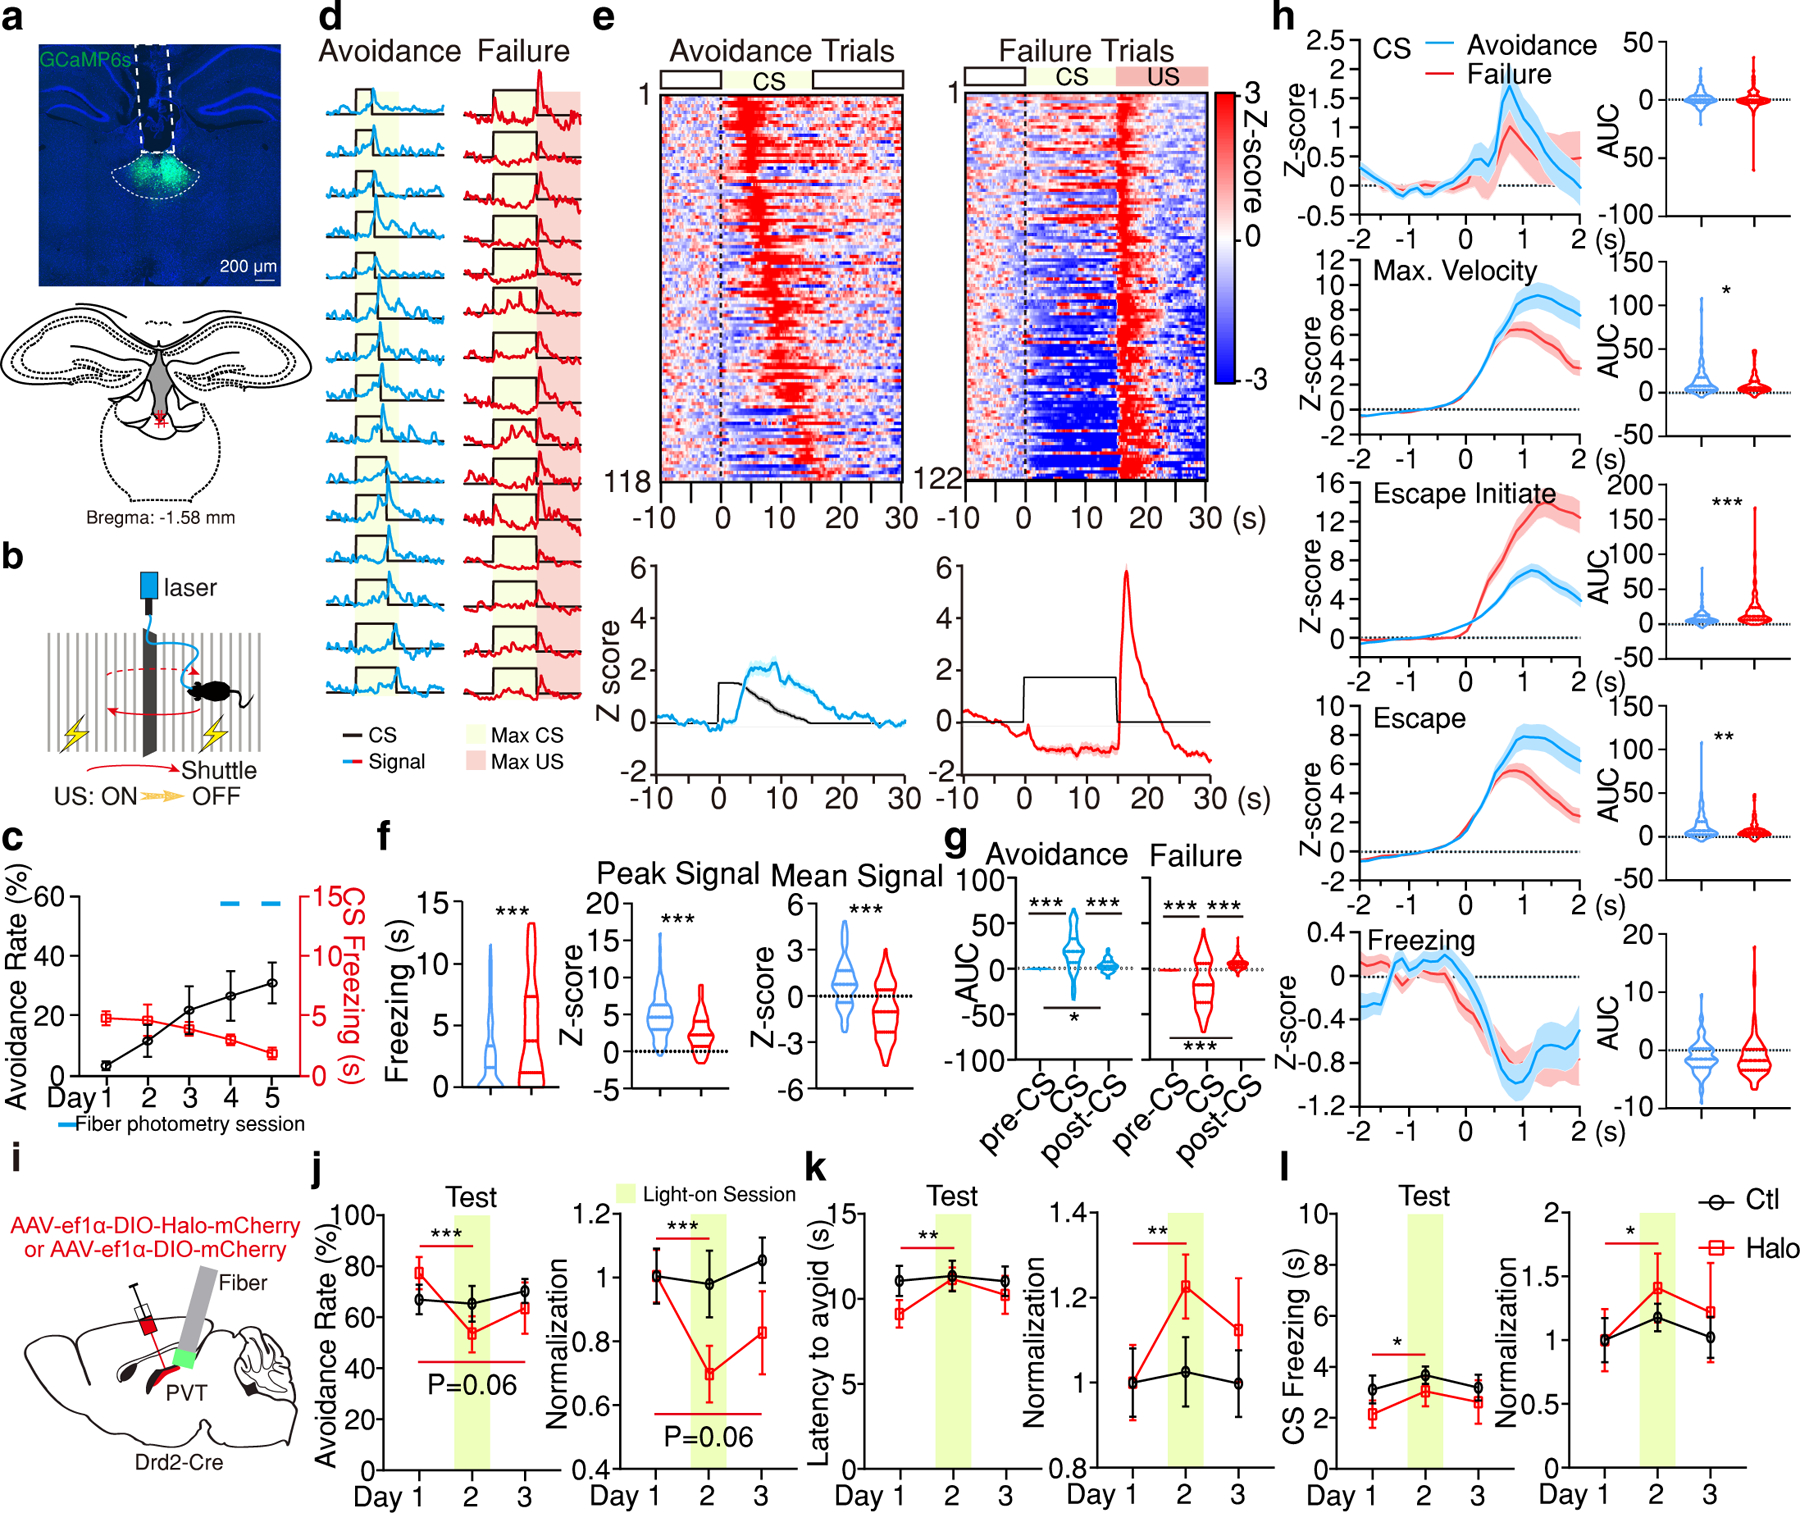
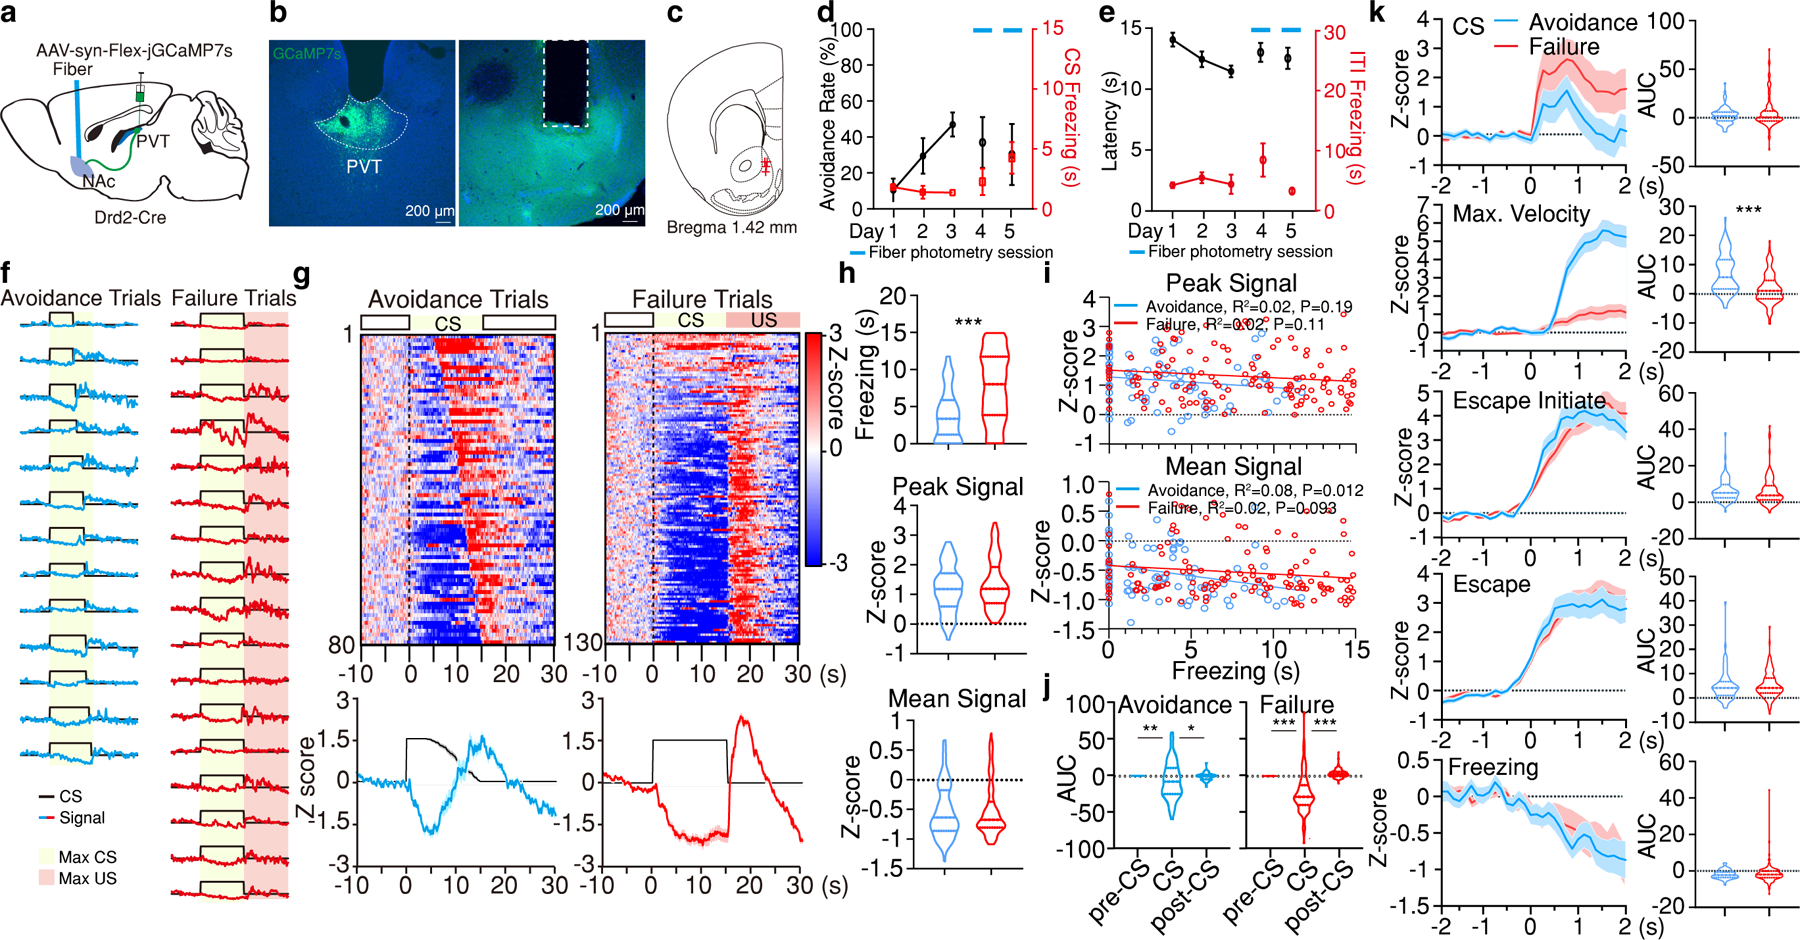
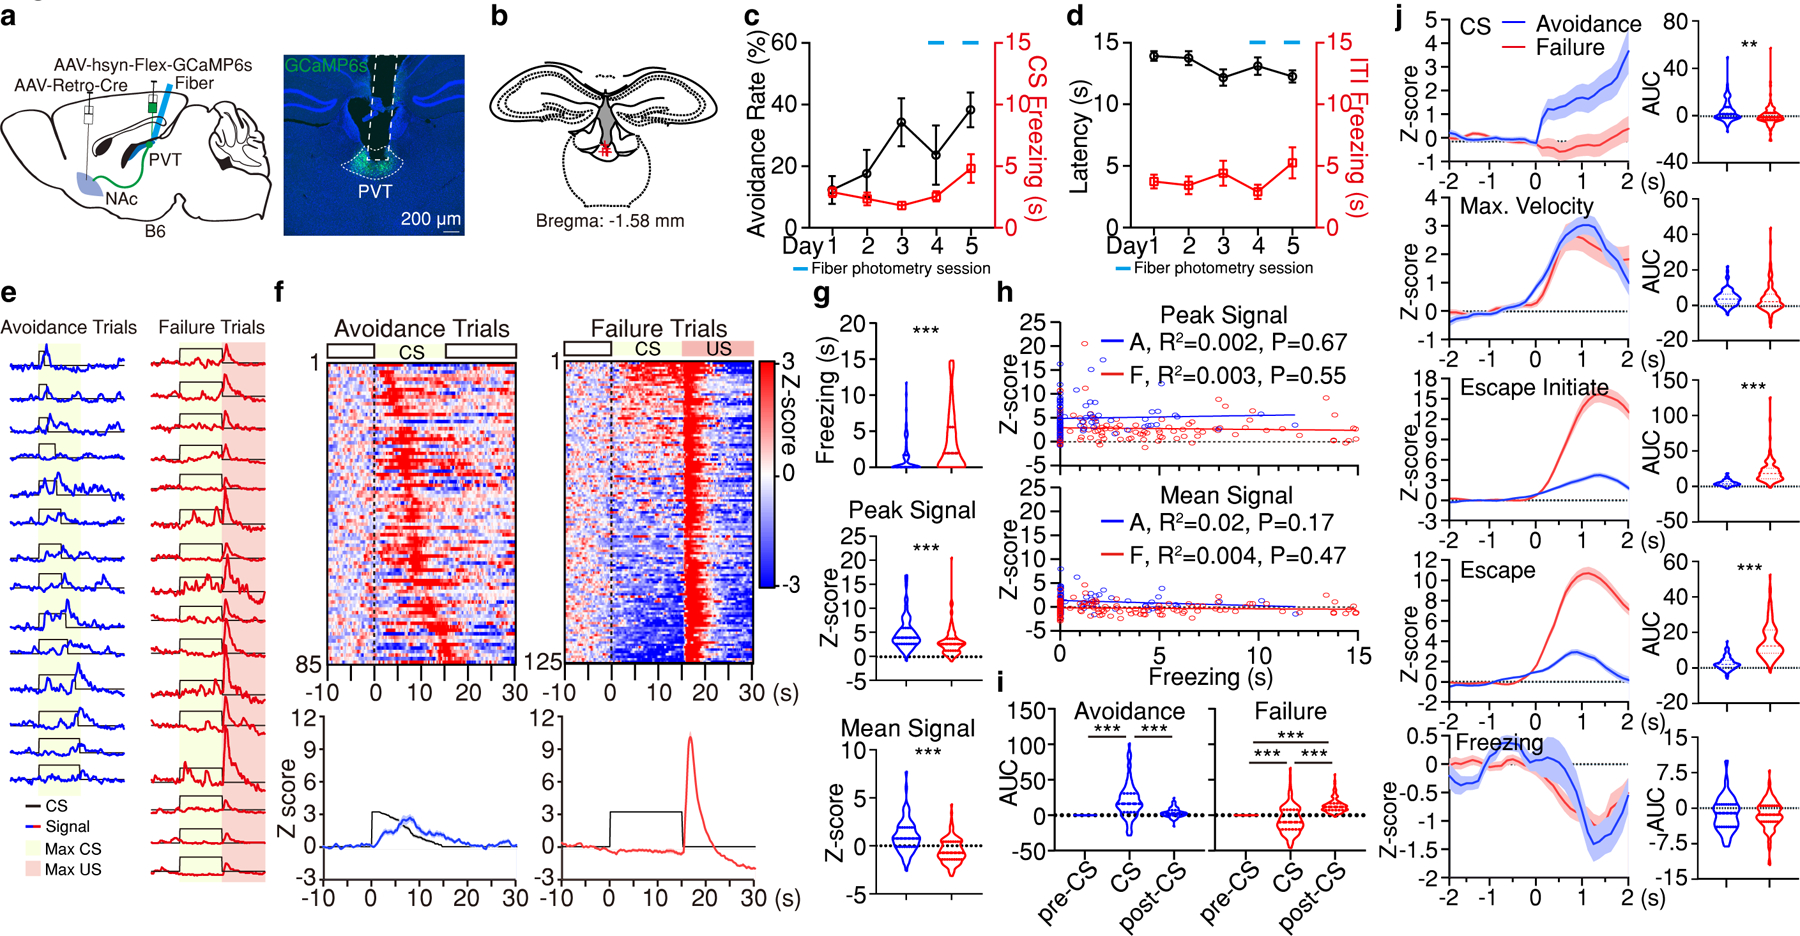
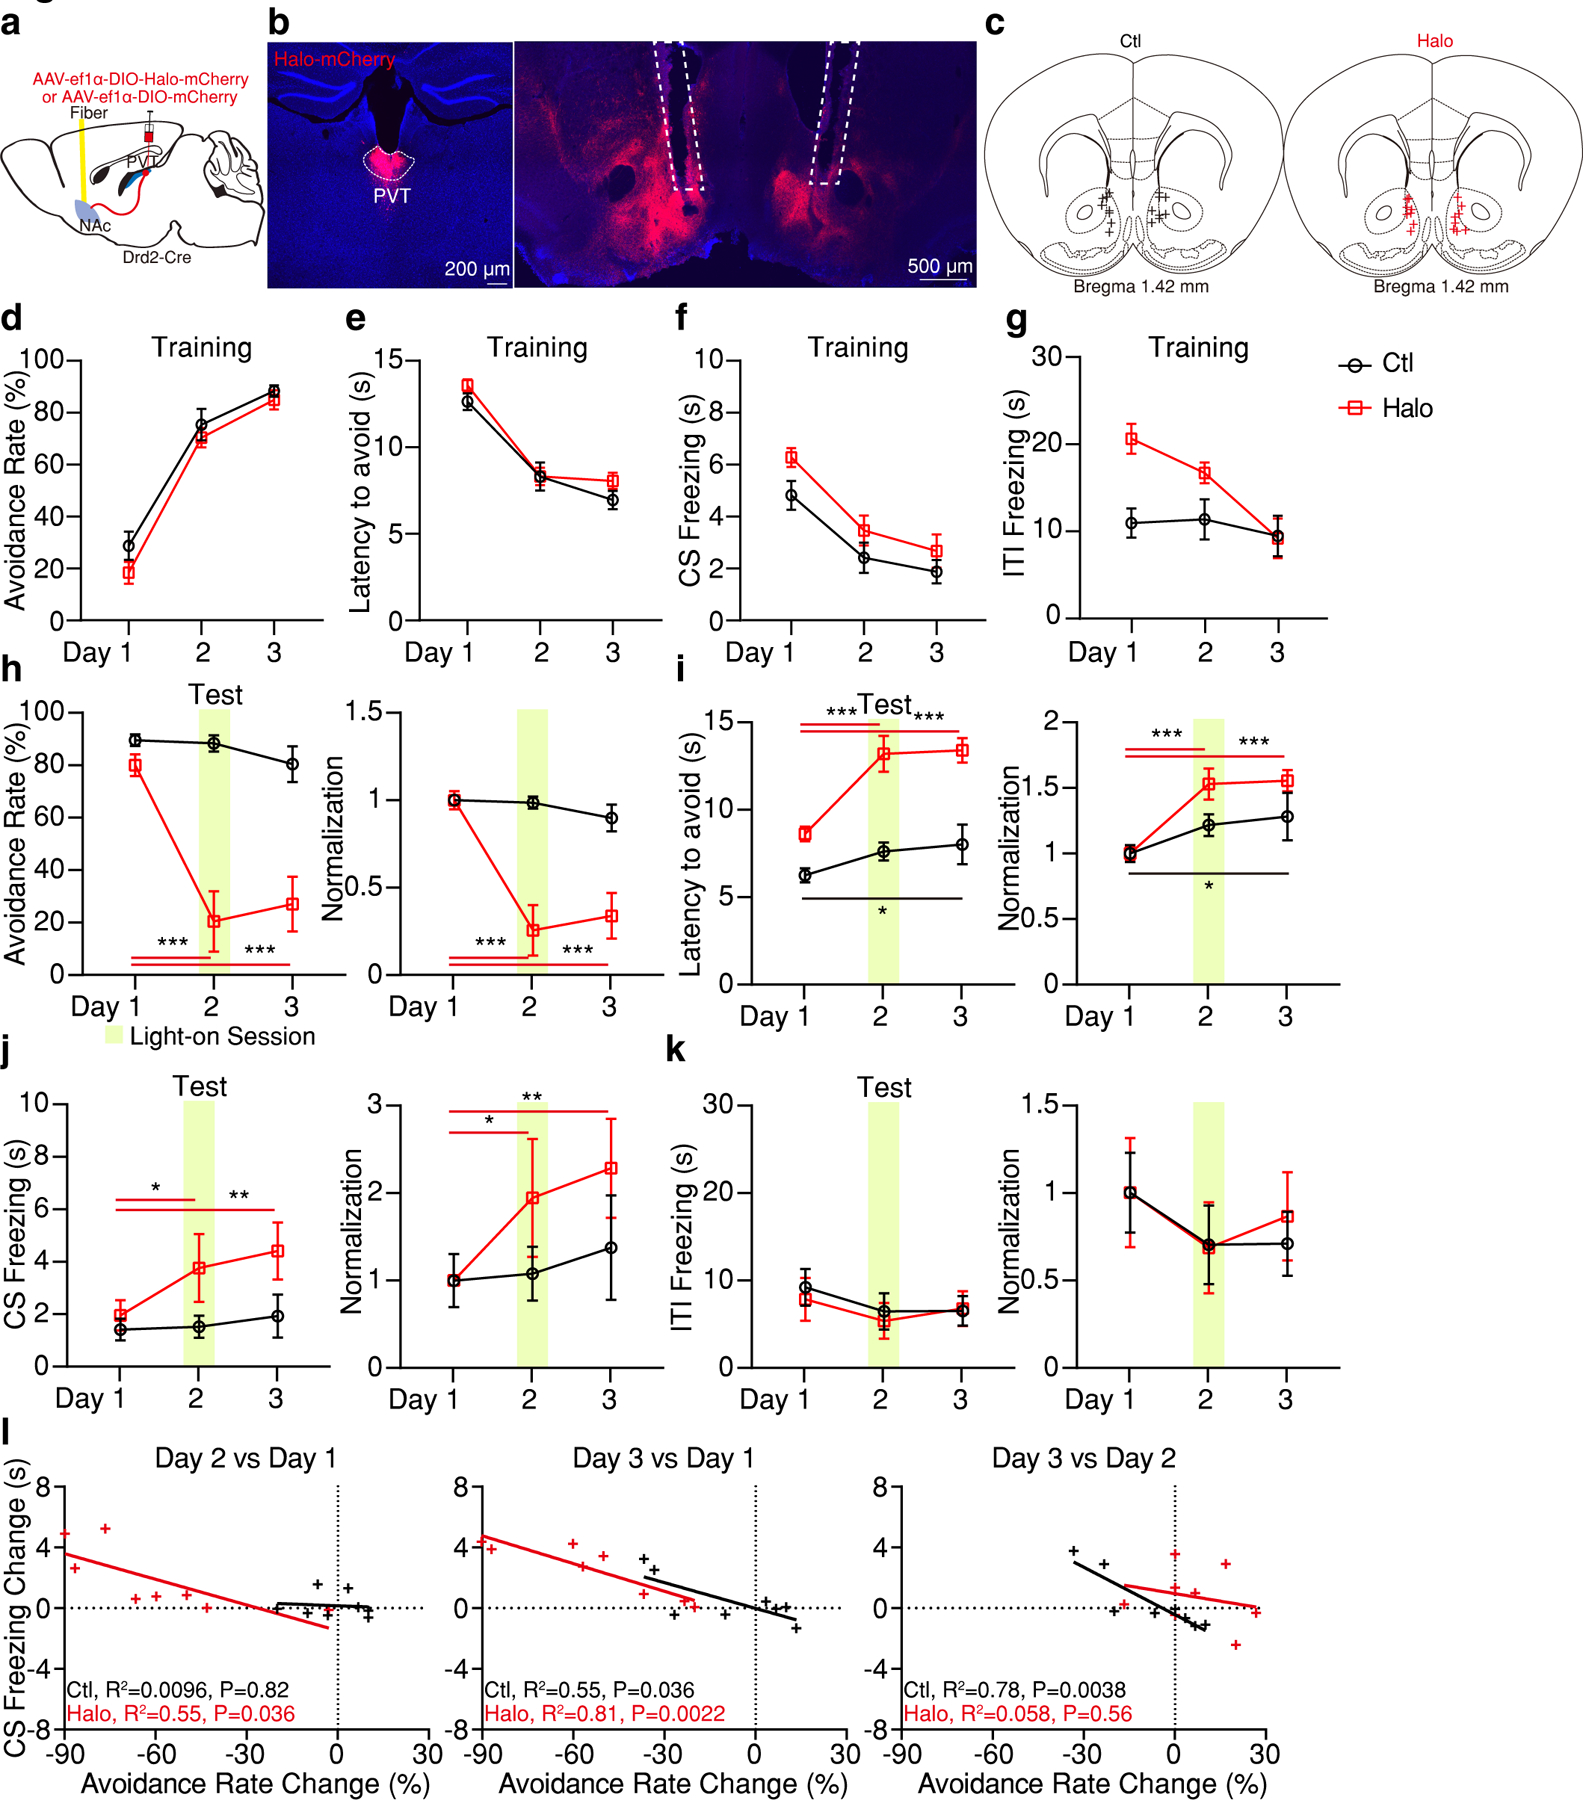
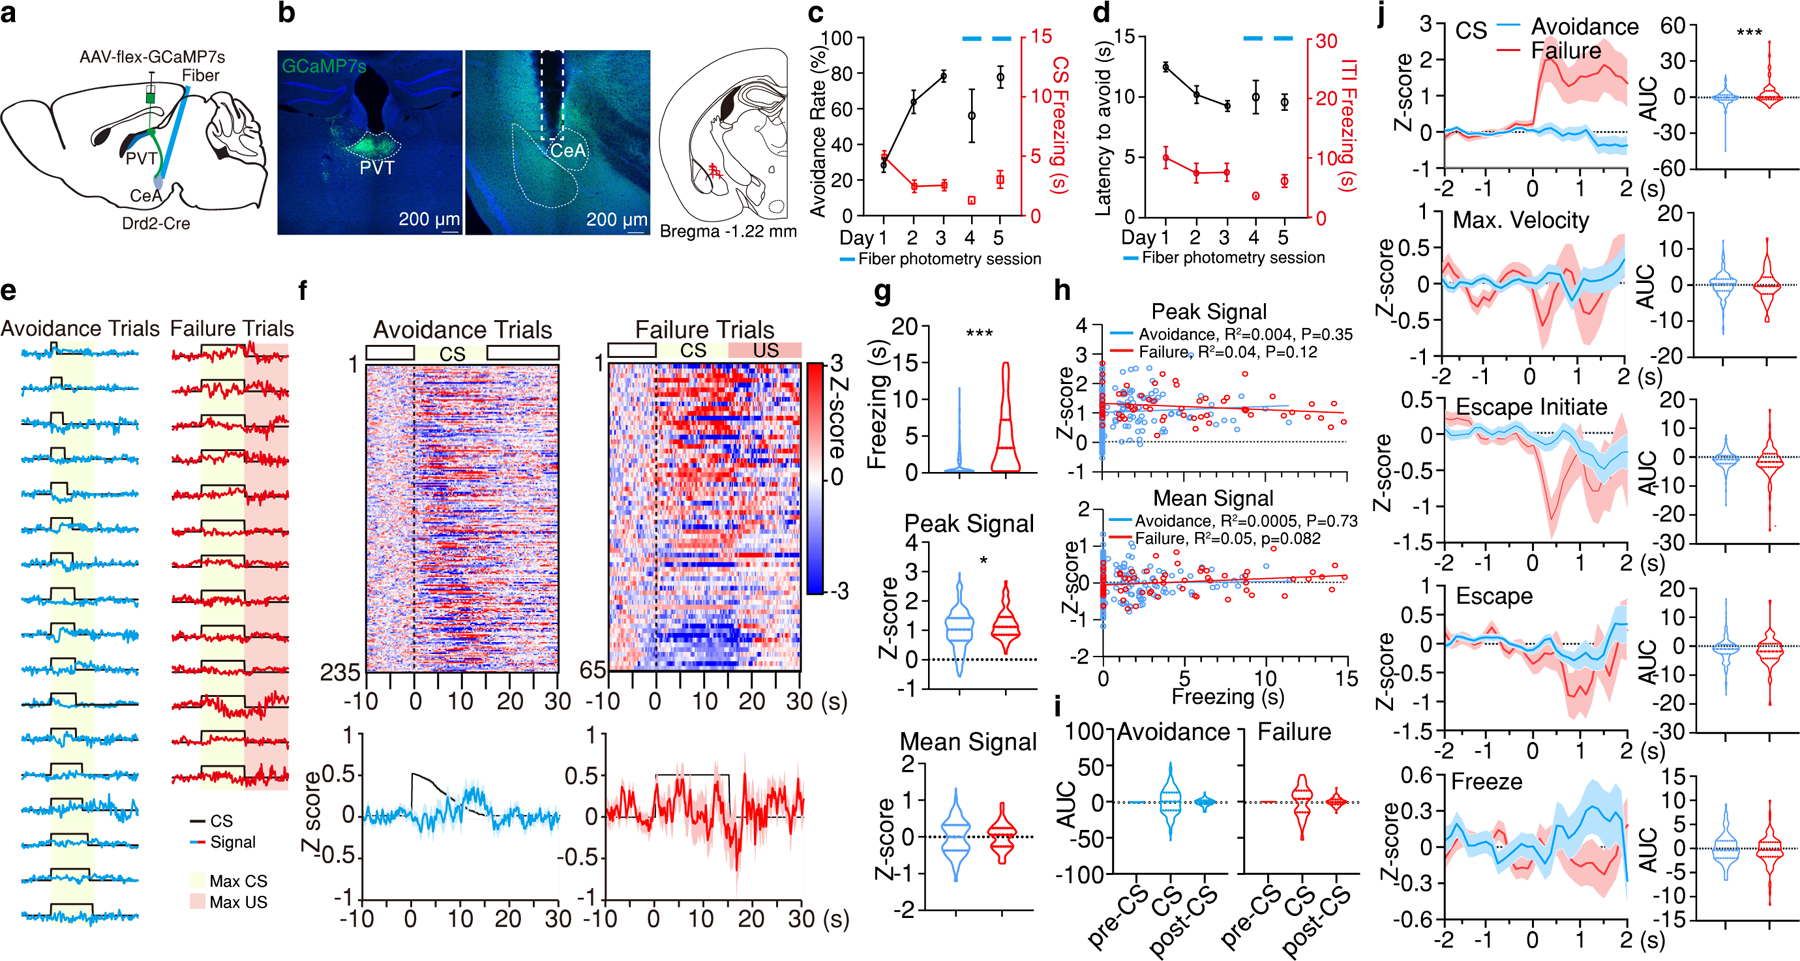
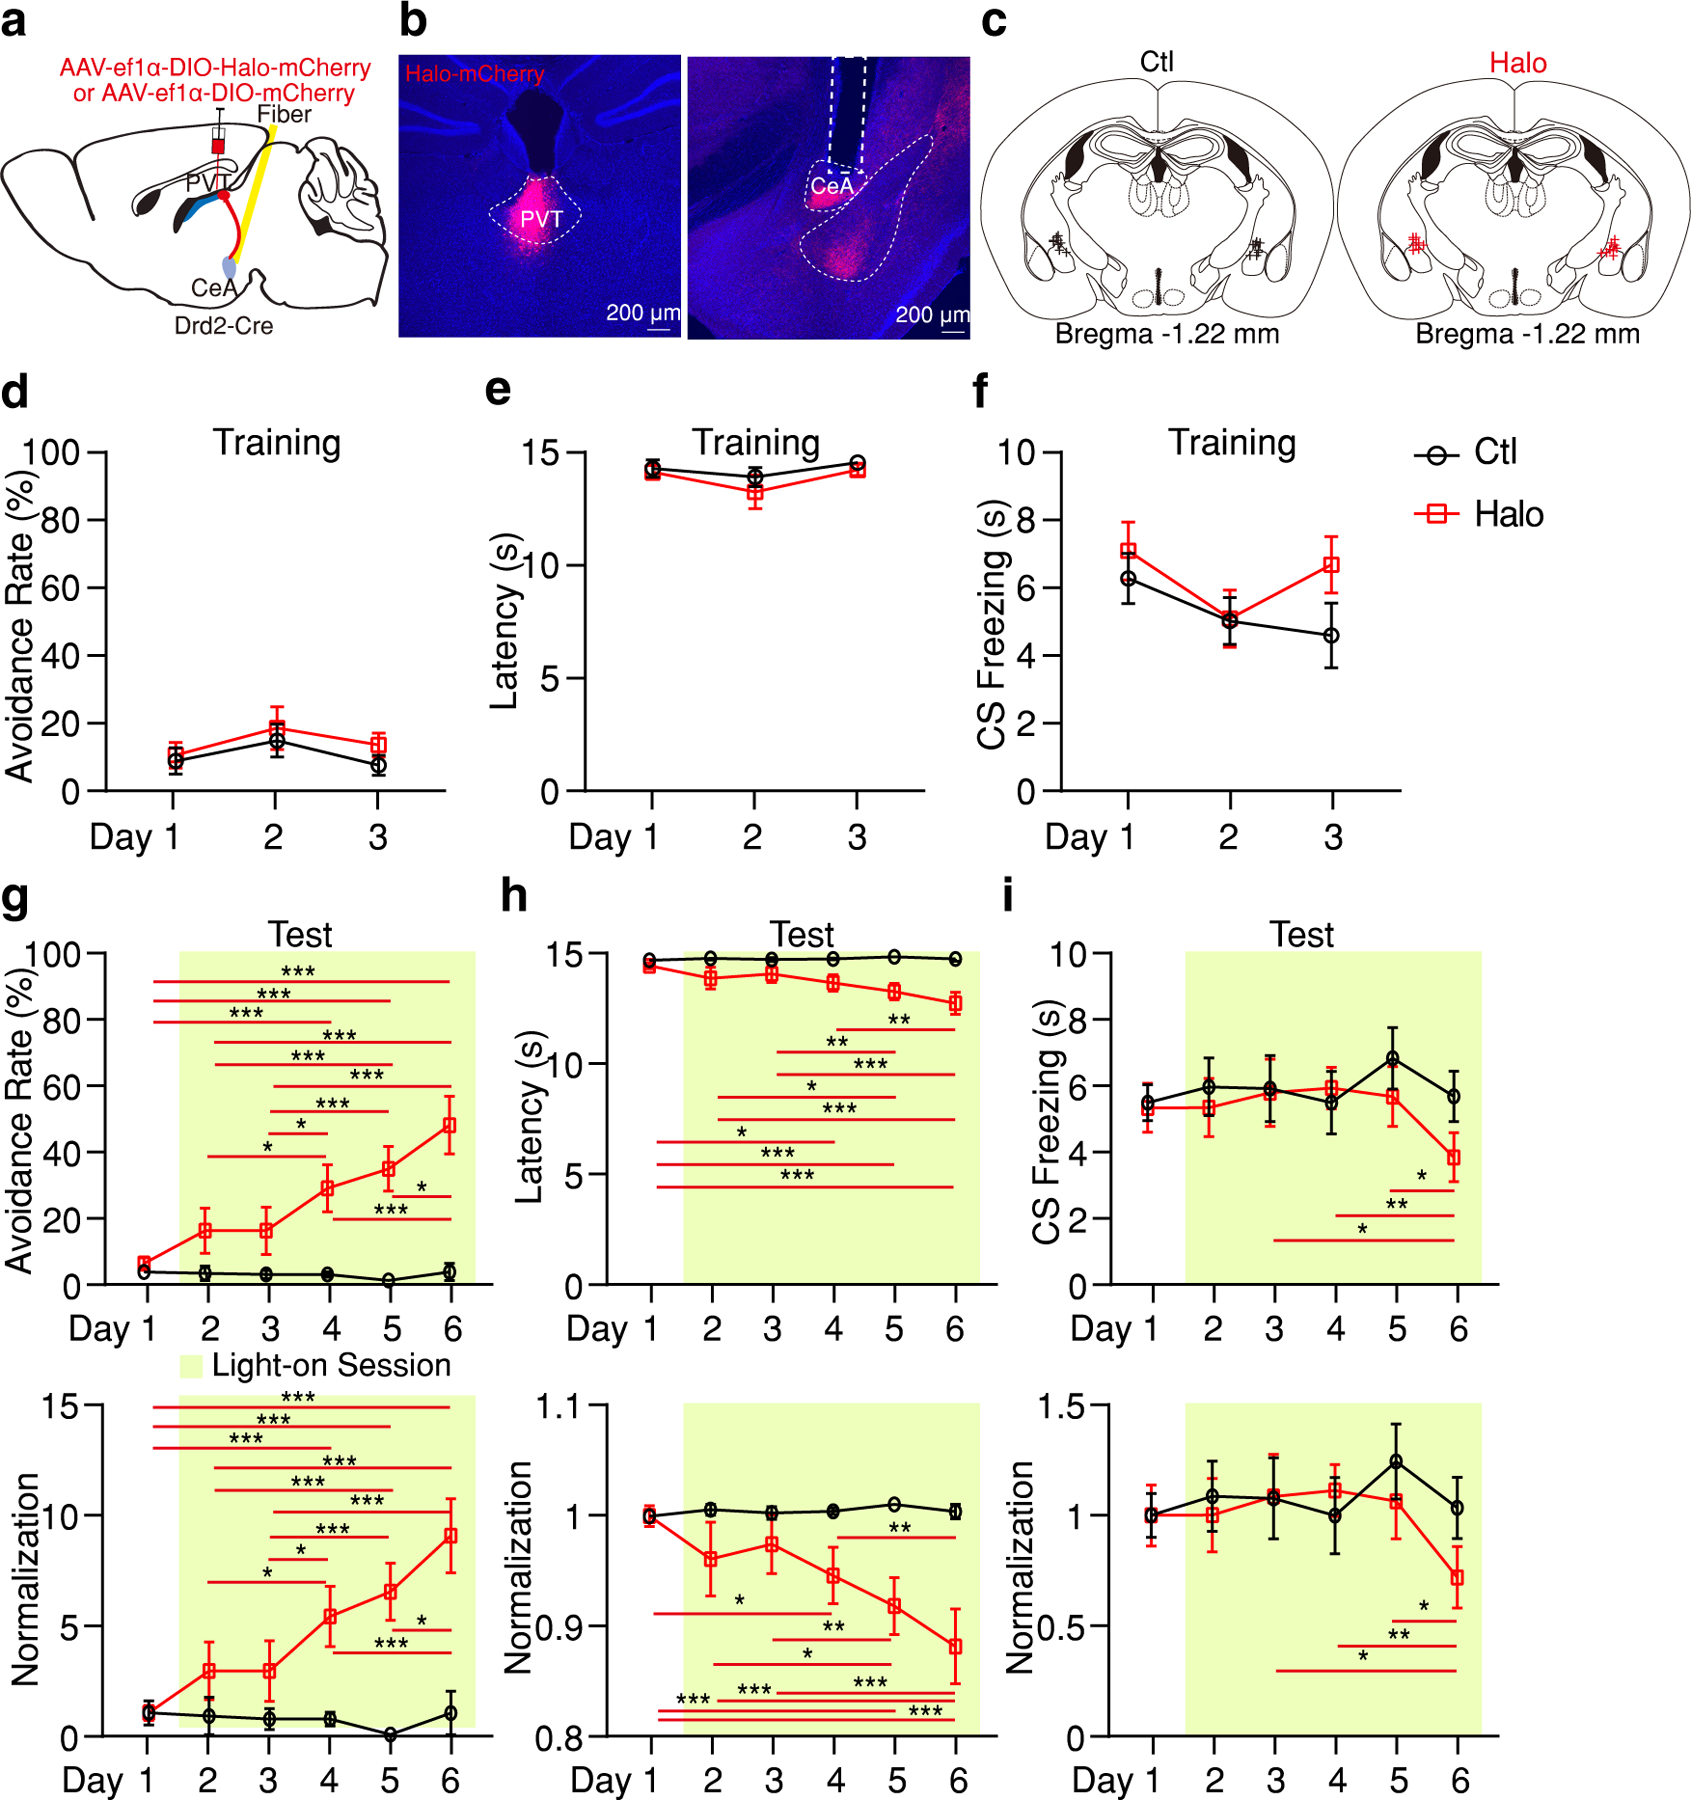
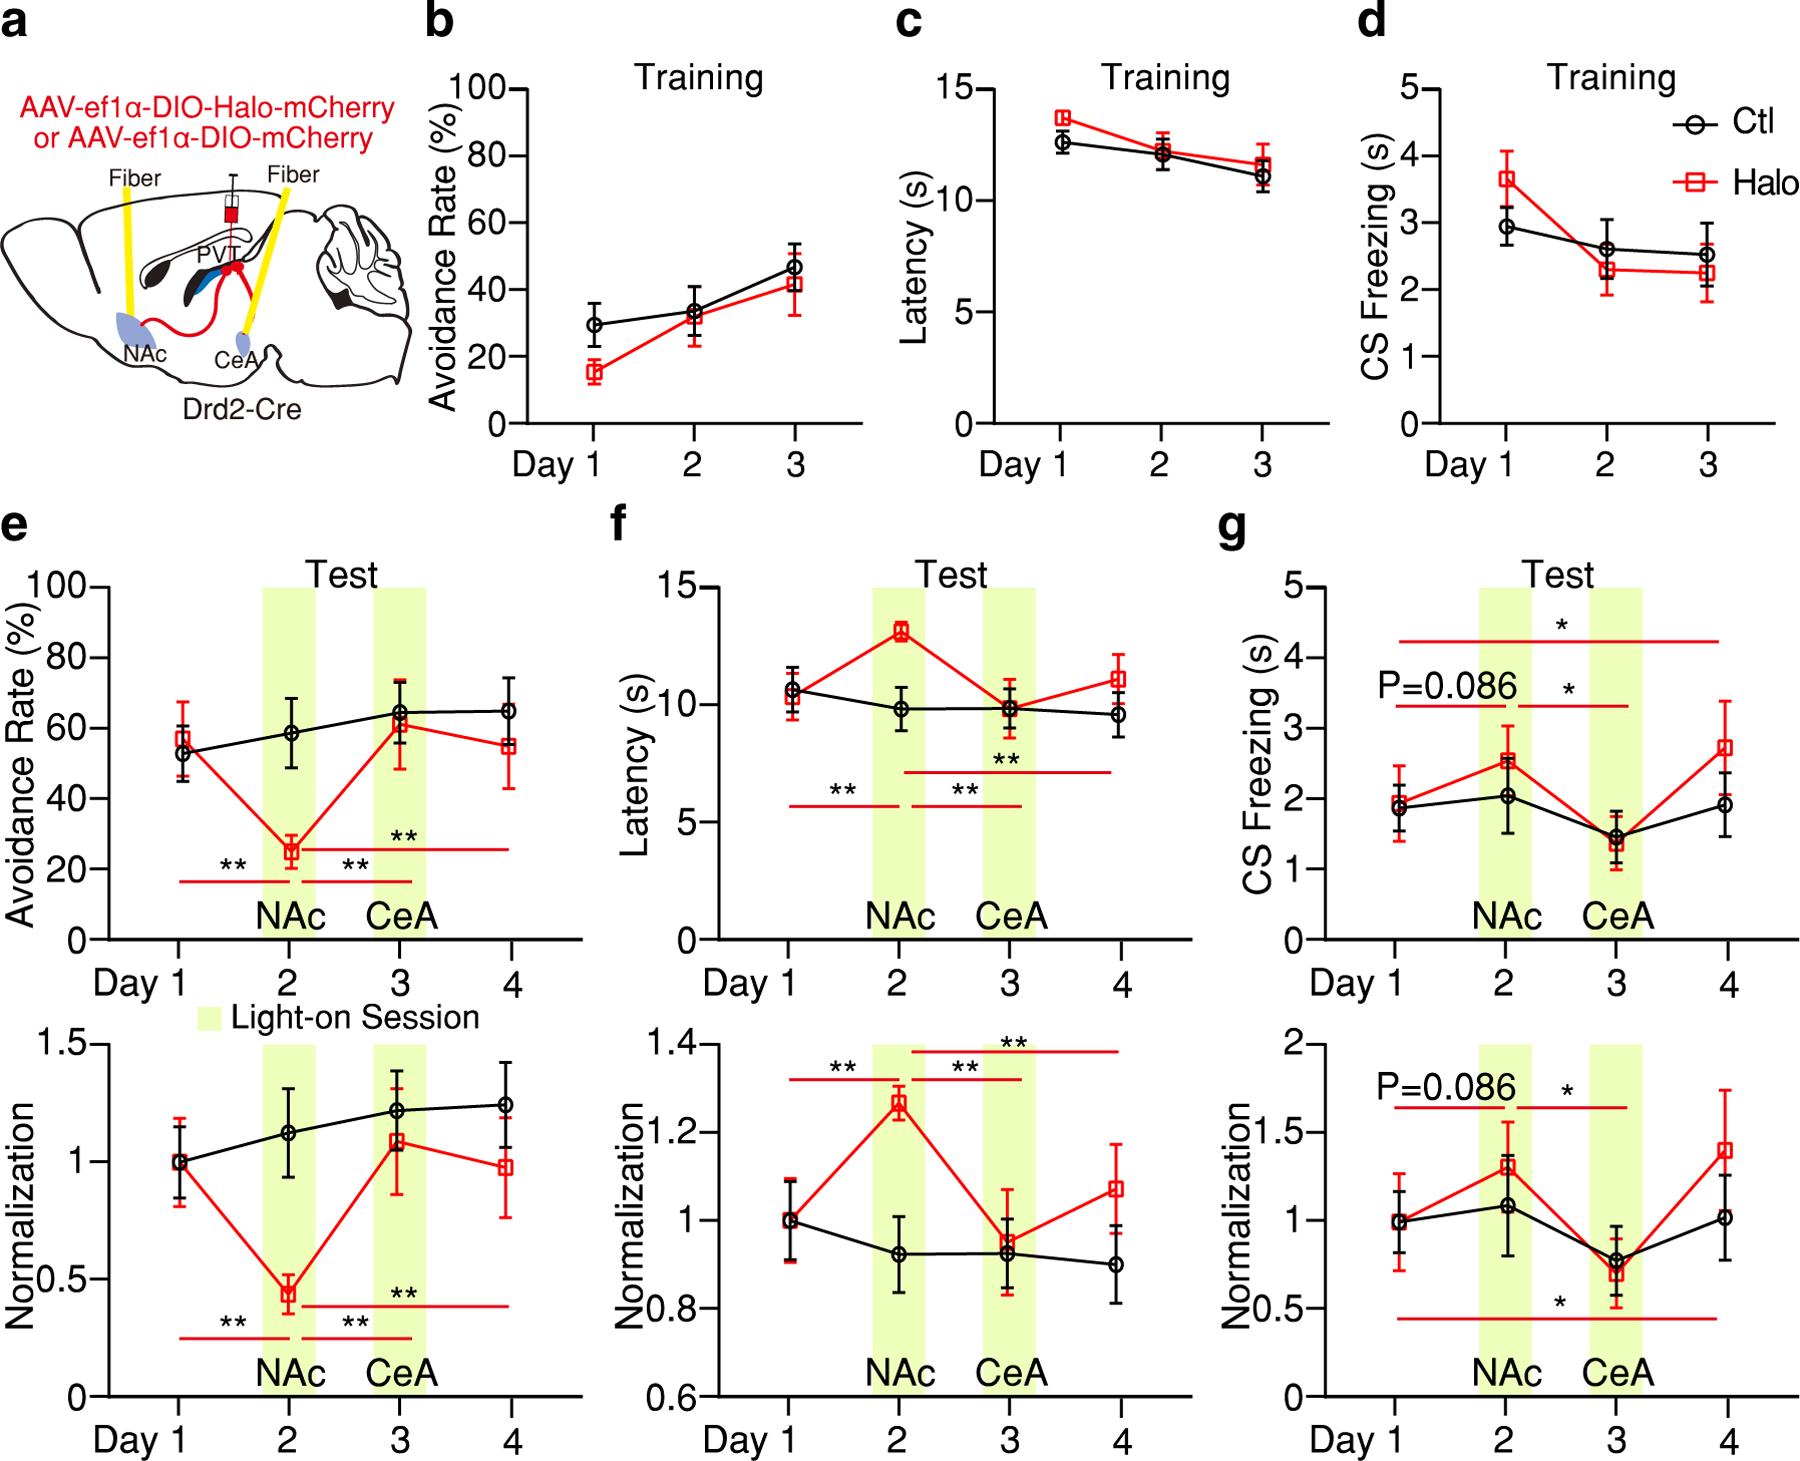
The appropriate selection of passive and active defensive behaviors in threatening situations is essential for survival. Previous studies have shown that passive defensive responses depend on activity of the central nucleus of the amygdala (CeA), whereas active ones primarily rely on the nucleus accumbens (NAc). However, the mechanisms underlying flexible switching between these two types of responses remain unknown. Here we show in mice that the paraventricular thalamus (PVT) mediates the selection of defensive behaviors through its interaction with the CeA and the NAc. We show that the PVT-CeA pathway drives conditioned freezing responses, whereas the PVT-NAc pathway is inhibited during freezing and, instead, signals active avoidance events. Optogenetic manipulations revealed that activity in the PVT-CeA or PVT-NAc pathway biases behavior toward the selection of passive or active defensive responses, respectively. These findings provide evidence that the PVT mediates flexible switching between opposing defensive behaviors.


Conflict of interest statement

COMPETING INTERESTS

The authors declare no competing interests.

Figures

Extended Data Figure 1.
Extended Data Figure 1.. pPVTD2R neuron activity during fear conditioning and retrieval.
a, Representative image of GCaMP6s expression in pPVTD2R neurons and optical fiber placements (n = 6 mice). b, Experimental paradigm. c-e, Freezing behavior during the habituation (c), conditioning (d) and retrieval (e) sessions. f-h, Average calcium responses during the habituation (f), conditioning (g) and retrieval (h) sessions. i-k, Quantification of calcium signal during habituation (i), conditioning (j) and retrieval (k) sessions. AUC, One-way ANOVA followed by two-stage linear step-up procedure of Benjamini, Krieger and Yekutieli. Habituation: n = 20 Trials; F(2, 57) = 0.1. Conditioning: n = 30 Trials; F(2, 87) = 2.17. Retrieval: n = 48 Trials; F(2, 141) = 7.7; group comparisons, pre-CS vs CS ***P = 0.0006, CS vs post-CS **P = 0.0012. l, Average calcium responses during early (Trials 1–3; left) and late (Trials 4–5; right) conditioning trials. m, Quantification of calcium signal during the first 5 s following the onset of CS during conditioning sessions. AUC, Two-way ANOVA followed by two-stage linear step-up procedure of Benjamini, Krieger and Yekutieli, n = 12 Trials; F(4, 112) = 1.49. Group comparisons: Early, 1 s vs 4 s P = 0.054, 1 s vs 5 s *P = 0.021; Late, 1 s vs 3 s **P = 0.0043, 1 s vs 4 s ***P = 0.0003, 1 s vs 5 s ***P < 0.001, 2 s vs 5 s **P = 0.0035, 3 s vs 5 s *P = 0.049. n, Calcium signal during US presentation in the late trials is higher than the early trials (n = 6 mice; two-tailed paired Student’s t-test, P = 0.054). o, Top: Heatmaps showing calcium responses of Conditioning Trials 1–5 from individual subjects, respectively. Bottom: Average calcium responses of the top panels. All data in figure shown as mean ± s.e.m.
Extended Data Figure 2.
Extended Data Figure 2.. The activity of pPVTD2R neurons is positively correlated with movement during the CS following fear memory retrieval.
a, Calcium responses of individual retrieval trials aligned by percentage CS freezing (See Methods) (right). n = 6 mice, 8 trials per mouse. b, Left: Linear regression of CS calcium signal and freezing percentage for each trial. Right: Average CS calcium signal for each group (L, n = 20 trials; M, n = 16 trials; H, n = 12 trials). AUC, F(2, 45)  = 3.3, one-way ANOVA followed by two-stage linear step-up procedure of Benjamini, Krieger and Yekutieli. Group comparisons, L vs H, *P = 0.013. c, Average calcium responses (top), average movement index (middle) and linear regression of average calcium signal and movement index during the CS (bottom) for each group. d, Comparison of calcium signal (left) and movement index (right) for each group (L, n = 20 trials; M, n = 16 trials; H, n = 12 trials). AUC, two-way ANOVA followed by two-stage linear step-up procedure of Benjamini, Krieger and Yekutieli. Calcium signal: F(4, 90) = 3.37; movement index: F(4, 90) = 3.6; for group comparisons ***P < 0.001, *P < 0.05. e-f, Average movement index (e) and linear regression of average calcium signal and movement index during the CS (f) for the habituation session. g, Individual subjects contributing to each group. h, Calcium responses of Trials 1–8 and average in bottom panels. i, Quantification of calcium signal during the Trials 1–8. AUC, One-way ANOVA followed by two-stage linear step-up procedure of Benjamini, Krieger and Yekutieli. n = 6; Trial 1, F(2, 10) = 1.36; Trial 2, F(2, 10) = 4.55; Trial 3, F(2, 10) = 0.092; Trial 4, F(2, 10) = 1.55; Trial 5, F(2, 10) = 0.74; Trial 6, F(2, 10) = 2.83; Trial 7, F(2, 10) = 4.94; Trial 8, F(2, 10) = 2.71; for group comparisons *P < 0.05. j, Linear regression of average calcium signal and movement index from Trials 1–8. All data in figure shown as mean ± s.e.m.
Extended Data Figure 3.
Extended Data Figure 3.. The activity of pPVTD2R neurons in the 2AA task, related to Figure 2.
a, Latency to avoid and freezing time during the ITI across days (n = 5 mice). b, Left: Linear regression of peak calcium signal and freezing time during the CS for avoidance (blue; A; R2 = 0.069, P = 0.0043) and failure trials (red; F; R2 = 0.15, P < 0.001). Right: Linear regression of average calcium signal and freezing time during the CS for avoidance (blue; A; R2 = 0.17, P < 0.001) and failure trials (red; F; R2 = 0.24, P < 0.001). c, Quantification of the latency to freezing after CS onset for avoidance and failure trials. Left: Counts of the freezing latency. Right: cumulative probability plots for the Left panel. Avoidance, n = 56 Events; Failure, n = 109 Events. d, Quantification of the latency to escape after CS onset for avoidance and failure trials. Left: Counts of the escape latency. Right: cumulative probability plots for the Left panel. Avoidance, n = 118; Failure, n= 122 Trials. All data in figure shown as mean ± s.e.m.
Extended Data Figure 4.
Extended Data Figure 4.. Optogenetic inhibition of pPVTD2R neurons in the 2AA task.
a, Representative image from a mouse expressing Halo-mCherry in pPVTD2R neurons and implanted with an optical fiber. b, Fiber placements (Ctl, n = 8 mice; Halo, n = 9 mice). c, Schematic of the 2AA task. d-g, Avoidance rate (d), latency to avoid (e) and freezing time during the CS (f) and the ITI (g) across training days for each group. h, Left: Freezing time during the ITI. Right: Normalization to Day 1 for each group. ITI freezing in s, two-way ANOVA followed by two-stage linear step-up procedure of Benjamini, Krieger and Yekutieli. F(2, 30) = 0.36, Non-significant. i, Linear regression of the changes in freezing behavior across test sessions as a function of changes in avoidance behavior. j. Moving distance in the open field. Ctl, n = 8 mice; Halo, n = 5 mice. k, Schematic of the viral vector strategy and optical fiber placement used for optogenetic silencing of pPVTD2R neurons in the 2AA task. l, Fiber placements (Ctl, n = 6 mice; Halo, n = 7). m-p, Avoidance rate (m), latency to avoid (n) and freezing time during the CS (o) and the ITI (p) across training days in both Ctl and Halo groups. q-t, Left: Effect of optogenetic inhibition of pPVTD2Rneurons during the ITI on avoidance rate (q), the latency to avoid (r) and freezing time during the CS (s) and the ITI (t). Right: Normalization to Day 1 for each group. Two-way ANOVA followed by two-stage linear step-up procedure of Benjamini, Krieger and Yekutieli. Avoidance rate, F(5, 80) = 9.05; latency to avoid, F(5, 80) = 4.52; CS freezing, F(5, 80) = 1.17; ITI freezing, F(5, 80) = 0.44; non-significant change among each group comparison. All data in figure shown as mean ± s.e.m.
Extended Data Figure 5.
Extended Data Figure 5.. Optogenetic inhibition of pPVT–NAc axon terminals in the 2AA task.
a, Schematic of the viral vector strategy and optical fiber placement for optogenetic silencing of pPVT–NAc axon terminals in the 2AA task. b, Fiber placements (Ctl, n = 13 mice; Halo, n = 11 mice). c-f, Avoidance rate (c), latency to avoid (d) and freezing time during the CS (e) and ITI (f) across training sessions for each group. g-j, Left: Avoidance rate (g), latency to avoid (h), freezing time during the CS (i) and the ITI (j) during optogenetic inhibition of pPVT–NAc axon terminals. Right: Normalization to Day 1 for each group. Two-way ANOVA followed by two-stage linear step-up procedure of Benjamini, Krieger and Yekutieli. Avoidance rate: F(2, 44) = 4.89; group comparisons, Halo, Day 1 vs Day 2 *P = 0.013. Latency to avoid: F(2, 44) = 2.88; group comparisons, Halo, Day 1 vs Day 2 *P = 0.024. CS freezing: F(2, 44) = 1.1. ITI freezing: F(2, 44) = 0.46; non-significant change among other group comparison. k, Linear regression of the changes in freezing behavior across test sessions as a function of changes in avoidance behavior. l-o, Left: Optogenetic inhibition of pPVT–NAc axon terminals during the ITI has little effect on avoidance rate (l), the latency to avoid (m) and freezing time during the CS (n) and the ITI (o). Right: Normalization to Day 1 for each group. Ctl, n = 7 mice; Halo, n = 4 mice. Two-way ANOVA followed by two-stage linear step-up procedure of Benjamini, Krieger and Yekutieli. Avoidance rate, F(2, 18) = 0.16; latency to avoid, F(2, 18) = 0.22; CS freezing, F(2, 18) = 0.037; ITI freezing, F(2, 18) = 0.48, Halo, Day 2 vs Day 3 *P = 0.022; non-significant change among other group comparison. p. Moving distance in the open field. Ctl, n = 9 mice; Halo, n = 8 mice. All data in figure shown as mean ± s.e.m.
Extended Data Figure 6.
Extended Data Figure 6.. Optogenetic inhibition of pPVT–CeA axon terminals in the 2AA task.
a, Schematic of the viral vector strategy and optical fiber placement for optogenetic silencing of pPVT–CeA axon terminals in the 2AA task. b, Fiber placements (Ctl, n = 11 mice; Halo, n = 12 mice). c-f, Avoidance rate (c), latency to avoid (d) and freezing time during the CS (e) and ITI (f) across training sessions for each group. g-j, Left: Avoidance rate (g), latency to avoid (h) and freezing time during the CS (i) and the ITI (j) of optogenetic inhibition of pPVT–CeA axon terminals. Right: Normalization to Day 1 for each group. Two-way ANOVA followed by two-stage linear step-up procedure of Benjamini, Krieger and Yekutieli. Avoidance rate: F(2, 42) = 3.27. Latency to avoid: F(2, 42) = 5.35. CS freezing: F(2, 42) = 2.77. ITI freezing: F(2, 42) = 1.67. For group comparisons **P < 0.01, *P < 0.05. k, Linear regression of the changes in freezing behavior across test sessions as a function of changes in avoidance behavior. l-o, Left: Avoidance rate (l), the latency to avoid (m) and freezing time during the CS (n) and the ITI (o) during optogenetic inhibition of pPVT–CeA axon terminals during the ITI. Right: Normalization to Day 1 for each group. Ctl, n = 6 mice; Halo, n = 10 mice. Two-way ANOVA followed by two-stage linear step-up procedure of Benjamini, Krieger and Yekutieli. Avoidance rate, F(2 ,28) = 0.0052; latency to avoid, F(2, 28) = 0.22; CS freezing, F(2, 28) = 0.61; ITI freezing, F(2, 28) = 0.086; non-significant change among each group comparison. p. Moving distance in the open field. Ctl, n = 8 mice; Halo, n = 9 mice. All data in figure shown as mean ± s.e.m.
Extended Data Figure 7.
Extended Data Figure 7.. Optogenetic inhibition of pPVTD2R–CeA axon terminals in the 2AA task, related to Figure 7.
a, Freezing time during the ITI across training days in both Ctl and Halo groups. n = 9 mice per group. b, Left: Optogenetic inhibition of pPVTD2R–CeA axon terminals gradually reduces freezing time during the the ITI. Right: Normalization to Day 1 for each group. Two-way ANOVA followed by two-stage linear step-up procedure of Benjamini, Krieger and Yekutieli. F(5, 80) = 0.44; group comparisons, Ctl, Day 1 vs Day 6 ***P = 0.0006, Day 2 vs Day 6 *P = 0.011, Day 3 vs Day 6 **P = 0.0074, Day 4 vs Day 6 *P = 0.048; Halo, Day 1 vs Day 6 *P = 0.017. c, Linear regression of the changes in freezing behavior between Test Day 1 and other test sessions as a function of changes in avoidance behavior. All data in figure shown as mean ± s.e.m.
Extended Data Figure 8.
Extended Data Figure 8.. Optogenetic stimulation of pPVTD2R–NAc or pPVTD2R–CeA axon terminals in the 2AA task.
a, Schematic of the viral vector strategy and optical fiber placement for optogenetic stimulation of pPVTD2R–NAc axon terminals in the 2AA task. b, Fiber placements (Ctl, n = 8 mice; ChR, n = 12 mice). c-f, Avoidance rate (c), latency to avoid (d) and freezing time during the CS (e) and ITI (f) across training sessions for each group. g-j, Top: Avoidance rate (g), latency to avoid (h) and freezing time during the CS (i) and the ITI (j) during optogenetic stimulation of pPVTD2R–NAc axon terminals. Bottom: Normalization to Day 1 for each group. Two-way ANOVA followed by two-stage linear step-up procedure of Benjamini, Krieger and Yekutieli. Avoidance rate: F(2, 36) = 6.21. Latency to avoid: F(2, 36) = 3.34. CS freezing: F(2, 36) = 0.16; ITI freezing: F(2, 36) = 0.21. For group comparisons **P < 0.01, *P < 0.05 k, Linear regression of the changes in freezing behavior across test sessions as a function of changes in avoidance behavior. l, Schematic of the viral vector strategy and optical fiber placement for optogenetic stimulating of pPVTD2R–CeA axon terminals in the 2AA task. m, Fiber placements (Ctl, n = 7 mice; ChR, n = 10 mice). n-q, Avoidance rate (n), latency to avoid (o) and freezing time during the CS (p) and ITI (q) across training sessions for both groups. r-u, Top: Avoidance rate (r), latency to avoid (s) and freezing time during the CS (t) and the ITI (u) during optogenetic stimulation of pPVTD2R–CeA axon terminals. Bottom: Normalization to Day 1 for each group. Two-way ANOVA followed by two-stage linear step-up procedure of Benjamini, Krieger and Yekutieli. Avoidance rate: F(2, 30) = 5.43. Latency to avoid: F(2, 30) = 1.89. CS freezing: F(2, 30) = 0.88; ITI freezing: F(2, 30) = 0.66. For group comparisons **P < 0.01, *P < 0.05. v, Linear regression of the changes in freezing behavior across test sessions as a function of changes in avoidance behavior. All data in figure shown as mean ± s.e.m.
Extended Data Figure 9.
Extended Data Figure 9.. Optogenetic inhibition of pPVTD2R–NAc or pPVTD2R–CeA axon terminals in the 2AA task, related to Figure 8.
a, Optical fiber placements (n = 8 mice per group). b, Freezing time during the ITI across training sessions for both Ctl and Halo groups. c, Left: Effect of optogenetic inhibition of pPVTD2R–NAc axon terminals (Day 2) and pPVTD2R–CeA axon terminals (Day 3) on ITI freezing. Right: Normalization to Day 1 for each group. Two-way ANOVA followed by two-stage linear step-up procedure of Benjamini, Krieger and Yekutieli. F(3, 42) = 1.08; Halo, Day 1 vs Day 2 *P = 0.032. d, Linear regression of the changes in freezing behavior across test sessions as a function of changes in avoidance behavior. All data in figure shown as mean ± s.e.m.
Figure 10.
Figure 10.. Monosynaptic inputs of NAc– and CeA–projecting neurons of the pPVT.
a, Schematic of the viral vector strategy to trace the inputs to NAc–projectors or CeA–projectors in pPVT. b, Representative images showing the rabies starter cells (Rabies-GFP and TVA-mCherry double-labelled cells) in pPVT neurons. c, Quantification of monosynaptic inputs to NAc–projectors or CeA–projectors in pPVT. NAc–projectors, n = 3 mice; CeA–projectors, n = 2 mice. To normalize retrogradely labeled (GFP+) cells between subjects, a connectivity index for each brain region was computed by dividing the number of retrogradely labeled cells by the number of starter cells (See Methods).
Figure 1.
Figure 1.. pPVTD2R projections to NAc and CeA are partially segregated.
a, Schematic of the viral vector strategy for anterograde tracing pPVT projections. b, Representative images showing Halo-mCherry expression in neurons of the pPVT (left) and axon terminals within the NAc (middle) and the CeA (right). c, Schematic of the viral vector strategy for anterograde tracing pPVTD2R projections. d, Representative images showing ChR2-YFP expression in pPVTD2R neurons (left) and axon terminals within the NAc (middle) and the CeA (right). e, Schematic of the retrograde tracing strategy used for labeling CeA- and NAc-projecting pPVT neurons. f, Representative images showing the targets for dual-color CTB injections, green into the NAc (left) and red into the CeA (right). g, Representative images showing the retrograde labeled NAc-projecting cells (green) and CeA-projecting cells (red) are predominantly present in the D2R-labeled (grey) pPVT region. h, Quantification of the density of CeA- and NAc-projecting neurons in the pPVT. NAc-projectors (NAc+), 1180 ± 163.36; CeA-projectors (CeA+), 732.2 ± 57.97; n= 5 mice; two-tailed Student’s t-test, *P = 0.032. i, D2R protein expression of NAc-projecting and CeA-projecting pPVT cells. D2R+NAc+/NAc+, 99.21 ± 0.22%; D2R+CeA+/CeA+, 99.68 ± 0.26%; n= 5 mice; two-tailed Student’s t-test, P = 0.2. j, Quantification of the percentage of double-projecting cells in pPVT. NAc+CeA+/NAc+, 16.71 ± 0.96%; NAc+CeA+/CeA+, 27.18 ± 3.39%; n= 5 mice; two-tailed Student’s t-test, *P = 0.018. All anatomical experimented were repeated at least once, and similar results were obtained. All data in figure shown as mean ± s.e.m.
Figure 2.
Figure 2.. pPVTD2R neurons control active avoidance and are inhibited during freezing.
a, Representative image of GCaMP6s expression and fiber placements (n = 5 mice). b, Schematic of the 2AA task. c, Behavior performance during 2AA. d, Representative imaging traces for avoidance and failure trials. e, Top: Heatmaps of calcium responses. Bottom: Average calcium signal and CS (black line). f, Freezing, Peak, and Mean Signal during the CS for each trial type. Avoidance, n = 118 Trials; Failure, n = 122 Trials; two-tailed Student’s t-test. Freezing, ***P = 2.04E-06; Peak Signal, ***P = 1.19E-10; Mean Signal, ***P = 2.78E-15. g, Quantification of calcium signal for data in (e). AUC, One-way ANOVA followed by two-stage step-up procedure of Benjamini, Krieger and Yekutieli. Avoidance: n = 118 Trials; F(2, 351) =  75.89; group comparisons, pre-CS vs CS ***P < 0.001, pre-CS vs post-CS *P = 0.038, CS vs post-CS ***P < 0.001. Failure: n= 122 Trials; F(2, 363) = 66.54. ***P < 0.001. h, Left: Average responses for different events. Right: quantification of signal for each event on the left. AUC, two-tailed Student’s t-test. CS: Avoidance, n = 118 Events; Failure, n = 122 Events; P = 0.74. Max. Velocity: Avoidance, n = 117 Events; Failure, n = 122 Events; *P= 0.024. Escape initiate: Avoidance, n = 113 Events; Failure, n = 115 Events; ***P < 0.001. Escape: Avoidance, n = 118 Events; Failure, n = 122 Events; **P= 0.0064. Freezing: Avoidance, n = 92 Events; Failure, n = 157 Events; P = 0.98. i, Schematic for the silencing of pPVTD2R neurons. j-l, Avoidance rate (j), latency to avoid (k) and freezing during the CS (l). Behavior data normalized to Day 1 is included. Ctl, n = 8 mice; Halo, n= 9 mice, two-way ANOVA followed by two-stage linear step-up procedure of Benjamini, Krieger and Yekutieli. Avoidance Rate: F(2, 30) = 5.48; group comparisons, Halo, Day 1 vs Day 2 ***P < 0.001, Day 1 vs Day 3 P = 0.06. Latency to avoid: F(2, 30) = 2.48; group comparisons, Halo, Day 1 vs Day 2 **P = 0.0037. CS freezing: F(2, 30) = 0.19; group comparisons, Halo, Day 1 vs Day 2 *P = 0.04. All data in figure shown as mean ± s.e.m.
Figure 3.
Figure 3.. pPVTD2R–NAc axon terminals signal active avoidance.
a, Schematic of the experimental approach for fiber photometry imaging of pPVTD2R–NAc terminals. b, Representative images of GCaMP7s expression in pPVTD2R neurons and optical fiber placement in NAc. c, Fiber placements (n = 4 mice). d, Avoidance Rate and CS Freezing across training and imaging sessions. e, Latency to avoid and ITI Freezing for data in (e). f, Representative imaging traces from sample subject. g, Top: Heatmaps of calcium responses for avoidance and failure trials. Bottom: Average calcium signal and CS duration. h, Freezing, Peak, and Mean Signal during the CS for each trial type. Two-tailed Student’s t-test. Avoidance, n = 80 Trials. Failure, n = 130 Trials. Freezing, ***P < 0.001. i, Linear regression of peak (top) and mean calcium signal (bottom) as a function of freezing time during the CS of avoidance and failure trials. j, Quantification of calcium signal for avoidance and failure trials. AUC, One-way ANOVA followed by two-stage linear step-up procedure of Benjamini, Krieger and Yekutieli. Avoidance: n = 80 Trials, F(2, 237) = 4.37; group comparisons, pre-CS vs CS **P = 0.0065, CS vs post-CS *P = 0.021. Failure: n = 130 Trials, F(2, 387) = 121.2; group comparisons, pre-CS vs CS ***P < 0.001, CS vs post-CS ***P < 0.001. k, Left: Average calcium responses during CS onset, CS maximal velocity, escape initiation, escape and CS freezing epochs for all avoidance and failure trials. Right: Quantification of calcium signal for each event on the left. AUC, two-tailed Student’s t-test. CS: Avoidance, n = 80 Events; Failure, n = 130 Events. Max. Velocity: Avoidance, n = 80 Events; Failure, n = 129 Events; ***P < 0.001. Escape initiate: Avoidance, n = 79 Events; Failure, n = 123 Events. Escape: Avoidance, n = 80 Events; Failure, n = 130 Events. Freezing: Avoidance, n = 76 Events; Failure, n = 175 Events. All data in figure shown as mean ± s.e.m.
Figure 4.
Figure 4.. NAc-projecting neurons of the pPVT signal active avoidance.
a, Schematic of the experimental approach for fiber photometry imaging from pPVT–NAc neurons. b, Fiber placements (n = 5 mice). c, Avoidance Rate and CS freezing across training and imaging sessions. d, Latency to avoid and ITI freezing for data in (c). e, Representative imaging traces from sample subject. f, Top: Heatmaps of calcium responses for avoidance and failure trials. Bottom: Average calcium signal and CS duration. g, Freezing, Peak, and Mean Signal during the CS for each trial type. Two-tailed Student’s t-test. Avoidance, n = 85 Trials. Failure, n = 125 Trials. Freezing, ***P < 0.001; Peak Signal, ***P < 0.001; Mean Signal, ***P < 0.001. h, Linear regression of peak (top) and mean calcium signal (bottom) as a function of freezing time during the CS of avoidance and failure trials. i, Quantification of calcium signal during pre-CS, CS and post-CS periods for avoidance and failure trials. AUC, One-way ANOVA followed by two-stage linear step-up procedure of Benjamini, Krieger and Yekutieli. Avoidance: n = 85 Trials, F(2, 252) = 45.22; group comparisons, pre-CS vs CS ***P < 0.001, pre-CS vs post-CS P = 0.11, CS vs post-CS ***P < 0.001. Failure: n = 125 Trials, F(2, 372) = 81.81; group comparisons, ***P < 0.001. j, Left: Average calcium responses during CS onset, CS maximal velocity, escape initiation, escape and CS freezing epochs for all avoidance and failure trials. Right: Quantification of calcium signal in each epoch duration. AUC, two-tailed Student’s t-test. CS: Avoidance, n = 85 Events; Failure, n = 125 Events; **P = 0.002. Max. Velocity: Avoidance, n = 85 Events; Failure, n = 125 Events. Escape initiate: Avoidance, n = 82 Events; Failure, n = 116 Events; ***P < 0.001. Escape: Avoidance, n = 85 Events; Failure, n = 125 Events; ***P < 0.001. Freezing: Avoidance, n = 76 Events; Failure, n = 169 Events. All data in figure shown as mean ± s.e.m.
Figure 5.
Figure 5.. Optogenetic inhibition of pPVTD2R–NAc axon terminals decreases active avoidance and increases freezing.
a, Schematic of the viral vector strategy and optical fiber placement for optogenetic silencing of pPVTD2R–NAc axon terminals in the 2AA task. b, Representative images from a mouse expressing Halo-mCherry in pPVTD2R neurons (left) and implanted with optical fibers in the NAc (right). c, Fiber placements (n = 8 mice per group). d-g, Avoidance rate (d), latency to avoid (e), freezing time during the CS (f) and ITI freezing (g) across all training sessions for both Ctl and Halo groups. h-k, Left: Optogenetic inhibition of pPVTD2R–NAc axon terminals persistently decreases avoidance rate (h), while increases latency to avoid (i) and freezing time during the CS (j) but has little effect on freezing time during the the ITI (k). Right: Normalization to Day 1 for each group. Two-way ANOVA followed by two-stage linear step-up procedure of Benjamini, Krieger and Yekutieli. Avoidance rate: F(2, 28) = 18.04; group comparisons, Halo, Day 1 vs Day 2 ***P < 0.001, Day 1 vs Day 3 ***P < 0.001. Latency to avoid: F(2, 28) = 5.63; group comparisons, Ctl, Day 1 vs Day 3 *P = 0.028; Halo, Day 1 vs Day 2 ***P < 0.001, Day 1 vs Day 3 ***P < 0.001. CS freezing: F(2, 28) = 1.45; group comparisons, Halo, Day 1 vs Day 2 *P = 0.049, Day 1 vs Day 3 **P = 0.0092. ITI freezing: F(2, 28) = 0.149. l, Linear regression of the changes in freezing behavior across test sessions as a function of changes in avoidance behavior. All data in figure shown as mean ± s.e.m.
Figure 6.
Figure 6.. Fiber photometry imaging of GCaMP7s fluorescence from the CeA terminals of pPVTD2R neurons in the 2AA task.
a, Schematic of the experimental approach for fiber photometry imaging pPVT–CeA terminals. b, Left: Representative images of GCaMP7s expression and fiber placement. Right: Fiber placements (right, n = 5 mice). c, Avoidance Rate and CS freezing across training and imaging sessions. d, Latency to avoid and ITI freezing for data in (c). e, Representative imaging traces from sample subject. f, Top: Heatmaps of calcium responses for avoidance and failure trials. Bottom: Average calcium signal and CS duration. g, Freezing, Peak, and Mean Signal during the CS for each trial type. Two-tailed Student’s t-test. Avoidance, n = 235 Trials. Failure, n = 65 Trials. Freezing, ***P < 0.001. Peak Signal, *P = 0.026. h, Linear regression of peak (top) and mean calcium signal (bottom) as a function of freezing time during the CS of avoidance and failure trials. i, Quantification of calcium signal during pre-CS, CS and post-CS periods for avoidance and failure trials. AUC, One-way ANOVA followed by two-stage linear step-up procedure of Benjamini, Krieger and Yekutieli. Avoidance, n = 235 Trials, F(2, 702) = 1; Failure, n = 65 Trials, F(2, 192) = 0.025; group comparisons, non-significant. j, Left: Average calcium responses during CS onset, CS maximal velocity, escape initiation, escape and CS freezing epochs for all avoidance and failure trials. Right: Quantification of calcium signal for each event on the left. AUC, two-tailed Student’s t-test. CS: Avoidance, n = 235 Events; Failure, n = 65 Events; ***P < 0.001. Max. Velocity: Avoidance, n = 234 Events; Failure, n = 62 Events. Escape initiate: Avoidance, n = 173 Events; Failure, n = 101 Events. Escape: Avoidance, n = 234 Events; Failure, n = 65 Events. Freezing: Avoidance, n = 100 Events; Failure, n = 116 Events. All data in figure shown as mean ± s.e.m.
Figure 7.
Figure 7.. Optogenetic inhibition pPVTD2R–CeA axon terminals increases active avoidance and reduces freezing.
a, Schematic of the viral vector strategy and optical fiber placement used for optogenetic silencing of pPVTD2R–CeA axon terminals. b, Representative images from a mouse expressing Halo-mCherry in pPVTD2R neurons and implanted with optical fibers in the CeA. c, Fiber placements (n = 9 mice per group). d-f, Avoidance rate (d), latency to avoid (e) and freezing time during the CS (f) across all training days in both Ctl and Halo groups. g-i, Top: Avoidance rate (g), latency to avoid (h) and freezing time during the CS (i) during optogenetic inhibition of pPVTD2R–CeA axon terminals. Bottom: Normalization to Day 1 for each group. Two-way ANOVA followed by two-stage linear step-up procedure of Benjamini, Krieger and Yekutieli. Avoidance rate: F(5, 80) = 9.05; group comparisons, Halo, Day 1 vs Day 4 ***P < 0.001, Day 1 vs Day 5 ***P < 0.001, Day 1 vs Day 6 ***P < 0.001, Day 2 vs Day 4 *P = 0.015, Day 2 vs Day 5 ***P < 0.001, Day 2 vs Day 6 ***P < 0.001, Day 3 vs Day 4 *P = 0.015, Day 3 vs Day 5 ***P = 0.0005, Day 3 vs Day 6 ***P < 0.001, Day 4 vs Day 6 ***P < 0.001, Day 5 vs Day 6 *P = 0.012. Latency to avoid: F(5, 80) = 4.52; group comparison, Halo, Day 1 vs Day 4 *P = 0.011, Day 1 vs Day 5 ***P < 0.001, Day 1 vs Day 6 ***P < 0.001, Day 2 vs Day 5 *P = 0.043, Day 2 vs Day 6 ***P = 0.0003, Day 3 vs Day 5 **P = 0.0085, Day 3 vs Day 6 ***P < 0.001, Day 4 vs Day 6 **P = 0.0027. CS freezing: F(5, 80) = 1.17; group comparisons, Halo, Day 3 vs Day 6 *P = 0.012, Day 4 vs Day 6 **P = 0.007, Day 5 vs Day 6 *P = 0.018. All data in figure shown as mean ± s.e.m.
Figure 8.
Figure 8.. pPVTD2R projections to the NAc and the CeA flexibly bias the selection of defensive behaviors.
a, Schematic of the viral vector strategy and optical fiber placement for optogenetic silencing of pPVTD2R–NAc or pPVTD2R–CeA axon terminals in the same subject. b-d, Avoidance rate (b), latency to avoid (c) and freezing time during the CS (d) across all training sessions for both Ctl and Halo groups (n = 8 mice per group). e-g, Top: Optogenetic inhibition of pPVTD2R–NAc axon terminals (Day 2) decreases avoidance rate (e), increases latency to avoid (f) and freezing time during the CS (g), while following optogenetic inhibition of pPVTD2R–CeA axon terminals (Day 3) reverses these changes. Bottom: Normalization to Day 1 for each group. Two-way ANOVA followed by two-stage linear step-up procedure of Benjamini, Krieger and Yekutieli. Avoidance rate: F(3, 42) = 6.09; group comparisons, Halo, Day 1 vs Day 2 **P = 0.0017, Day 2 vs Day 3 ** P= 0.0072, Day 2 vs Day 4 **P = 0.0078. Latency to avoid: F(3, 42) = 5.56; group comparisons, Halo, Day 1 vs Day 2 **P = 0.0029, Day 2 vs Day 3 *P = 0.012, Day 2 vs Day 4 *P = 0.02. CS freezing: F(3, 42) = 0.74; group comparisons, Halo, Day 1 vs Day 2 P = 0.086, Day 1 vs Day 4 *P = 0.013, Day 2 vs Day 3 *P = 0.043. All data in figure shown as mean ± s.e.m.

References

    1. LeDoux JE Emotion circuits in the brain. Annu Rev Neurosci 23, 155–184, doi:10.1146/annurev.neuro.23.1.155 (2000). - DOI - PubMed
    1. Duvarci S & Pare D Amygdala microcircuits controlling learned fear. Neuron 82, 966–980, doi:10.1016/j.neuron.2014.04.042 (2014). - DOI - PMC - PubMed
    1. Fanselow MS & Poulos AM The neuroscience of mammalian associative learning. Annu Rev Psychol 56, 207–234, doi:10.1146/annurev.psych.56.091103.070213 (2005). - DOI - PubMed
    1. Fadok JP et al.A competitive inhibitory circuit for selection of active and passive fear responses. Nature 542, 96–100, doi:10.1038/nature21047 (2017). - DOI - PubMed
    1. LeDoux JE, Moscarello J, Sears R & Campese V The birth, death and resurrection of avoidance: a reconceptualization of a troubled paradigm. Mol Psychiatry 22, 24–36, doi:10.1038/mp.2016.166 (2017). - DOI - PMC - PubMed

REFERENCES CITED IN METHODS

    1. Penzo MA et al.The paraventricular thalamus controls a central amygdala fear circuit. Nature 519, 455–459, doi:10.1038/nature13978 (2015). - DOI - PMC - PubMed
    1. Beas BS et al.The locus coeruleus drives disinhibition in the midline thalamus via a dopaminergic mechanism. Nat Neurosci, doi:10.1038/s41593-018-0167-4 (2018). - DOI - PMC - PubMed
    1. Gao C et al.Two genetically, anatomically and functionally distinct cell types segregate across anteroposterior axis of paraventricular thalamus. Nat Neurosci 23, 217–228, doi:10.1038/s41593-019-0572-3 (2020). - DOI - PMC - PubMed
    1. Choi JS, Cain CK & LeDoux JE The role of amygdala nuclei in the expression of auditory signaled two-way active avoidance in rats. Learn Mem 17, 139–147, doi:10.1101/lm.1676610 (2010). - DOI - PMC - PubMed
    1. Haynes K, Fearnhead P & Eckley IA A computationally efficient nonparametric approach for changepoint detection. Stat Comput 27, 1293–1305, doi:10.1007/s11222-016-9687-5 (2017). - DOI - PMC - PubMed

Publication types