

Identification of key genes and crucial pathways for major depressive disorder using peripheral blood samples and chronic unpredictable mild stress rat models
- PMID: 34414022
- PMCID: PMC8344689
- DOI: 10.7717/peerj.11694
Identification of key genes and crucial pathways for major depressive disorder using peripheral blood samples and chronic unpredictable mild stress rat models
Abstract
Background: Accurate diagnosis of major depressive disorder (MDD) remains difficult, and one of the key challenges in diagnosing MDD is the lack of reliable diagnostic biomarkers. The objective of this study was to explore gene networks and identify potential biomarkers for MDD.
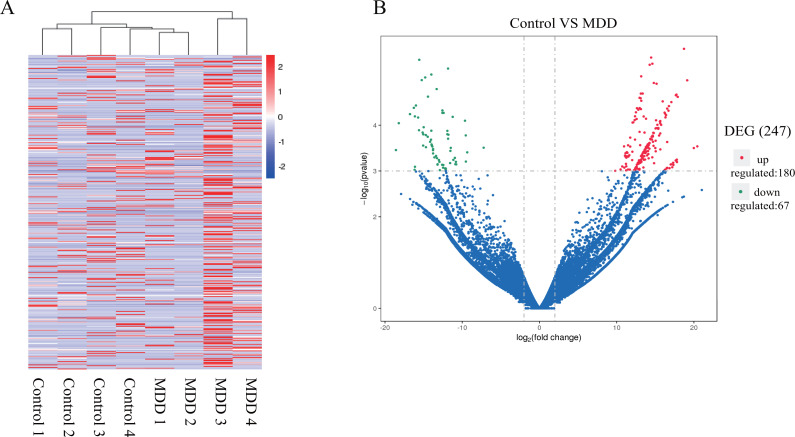
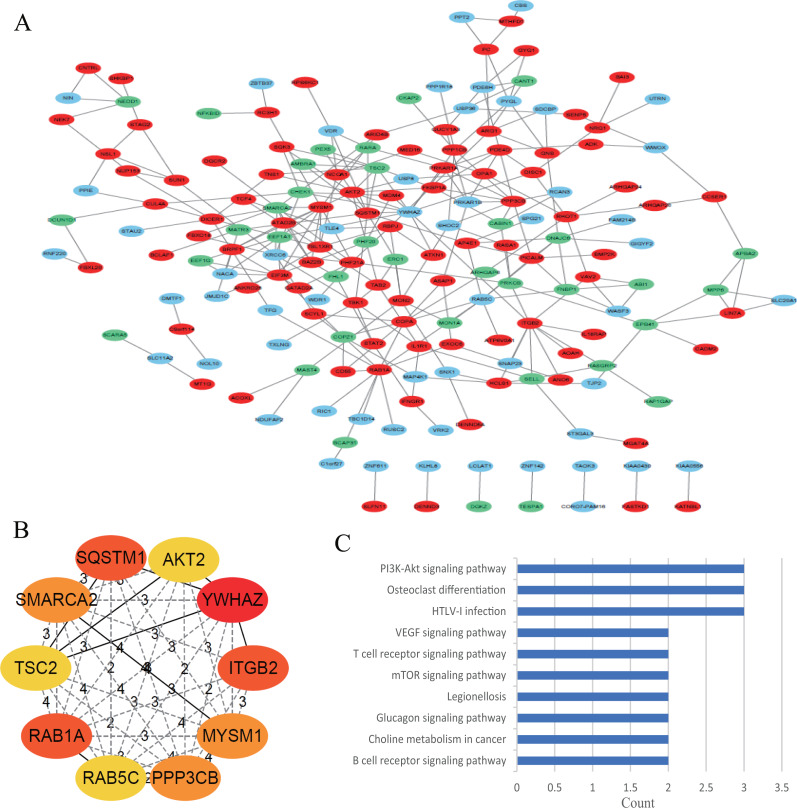
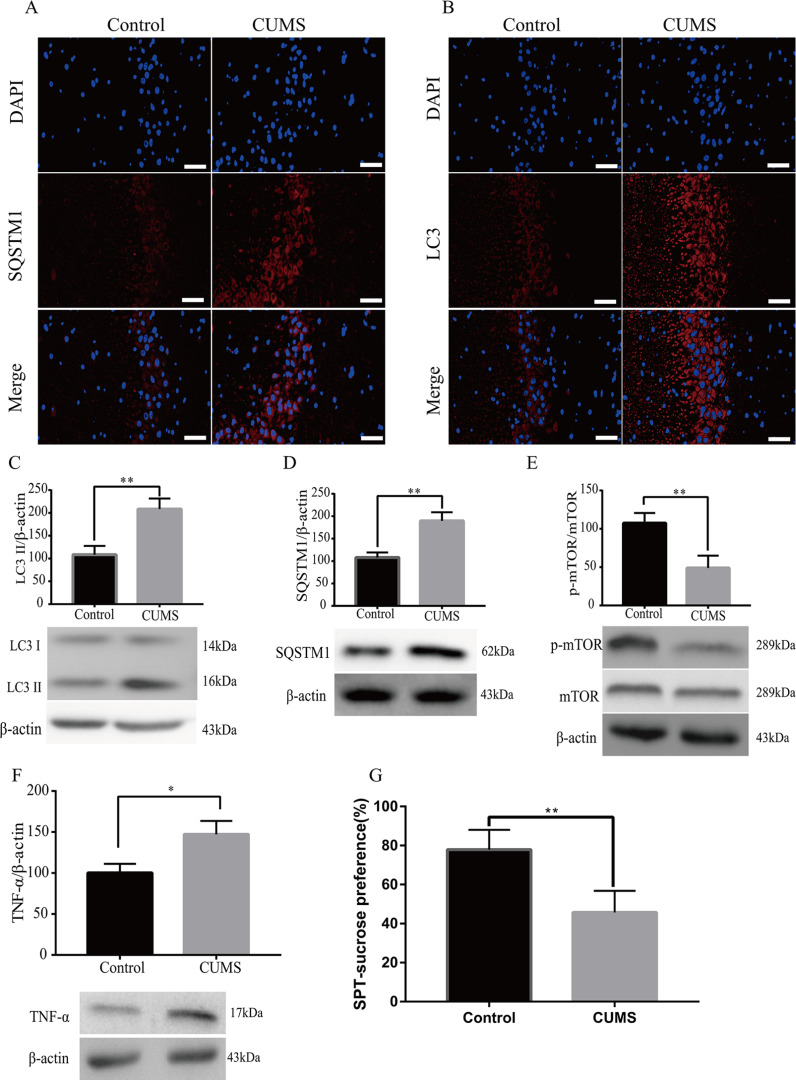
Methods: In the present study, we performed a comprehensive analysis of the mRNA expression profiles using blood samples of four patients with MDD and four controls by RNA sequencing. Differentially expressed genes (DEGs) were screened, and functional and pathway enrichment analyses were performed using the Database for Annotation, Visualization, and Integrated Discovery. All DEGs were inputted to the STRING database to build a PPI network, and the top 10 hub genes were screened using the cytoHubba plugin of the Cytoscape software. The relative expression of 10 key genes was identified by quantitative real-time polymerase chain reaction (qRT-PCR) of blood samples from 50 MDD patients and 50 controls. Plasma levels of SQSTM1 and TNFα were measured using an enzyme-linked immunosorbent assay in blood samples of 44 MDD patients and 44 controls. A sucrose preference test was used to evaluate depression-like behavior in chronic unpredictable mild stress (CUMS) model rats. Immunofluorescence assay and western blotting were performed to study the expression of proteins in the brain samples of CUMS model rats.
Results: We identified 247 DEGs that were closely associated with MDD. Gene ontology analyses suggested that the DEGs were mainly enriched in negative regulation of transcription by RNA polymerase II promoter, cytoplasm, and protein binding. Moreover, Kyoto Encyclopedia of Genes and Genomes pathway analysis suggested that the DEGs were significantly enriched in the MAPK signaling pathway. Ten hub genes were screened through the PPI network, and qRT-PCR assay revealed that one and six genes were downregulated and upregulated, respectively; however, SMARCA2, PPP3CB, and RAB5C were not detected. Pathway enrichment analysis for the 10 genes showed that the mTOR signaling pathway was also enriched. A strong positive correlation was observed between SQSTM1 and TNFα protein levels in patients with MDD. LC3 II and SQSTM1 protein levels were increased in the CUMS rat model; however, p-mTOR protein levels were decreased. The sucrose preference values decreased in the CUMS rat model.
Conclusions: We identified 247 DEGs and constructed an MDD-specific network; thereafter, 10 hub genes were selected for further analysis. Our results provide novel insights into the pathogenesis of MDD. Moreover, SQSTM1, which is related to autophagy and inflammatory reactions, may play a key role in MDD. SQSTM1 may be used as a promising therapeutic target in MDD; additionally, more molecular mechanisms have been suggested that should be focused on in future in vivo and in vitro studies.
Keywords: Autophagy; CUMS; Inflammation; Major depressive disorder; PPI network analysis; SQSTM1.
©2021 He et al.
Conflict of interest statement
The authors declare there are no competing interests.
Figures


References
-
- Alvarez-Mon MA, Gómez-Lahoz AM, Orozco A, Lahera G, Diaz D, Ortega MA, Albillos A, Quintero J, Aubá E, Monserrat J, Alvarez-Mon M. Expansion of CD4 T Lymphocytes Expressing Interleukin 17 and Tumor Necrosis Factor in Patients with Major Depressive Disorder. Journal of Personalized Medicine. 2021;11:220. doi: 10.3390/jpm11030220. - DOI - PMC - PubMed
-
- Chu Y, Chen W, Peng W, Liu Y, Xu L, Zuo J, Zhou J, Zhang Y, Zhang N, Li J, Liu L, Yao K, Gao G, Wang X, Han R, Liu C, Li Y, Zhou H, Huang Y, Ye Y. Amnion-Derived Mesenchymal Stem Cell Exosomes-Mediated Autophagy Promotes the Survival of Trophoblasts Under Hypoxia Through mTOR Pathway by the Downregulation of EZH2. Frontiers in Cell and Developmental Biology. 2020;8:545852. doi: 10.3389/fcell.2020.545852. - DOI - PMC - PubMed
LinkOut - more resources
Full Text Sources
Miscellaneous
