. 2021 Jul;10(4):346-359.
doi: 10.1159/000515305. Epub 2021 May 12.

Exploring Markers of Exhausted CD8 T Cells to Predict Response to Immune Checkpoint Inhibitor Therapy for Hepatocellular Carcinoma

Affiliations

Exploring Markers of Exhausted CD8 T Cells to Predict Response to Immune Checkpoint Inhibitor Therapy for Hepatocellular Carcinoma

Chia-Lang Hsu et al. Liver Cancer. 2021 Jul.

Abstract

Background: Reversal of CD8 T-cell exhaustion was considered a major antitumor mechanism of anti-programmed cell death-1 (PD-1)/ anti-programmed death ligand-1 (PD-L1)-based immune checkpoint inhibitor (ICI) therapy.

Objectives: The aim of this study was to identify markers of T-cell exhaustion that is best associated with ICI treatment efficacy for advanced hepatocellular carcinoma (HCC).

Methods: Immune cell composition of archival tumor samples was analyzed by transcriptomic analysis and multiplex immunofluorescence staining.

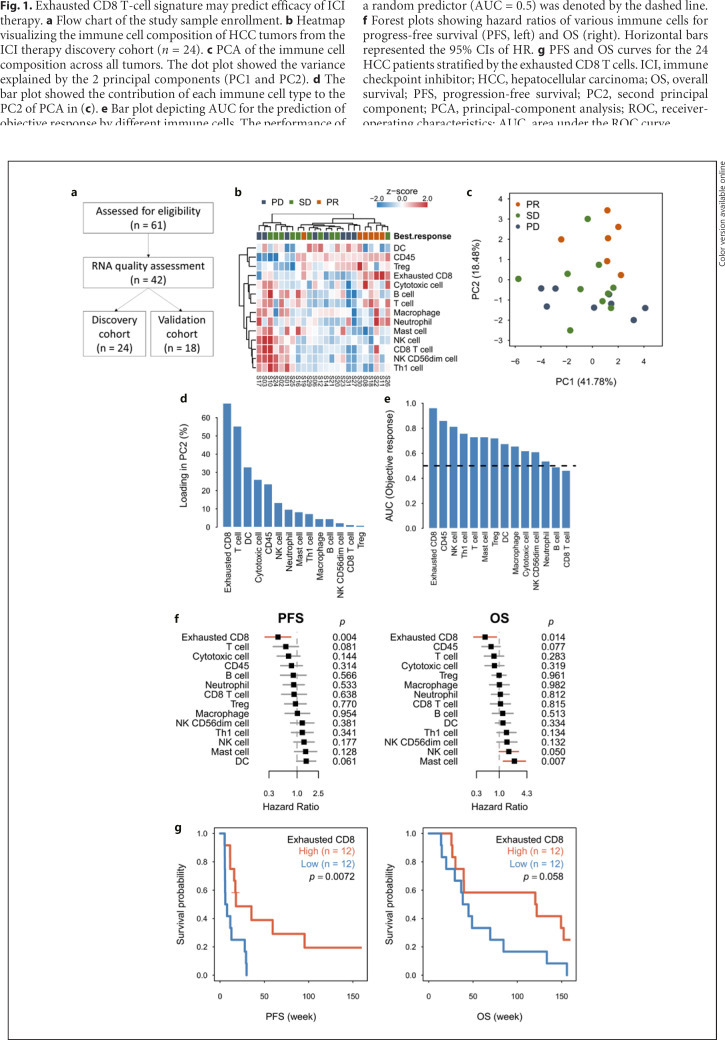
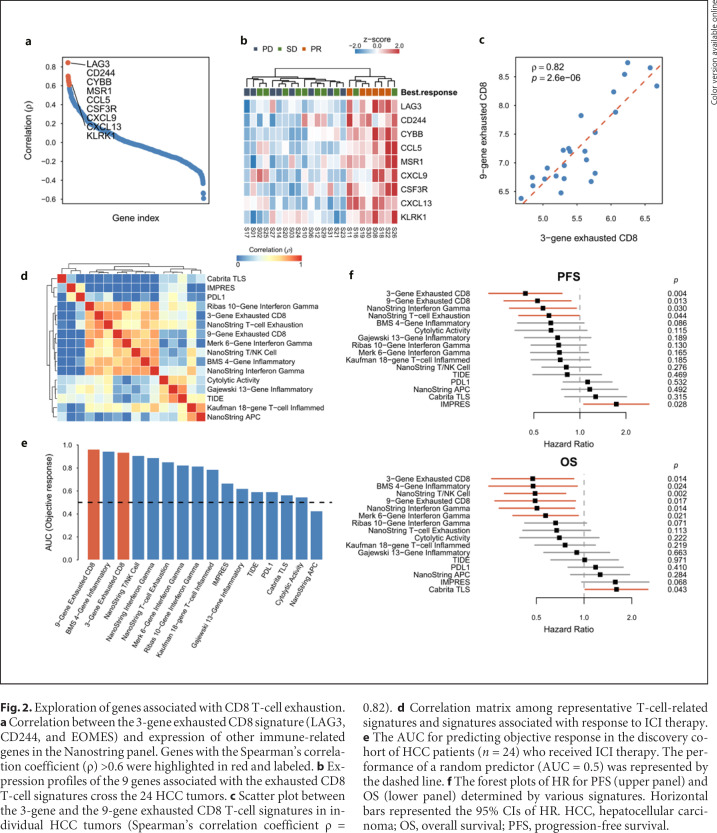
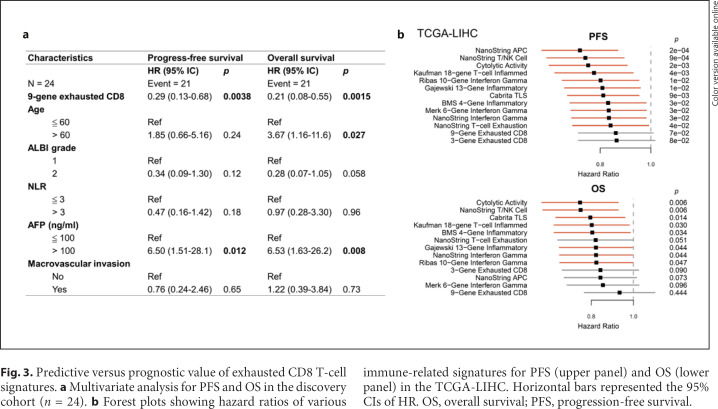
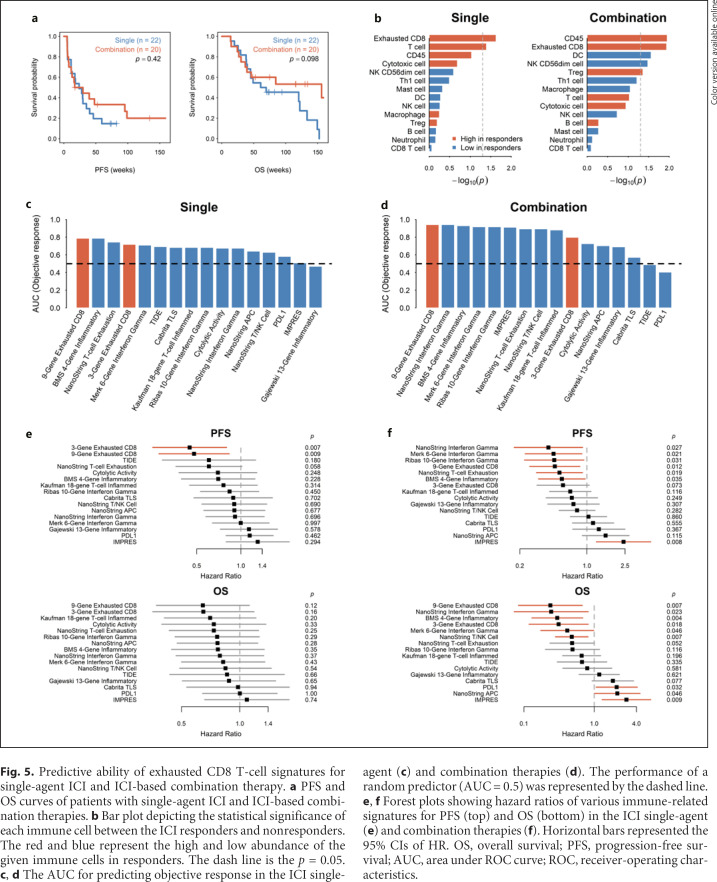
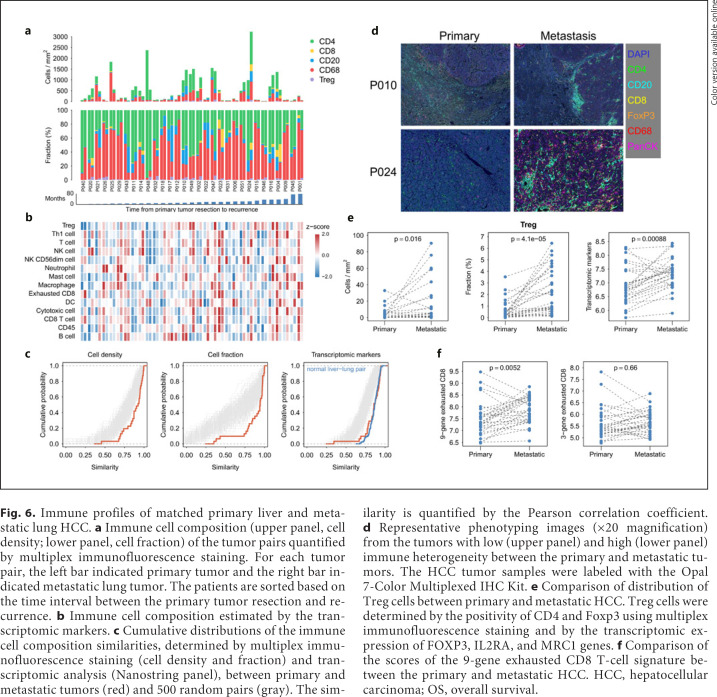
Results: HCC patients with objective response after anti-PD-1/anti-PD-L1-based ICI therapy (n = 42) had higher expression of genes related to T-cell exhaustion. A 9-gene signature (LAG3, CD244, CCL5, CXCL9, CXCL13, MSR1, CSF3R, CYBB, and KLRK1) was defined, whose expression was higher in patients with response to ICI therapy, correlated with density of CD8+LAG3+ cells in tumor microenvironment, and independently predicted better progression-free and overall survival. This 9-gene signature had similar predictive values for patients who received single-agent or combination ICI therapy and was not associated with prognosis in HCC patients who received surgery, suggesting that it may outperform other T-cell signatures for predicting efficacy of ICI therapy for HCC. For HCC patients who underwent surgery for both the primary liver and metastatic lung tumors (n = 31), lung metastatic HCC was associated with a higher exhausted CD8 T-cell signature, consistent with prior observation that patients with lung metastatic HCC may have higher probability of response to ICI therapy.

Conclusions: CD8 T-cell exhaustion in tumor microenvironment may predict better efficacy of ICI therapy for HCC.

Keywords: Anti-PD-1; Anti-PD-L1; Immune checkpoint inhibitor; T-cell exhaustion; Tumor microenvironment.


Conflict of interest statement

Dr. Ann-Lii Cheng is a consultant for and a member of the speaker's bureau of Bayer-Schering Pharma. Dr. Ann-Lii Cheng is a consultant of Novartis, Merck Serono, Eisai, Merck Sharp & Dohme (MSD) Corp., ONXEO, Bayer HealthCare Pharmaceuticals Inc., BMS Company, and Ono Pharmaceutical Co., Ltd. Dr. Ann-Lii Cheng is an associate editor of Liver Cancer. Dr. Chiun Hsu received research grants from BMS/ONO, Roche, and Ipsen and received honorarium from the following pharmaceutical companies: AstraZeneca, Bayer, BMS/ONO, Eisai, Eli Lilly, Ipsen, Merck Serono, MSD, Novartis, Roche, TTY Biopharm.

Figures

Fig. 1
Fig. 1
Exhausted CD8 T-cell signature may predict efficacy of ICI therapy. a Flow chart of the study sample enrollment. b Heatmap visualizing the immune cell composition of HCC tumors from the ICI therapy discovery cohort (n = 24). c PCA of the immune cell composition across all tumors. The dot plot showed the variance explained by the 2 principal components (PC1 and PC2). d The bar plot showed the contribution of each immune cell type to the PC2 of PCA in (c). e Bar plot depicting AUC for the prediction of objective response by different immune cells. The performance of a random predictor (AUC = 0.5) was denoted by the dashed line. f Forest plots showing hazard ratios of various immune cells for progress-free survival (PFS, left) and OS (right). Horizontal bars represented the 95% CIs of HR. g PFS and OS curves for the 24 HCC patients stratified by the exhausted CD8 T cells. ICI, immune checkpoint inhibitor; HCC, hepatocellular carcinoma; OS, overall survival; PFS, progression-free survival; PC2, second principal component; PCA, principal-component analysis; ROC, receiver-operating characteristics; AUC, area under the ROC curve.
Fig. 2
Fig. 2
Exploration of genes associated with CD8 T-cell exhaustion. a Correlation between the 3-gene exhausted CD8 signature (LAG3, CD244, and EOMES) and expression of other immune-related genes in the Nanostring panel. Genes with the Spearman's correlation coefficient (ρ) >0.6 were highlighted in red and labeled. b Expression profiles of the 9 genes associated with the exhausted CD8 T-cell signatures cross the 24 HCC tumors. c Scatter plot between the 3-gene and the 9-gene exhausted CD8 T-cell signatures in individual HCC tumors (Spearman's correlation coefficient ρ = 0.82). d Correlation matrix among representative T-cell-related signatures and signatures associated with response to ICI therapy. e The AUC for predicting objective response in the discovery cohort of HCC patients (n = 24) who received ICI therapy. The performance of a random predictor (AUC = 0.5) was represented by the dashed line. f The forest plots of HR for PFS (upper panel) and OS (lower panel) determined by various signatures. Horizontal bars represented the 95% CIs of HR. HCC, hepatocellular carcinoma; OS, overall survival; PFS, progression-free survival.
Fig. 3
Fig. 3
Predictive versus prognostic value of exhausted CD8 T-cell signatures. a Multivariate analysis for PFS and OS in the discovery cohort (n = 24). b Forest plots showing hazard ratios of various immune-related signatures for PFS (upper panel) and OS (lower panel) in the TCGA-LIHC. Horizontal bars represented the 95% CIs of HR. OS, overall survival; PFS, progression-free survival.
Fig. 4
Fig. 4
Validation of exhausted CD8 infiltration using multiplex immunofluorescence staining. a Representative images (×20 magnification) from the tumors with low (top) and high (bottom) infiltrated exhausted CD8 T cells from patients with PD or PR from the ICI therapy cohort (right panel). Spectrally unmixed images (i); overlaid phenotyping images of each cell type (ii). b Correlation between the 9-gene exhausted CD8 T-cell signatures and densities of exhausted CD8 cells (CD8+LAG3+ or CD8+PD1+) calculated by Spearman correlation coefficient (ρ) in the ICI therapy discovery cohort (n = 24). c The ROC curves for the densities of exhausted CD8 cells (CD8+LAG3+ or CD8+PD1+) to predict objective response after ICI therapy. d The PFS and OS curves for patients in the ICI therapy discovery cohort, stratified by the cell density of exhausted CD8 (CD8+LAG3+ or CD8+PD1+) T cells. OS, overall survival; PFS, progression-free survival; PR, partial response; PD, progressive disease; ROC, receiver-operating characteristics.
Fig. 5
Fig. 5
Predictive ability of exhausted CD8 T-cell signatures for single-agent ICI and ICI-based combination therapy. a PFS and OS curves of patients with single-agent ICI and ICI-based combination therapies. b Bar plot depicting the statistical significance of each immune cell between the ICI responders and nonresponders. The red and blue represent the high and low abundance of the given immune cells in responders. The dash line is the p = 0.05. c, d The AUC for predicting objective response in the ICI single-agent (c) and combination therapies (d). The performance of a random predictor (AUC = 0.5) was represented by the dashed line. e, f Forest plots showing hazard ratios of various immune-related signatures for PFS (top) and OS (bottom) in the ICI single-agent (e) and combination therapies (f). Horizontal bars represented the 95% CIs of HR. OS, overall survival; PFS, progression-free survival; AUC, area under ROC curve; ROC, receiver-operating characteristics.
Fig. 6
Fig. 6
Immune profiles of matched primary liver and metastatic lung HCC. a Immune cell composition (upper panel, cell density; lower panel, cell fraction) of the tumor pairs quantified by multiplex immunofluorescence staining. For each tumor pair, the left bar indicated primary tumor and the right bar indicated metastatic lung tumor. The patients are sorted based on the time interval between the primary tumor resection and recurrence. b Immune cell composition estimated by the transcriptomic markers. c Cumulative distributions of the immune cell composition similarities, determined by multiplex immunofluorescence staining (cell density and fraction) and transcriptomic analysis (Nanostring panel), between primary and metastatic tumors (red) and 500 random pairs (gray). The similarity is quantified by the Pearson correlation coefficient. d Representative phenotyping images (×20 magnification) from the tumors with low (upper panel) and high (lower panel) immune heterogeneity between the primary and metastatic tumors. The HCC tumor samples were labeled with the Opal 7-Color Multiplexed IHC Kit. e Comparison of distribution of Treg cells between primary and metastatic HCC. Treg cells were determined by the positivity of CD4 and Foxp3 using multiplex immunofluorescence staining and by the transcriptomic expression of FOXP3, IL2RA, and MRC1 genes. f Comparison of the scores of the 9-gene exhausted CD8 T-cell signature between the primary and metastatic HCC. HCC, hepatocellular carcinoma; OS, overall survival.

References

    1. Callahan MK, Postow MA, Wolchok JD. Targeting T cell co-receptors for cancer therapy. Immunity. 2016;44((5)):1069–78. - PubMed
    1. Hoos A. Development of immuno-oncology drugs: from CTLA4 to PD1 to the next generations. Nat Rev Drug Discov. 2016;15((4)):235–47. - PubMed
    1. El-Khoueiry AB, Sangro B, Yau T, Crocenzi TS, Kudo M, Hsu C, et al. Nivolumab in patients with advanced hepatocellular carcinoma (CheckMate 040): an open-label, non-comparative, phase 1/2 dose escalation and expansion trial. Lancet. 2017;389((10088)):2492–502. - PMC - PubMed
    1. Zhu AX, Richard SF, Julien E, Stephane C, Sadahisa O, Daniel P, et al. Pembrolizumab in patients with advanced hepatocellular carcinoma previously treated with sorafenib (KEYNOTE-224): a non-randomised, open-label phase 2 trial. Lancet Oncol. 2018;19((7)):940–52. - PubMed
    1. Yau T, Park JW, Finn RS, Cheng A-L, Mathurin P, Edeline J, et al. CheckMate 459: A randomized, multi-center phase 3 study of nivolumab (NIVO) vs sorafenib (SOR) as first-line (1L) treatment in patients (pts) with advanced hepatocellular carcinoma (aHCC) Ann Oncol. 2019;30((Suppl 5)):v851–v934.