. 2021 Aug 3:11:712105.
doi: 10.3389/fcimb.2021.712105. eCollection 2021.

Chronic Hepatitis C Pathogenesis: Immune Response in the Liver Microenvironment and Peripheral Compartment

Affiliations

Chronic Hepatitis C Pathogenesis: Immune Response in the Liver Microenvironment and Peripheral Compartment

Daniela Alejandra Rios et al. Front Cell Infect Microbiol. .

Abstract

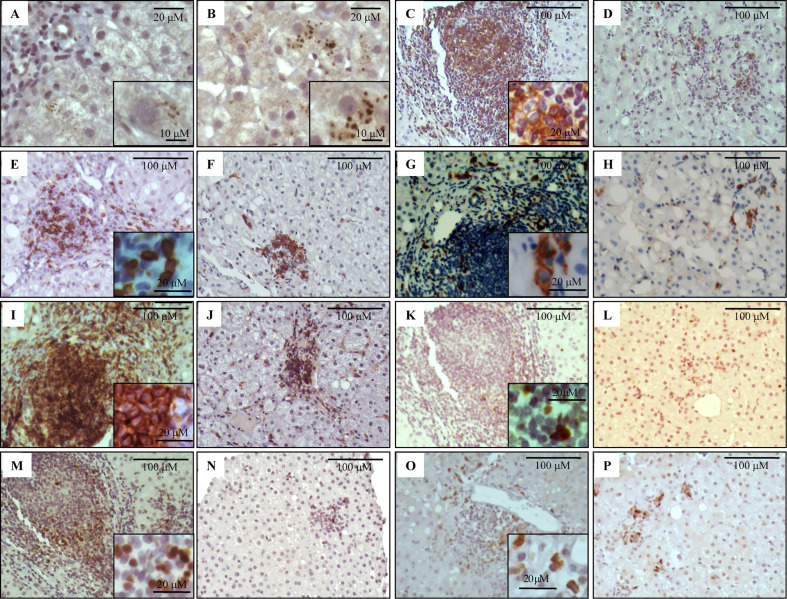
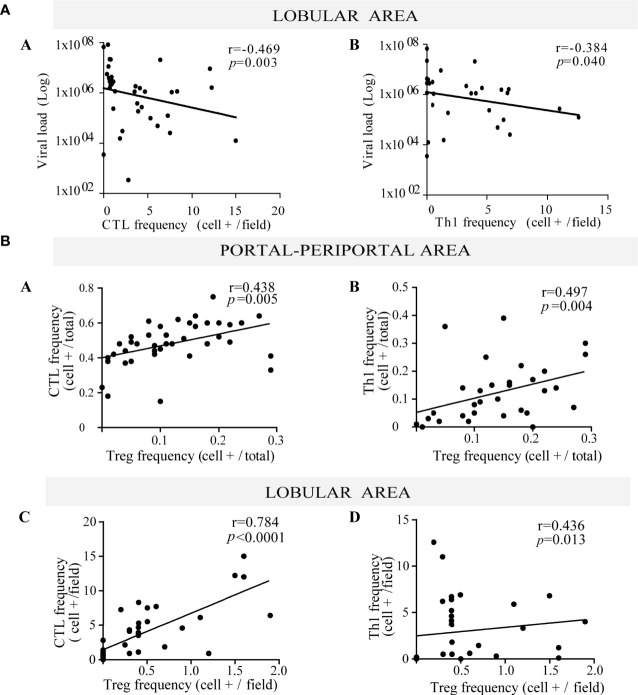
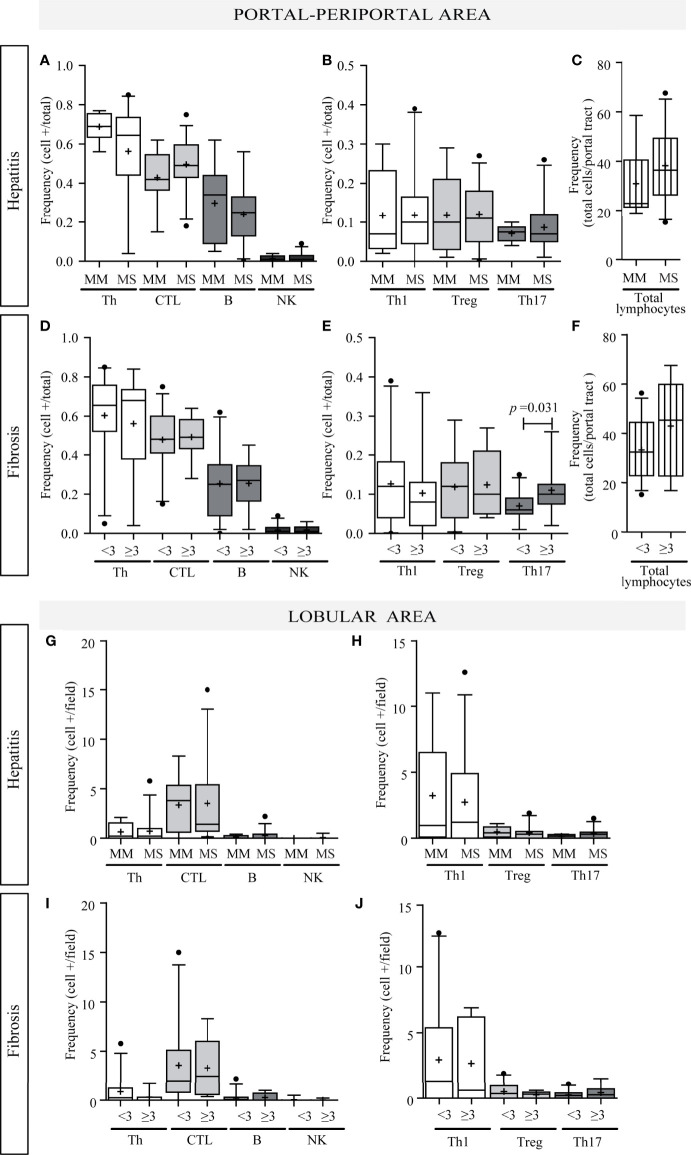
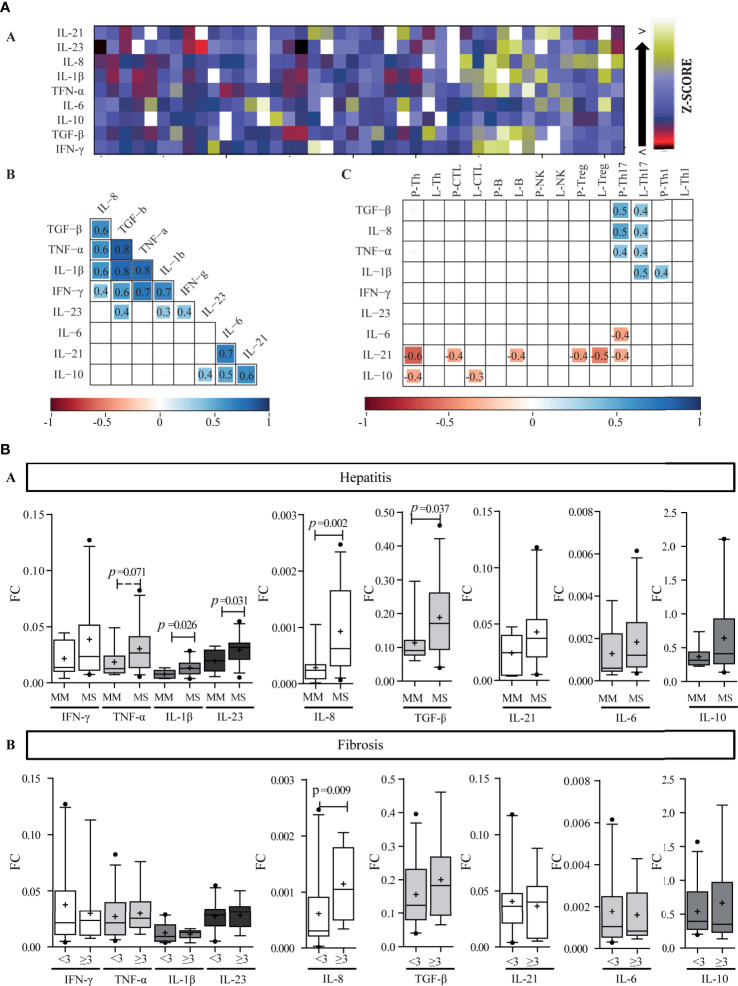
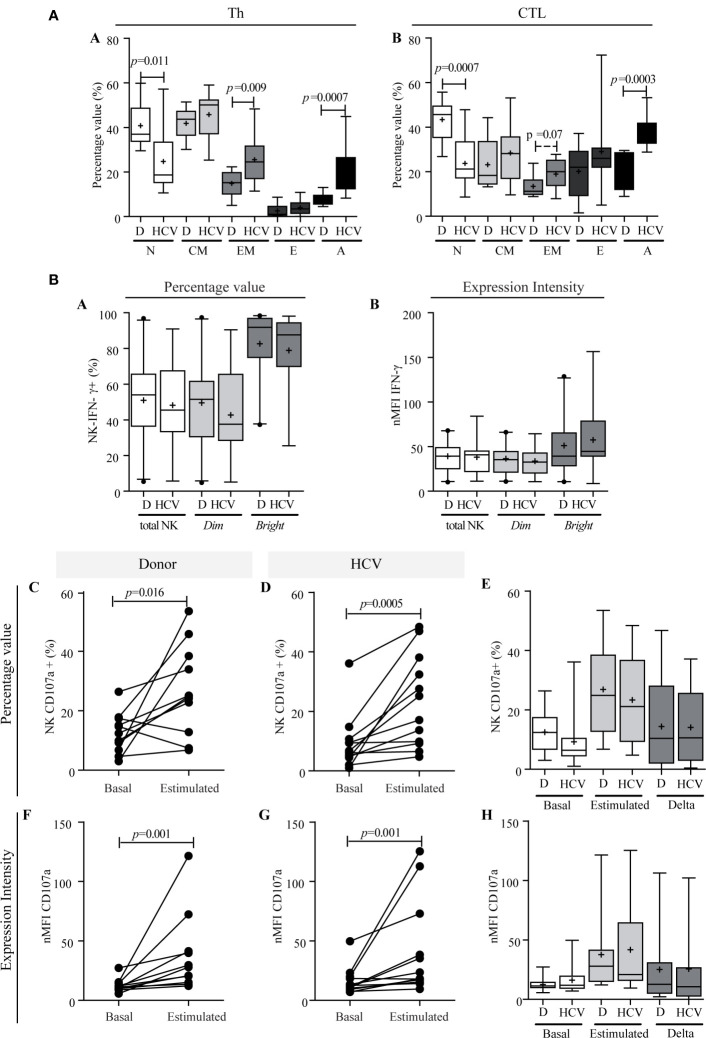
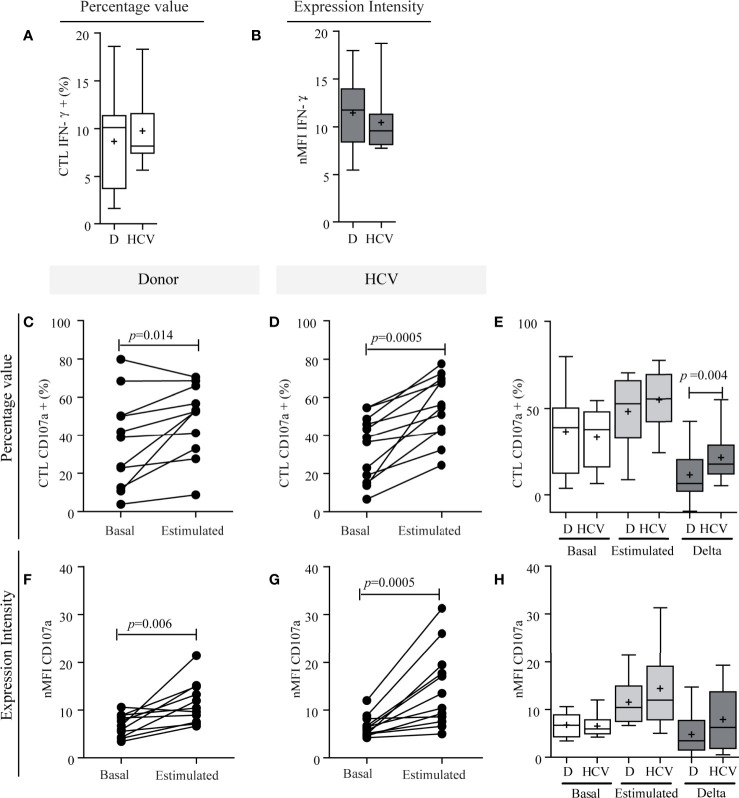
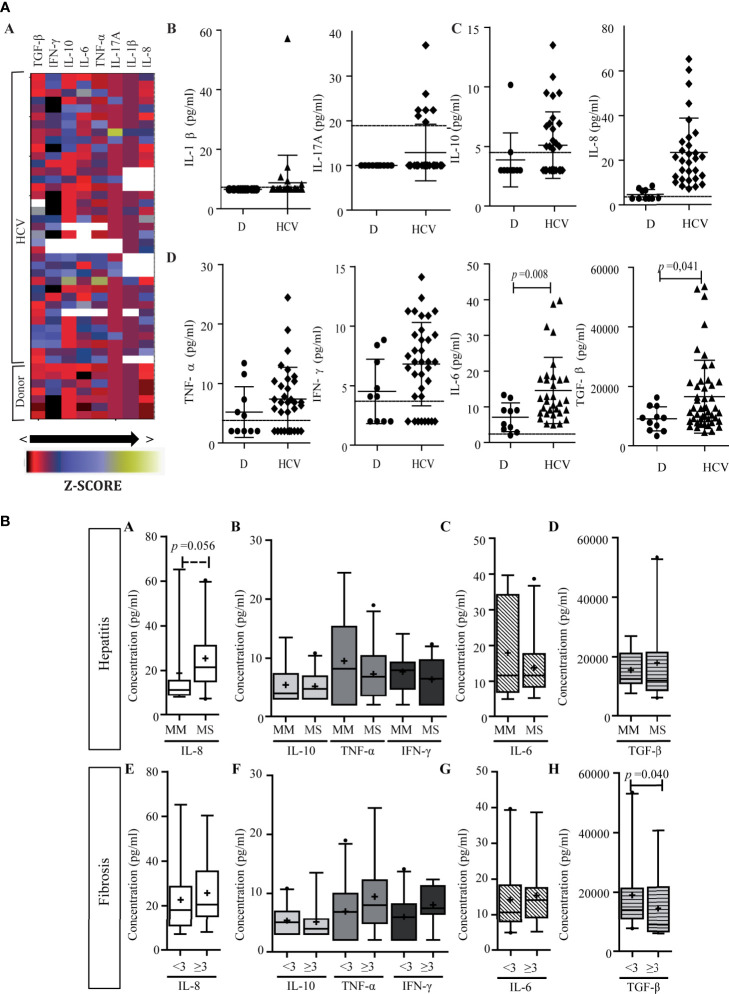
Chronic hepatitis C (CHC) pathogenic mechanisms as well as the participation of the immune response in the generation of liver damage are still a topic of interest. Here, we evaluated immune cell populations and cytokines in the liver and peripheral blood (PB) to elucidate their role in CHC pathogenesis. B, CTL, Th, Treg, Th1, Th17, and NK cell localization and frequency were evaluated on liver biopsies by immunohistochemistry, while frequency, differentiation, and functional status on PB were evaluated by flow cytometry. TNF-α, IL-23, IFN-γ, IL-1β, IL-6, IL-8, IL-17A, IL-21, IL-10, and TGF-β expression levels were quantified in fresh liver biopsy by RT-qPCR and in plasma by CBA/ELISA. Liver CTL and Th1 at the lobular area inversely correlated with viral load (r = -0.469, p =0.003 and r = -0.384, p = 0.040). Treg correlated with CTL and Th1 at the lobular area (r = 0.784, p < 0.0001; r = 0.436, p = 0.013). Th17 correlated with hepatic IL-8 (r = 0.52, p < 0.05), and both were higher in advanced fibrosis cases (Th17 p = 0.0312, IL-8 p = 0.009). Hepatic cytokines were higher in severe hepatitis cases (IL-1β p = 0.026, IL-23 p = 0.031, IL-8 p = 0.002, TGF-β, p= 0.037). Peripheral NK (p = 0.008) and NK dim (p = 0.018) were diminished, while NK bright (p = 0.025) was elevated in patients vs. donors. Naïve Th (p = 0.011) and CTL (p = 0.0007) were decreased, while activated Th (p = 0.0007) and CTL (p = 0.0003) were increased. IFN-γ production and degranulation activity in NK and CTL were normal. Peripheral cytokines showed an altered profile vs. donors, particularly elevated IL-6 (p = 0.008) and TGF-β (p = 0.041). Total hepatic CTLs favored damage. Treg could not prevent fibrogenesis triggered by Th17 and IL-8. Peripheral T-lymphocyte differentiation stage shift, elevated cytokine levels and NK-cell count decrease would contribute to global disease.

Keywords: HCV: Hepatitis C virus; Th17; Treg: regulatory T lymphocytes; chronic liver disease; immunopathogenesis; inflammatory liver infiltrate; peripheral blood.


Conflict of interest statement

The authors declare that the research was conducted in the absence of any commercial or financial relationships that could be construed as a potential conflict of interest.

Figures

Figure 1
Figure 1
Immunostaining of NS3 and liver infiltrating lymphocyte populations on formalin-fixed paraffin embedded liver biopsies. Representative images of NS3+ hepatocytes (A, B), CD20+ (C, D), CD8+ (E, F), CD56+ (G, H), CD4+ (I, J), Tbet+ (K, L), Foxp3+ (M, N) and IL-17A+ (O, P) lymphocytes. Portal–periportal tract (A, C, E, G, I, K, M, O) and lobular area (B, D, F, H, J, L, N, P).
Figure 2
Figure 2
(A) Relationship between viral load and frequency of both lobular CTL and Th1. Correlation between viral load and the frequency of lobular CTL (a) and Th1 (b). (B) Relationship between Treg lymphocytes with both CTL and Th1. Correlation between the frequency of Treg with CTL (a) and Th1 (b) at portal-periportal area. Correlation between the frequency of Treg with CTL (c) and Th1 (d) at lobular area. Spearman’s nonparametric correlation was used to compare these data sets.
Figure 3
Figure 3
Relationship between intrahepatic infiltrate and liver damage. Portal–periportal cell population frequencies related to hepatitis (A–C) and fibrosis severity (D–F). Lobular cell population frequencies related to hepatitis (G, H) and fibrosis severity (I, J). Th, CTL, B lymphocytes and NK cell (A, D, G, I); Th subpopulation (B, E, H, J); and total portal lymphocytes (C, F). MM, minimal–mild; MS, moderate–severe hepatitis. Advanced fibrosis (F≥3) according to METAVIR. The results are depicted in box plots. Horizontal lines within boxes indicate medians. Horizontal lines outside the boxes represent the 5 and 95 percentiles. Mean is indicated as +. Mann–Whitney U test was used to compare all data sets, except for portal–periportal CTL, B, Th1, and Treg cells vs. hepatitis severity, and CTL and B cell vs. fibrosis severity for which Student’s t-test was applied.
Figure 4
Figure 4
Liver cytokine expression level. (A) Heat map of liver cytokine expression level (a). Each row corresponds to the cytokine indicated at the top, and each column represents one case. The data are normalized, and the results are expressed as a Z-score (Xi-/SD), which is assigned a color scale that goes from black (lowest values) to yellow (highest values). The white boxes correspond to the cases without data. Correlation matrix of cytokines (b) and correlation matrix between infiltrate cell populations and intrahepatic cytokine levels (c). (b, c) are schematic representation: the numbers inside the boxes indicate the Spearman correlation coefficients (r) only for those pairs of cytokines that show statistical significance (p < 0.05). The squares inside the boxes graphically represent the value of r: the light blue color indicates r values between 0 and 1 (positive correlation), and the red color indicates values between −1 and 0 (negative correlation), while its size increases as r increases towards values close to |1|. -P, portal–periportal; -L, lobular. Panel (B) Relationship between intrahepatic cytokine levels and liver damage. Expression levels of intrahepatic cytokines in relation to hepatitis (a) and fibrosis (b) severity. MM, minimal–mild; MS, moderate–severe hepatitis. Advanced fibrosis (F≥3) according to METAVIR. The results are depicted in box plots. Horizontal lines within boxes indicate medians. Horizontal lines outside the boxes represent the 5 and 95 percentiles. Mean is indicated as +. FC, fold change. Mann–Whitney U test was used to compare all data sets, except for IL-1β and IL-23 vs. hepatitis severity for which Student’s t-test was applied.
Figure 5
Figure 5
T lymphocyte differentiation and functional characterization of NK cells. (A) Comparison of lymphocytes differentiation stages between donors and patients. Th (a) and CTL (b). Results are expressed as percentage values. N, naïve; CM, central memory; EM, effector memory; E, effector; A, activated. Student’s t-test was used to compare all data sets except for naïve Th and activated Th, and effector CTL for which Mann–Whitney U test was applied. Panel (B) IFN-γ production capacity (a, b) and degranulation activity of NK cells (c–h). IFN-γ production of NK cells in patients and donors (a, b). Percentage values (a), and intensity of expression (b). CD107a expression in total NK cells in percentage values (c–e) and in intensity of expression (f–h). Comparison of the response between basal conditions and before the stimulus per case in donors (c and f) and in patients (d, g). Comparison of basal CD107a expression in total NK cells, stimulated and magnitude of response (delta) between donor vs. patient (e and h). Results are expressed as percentage values (c–e) and intensity of expression (f–h). D, donor. When it corresponds, the results are depicted in box plots. Horizontal lines within boxes indicate medians. Horizontal lines outside the boxes represent the 5 and 95 percentiles. Mean is indicated as +. Mann–Whitney U test (a, b, e, h) and Wilcoxon test (c, d, f, g) were used to compare all data sets. The analysis of absolute values displayed similar results to the percentage values, but it is not shown to simplify their visualization.
Figure 6
Figure 6
Functional characterization of CTLs. IFN-γ production capacity (A, B) and degranulation activity of CTLs (C–H). IFN-γ production of CTLs in patients and donors (A, B). Percentage values (A) and intensity of expression (B). CD107a expression in CTLs in percentage values (C–E) and in intensity of expression (F–H). Comparison of the response between basal conditions and before the stimulus per case in donors (C, F) and in patients (D, G). Comparison of CD107a basal expression in CTLs, stimulated and magnitude of response (delta) between donor vs. patient (E, H). Results are expressed as percentage values (C–E) and intensity of expression (F–H). D, donor. When it corresponds, the results are depicted in box plots. Horizontal lines within boxes indicate medians. Horizontal lines outside the boxes represent the 5 and 95 percentiles. Mean is indicated as +. Student’s t-test (A, E), Wilcoxon test (C, D, G), paired t-test (F) and Mann–Whitney U test (B, H) were used to compare different data sets. The analysis of absolute values displayed similar results to the percentage values, but it is not shown to simplify their visualization.
Figure 7
Figure 7
Peripheral cytokine level. (A) Heat map of peripheral cytokine expression levels (a) and comparison of circulating cytokine levels between patients and donors (b–d). (a) Each row corresponds to the cytokine indicated at the top, and each column represents one case. The data are normalized, and the results are expressed as a Z-score (Xi-/SD), which is assigned a color scale from black (lowest values) to yellow (highest values). The white boxes correspond to the cases without data. (b–d) Cytokine levels in patients and donors: IL-1β and IL-17A (b), IL-10 and IL-8 (c), and TNF-α, IFN-γ, IL-6, and TGF-β (d). D donor. Results are plotted on dot diagrams, the middle horizontal line indicates the mean, and the outer horizontal lines represent the SD. Mann–Whitney U test was used to compare data sets. (B) Relationship between circulating cytokine levels and liver damage. Circulating levels of cytokines in relation to hepatitis (a–d) and fibrosis (e–h) severity. MM, minimal–mild; MS, moderate–severe hepatitis. Advanced fibrosis (F≥3) according to METAVIR. The results are depicted in box plots. Horizontal lines within boxes indicate medians. Horizontal lines outside the boxes represent the 5 and 95 percentiles. Mean is indicated as +. Mann–Whitney U test was used to compare data sets.

References

    1. Alanio C., Nicoli F., Sultanik P., Flecken T., Perot B., Duffy D., et al. . (2015). Bystander Hyperactivation of Preimmune CD8+ T Cells in Chronic HCV Patients. Elife 4, e07916. 10.7554/eLife.07916 - DOI - PMC - PubMed
    1. Alter G., Malenfant J. M., Altfeld M. (2004). CD107a as a Functional Marker for the Identification of Natural Killer Cell Activity. J. Immunol. Methods 294, 15–22. 10.1016/j.jim.2004.08.008 - DOI - PubMed
    1. Barjon C., Dahlqvist G., Calmus Y., Conti F. (2015). Role of Regulatory T-Cells During Hepatitis C Infection: From the Acute Phase to Post-Transplantation Recurrence. Dig. Liver. Dis. 47, 913–917. 10.1016/j.dld.2015.06.014 - DOI - PubMed
    1. Betts M. R., Brenchley J. M., Price D. A., De Rosa S. C., Douek D. C., Roederer M., et al. . (2003). Sensitive and Viable Identification of Antigen-Specific CD8+ T Cells by a Flow Cytometric Assay for Degranulation. J. Immunol. Methods 281, 65–78. 10.1016/S0022-1759(03)00265-5 - DOI - PubMed
    1. Bonorino P., Ramzan M., Camous X., Dufeu-Duchesne T., Thelu M. A., Sturm N., et al. . (2009). Fine Characterization of Intrahepatic NK Cells Expressing Natural Killer Receptors in Chronic Hepatitis B and C. J. Hepatol. 51, 458–467. 10.1016/j.jhep.2009.05.030 - DOI - PubMed

Publication types

LinkOut - more resources