. 2020 Jun;1(6):589-602.
doi: 10.1038/s43018-020-0071-1. Epub 2020 Jun 8.

Keap1 mutation renders lung adenocarcinomas dependent on Slc33a1

Affiliations

Keap1 mutation renders lung adenocarcinomas dependent on Slc33a1

Rodrigo Romero et al. Nat Cancer. 2020 Jun.

Erratum in

  • Publisher Correction: Keap1 mutation renders lung adenocarcinomas dependent on Slc33a1.
    Romero R, Sánchez-Rivera FJ, Westcott PMK, Mercer KL, Bhutkar A, Muir A, González Robles TJ, Rodríguez SL, Liao LZ, Ng SR, Li L, Colón CI, Naranjo S, Beytagh MC, Lewis CA, Hsu PP, Bronson RT, Vander Heiden MG, Jacks T. Romero R, et al. Nat Cancer. 2020 Sep;1(9):935. doi: 10.1038/s43018-020-00118-z. Nat Cancer. 2020. PMID: 35121957 No abstract available.

Abstract

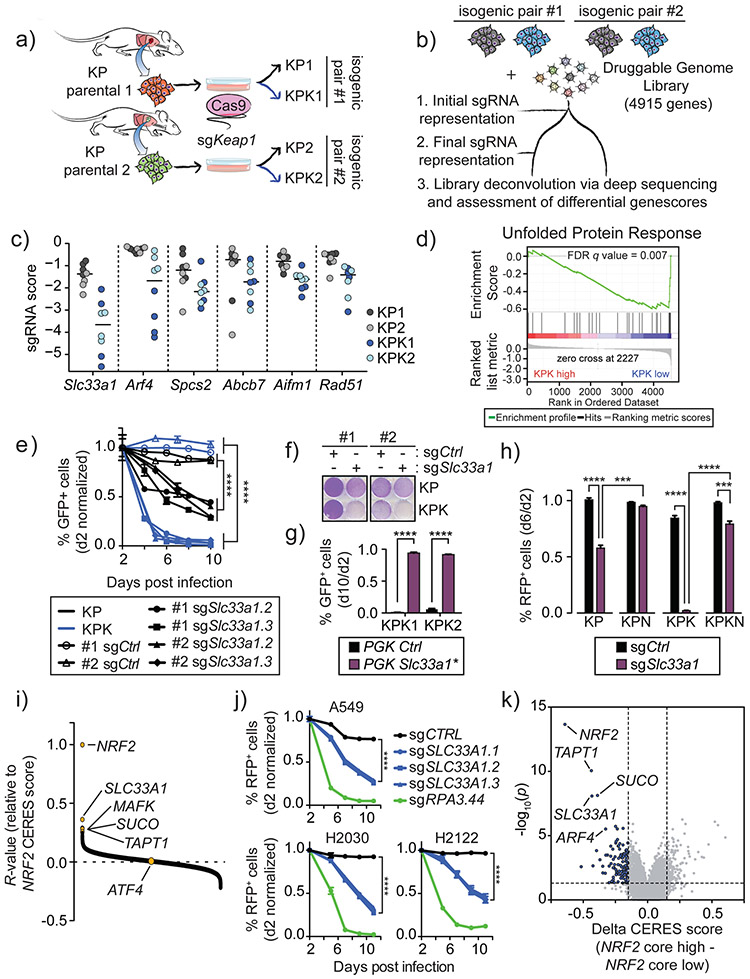
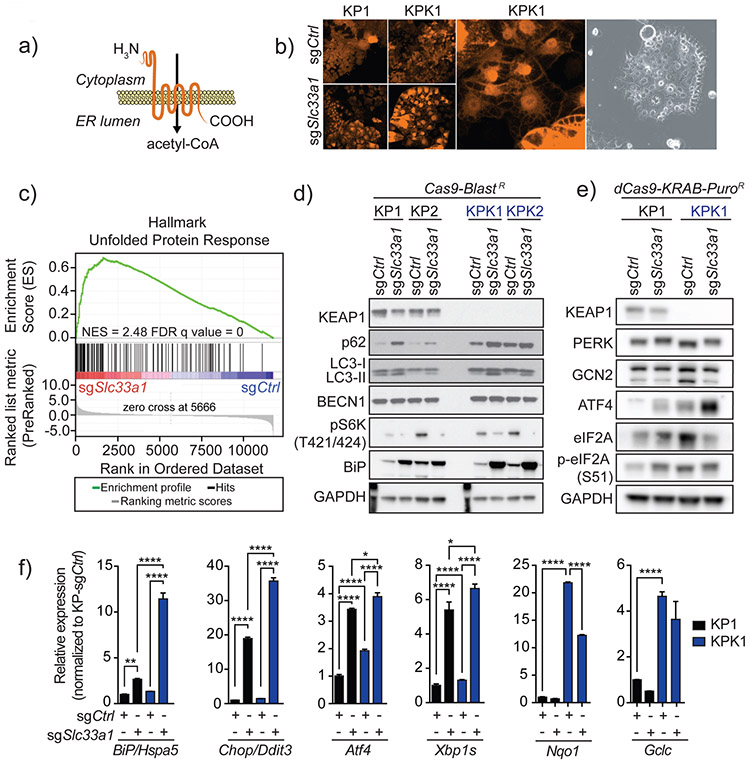
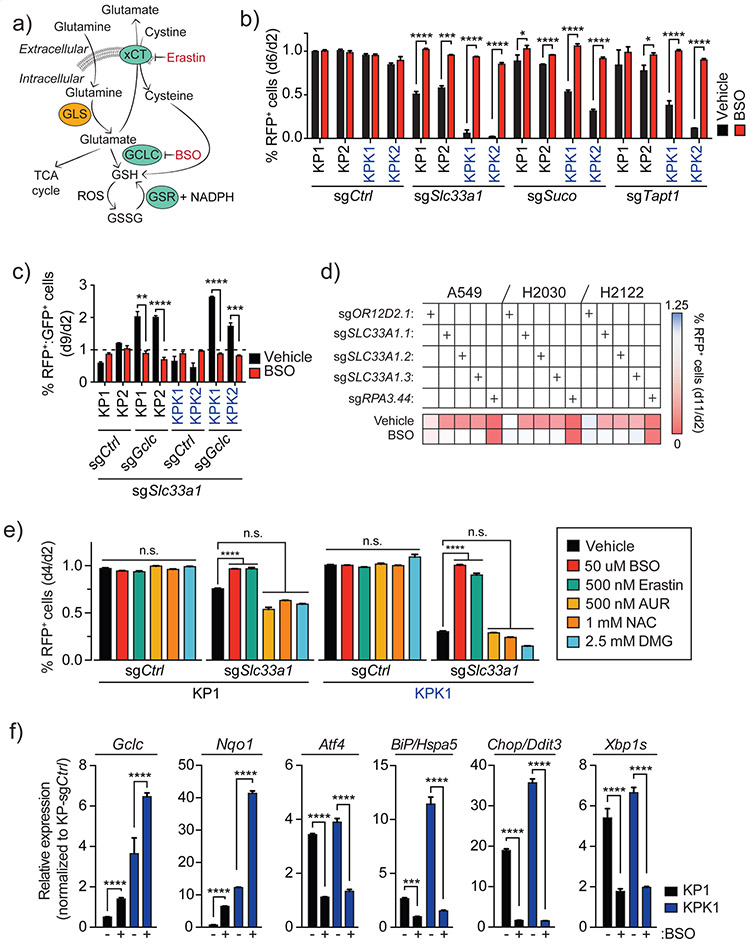
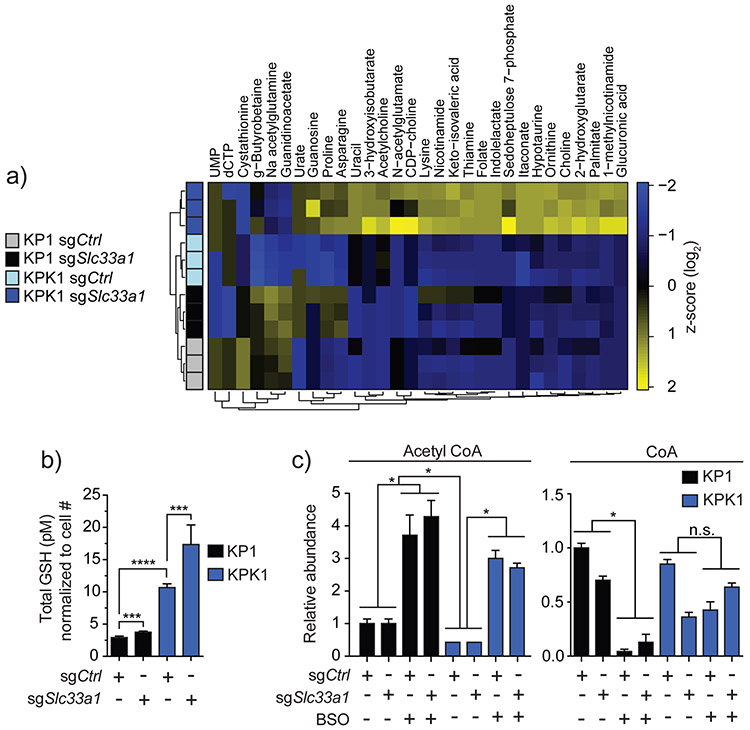
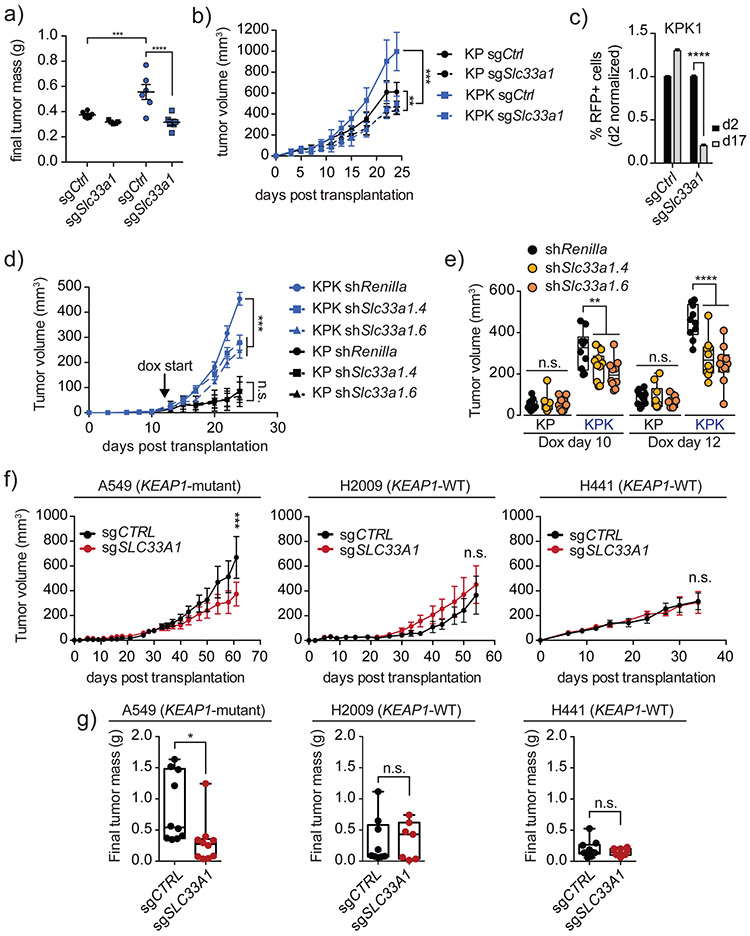
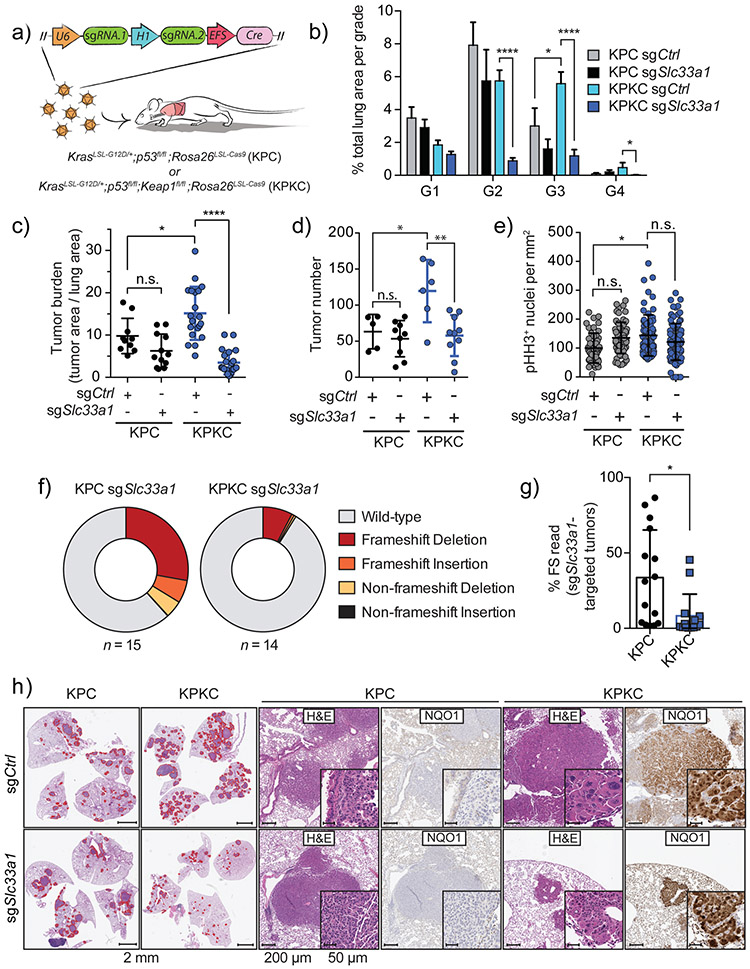
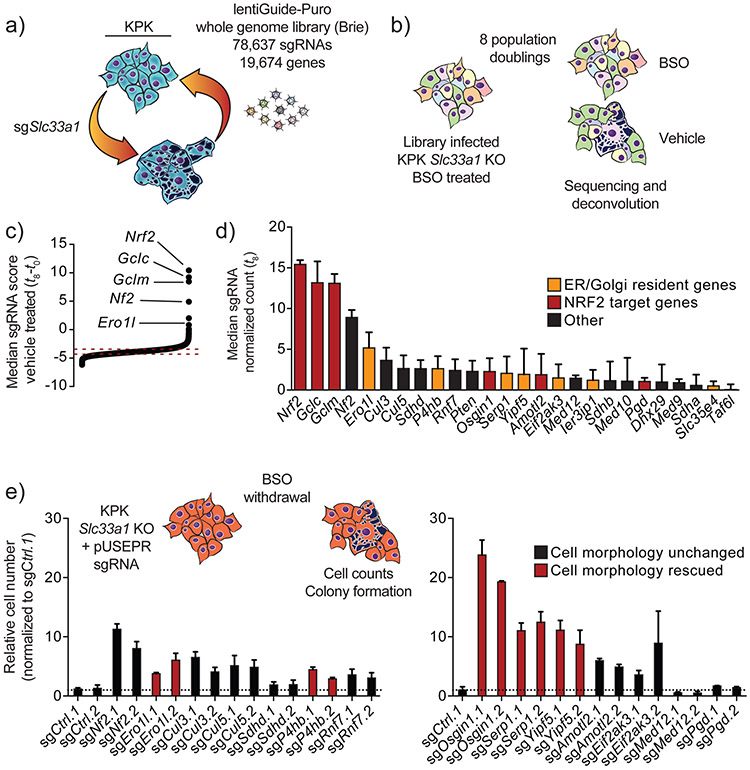
Approximately 20-30% of human lung adenocarcinomas (LUAD) harbor loss-of-function (LOF) mutations in Kelch-like ECH Associated-Protein 1 (KEAP1), which lead to hyperactivation of the nuclear factor, erythroid 2-like 2 (NRF2) antioxidant pathway and correlate with poor prognosis1-3. We previously showed that Keap1 mutation accelerates KRAS-driven LUAD and produces a marked dependency on glutaminolysis4. To extend the investigation of genetic dependencies in the context of Keap1 mutation, we performed a druggable genome CRISPR-Cas9 screen in Keap1-mutant cells. This analysis uncovered a profound Keap1 mutant-specific dependency on solute carrier family 33 member 1 (Slc33a1), an endomembrane-associated protein with roles in autophagy regulation5, as well as a series of functionally-related genes implicated in the unfolded protein response. Targeted genetic and biochemical experiments using mouse and human Keap1-mutant tumor lines, as well as preclinical genetically-engineered mouse models (GEMMs) of LUAD, validate Slc33a1 as a robust Keap1-mutant-specific dependency. Furthermore, unbiased genome-wide CRISPR screening identified additional genes related to Slc33a1 dependency. Overall, our study provides a strong rationale for stratification of patients harboring KEAP1-mutant or NRF2-hyperactivated tumors as likely responders to targeted SLC33A1 inhibition and underscores the value of integrating functional genetic approaches with GEMMs to identify and validate genotype-specific therapeutic targets.


Conflict of interest statement

Declaration of Interest: T.J. is a member of the Board of Directors of Amgen and Thermo Fisher Scientific. He is also a co-Founder of Dragonfly Therapeutics and T2 Biosystems. T.J. serves on the Scientific Advisory Board of Dragonfly Therapeutics, SQZ Biotech, and Skyhawk Therapeutics. None of these affiliations represent a conflict of interest with respect to the design or execution of this study or interpretation of data presented in this manuscript. T.J. laboratory currently also receives funding from the Johnson & Johnson Lung Cancer Initiative, but this funding did not support the research described in this manuscript. This work was supported by the Howard Hughes Medical Institute and Calico Life Sciences LLC.

Figures

Figure 1:
Figure 1:. A genetic screen for Keap1-deficient genetic vulnerabilities yields Slc33a1 as a potent dependency
(a) A schematic for the generation of two isogenic cell line pairs. Plucked tumors from two individual KP mice were used to generate parental KP tumor-derived cell lines. Each parental line was transfected in vitro with plasmids containing sgKeap1, Cas9 and GFP. Transfected lines were single cell sorted and validated for deficiency (KPK) or maintenance of two wild-type Keap1 alleles (KP). (b) CRISPR-Cas9 based screening strategy designed to identify Keap1-deficient genetic vulnerabilities. Two isogenic KP and KPK cell line pairs were infected with a Druggable Genome Library (DGL). Genomic DNA was collected at initial time points (t0) and after 8 population doublings (t8). (c) Top common differentially depleted genes between each isogenic pair. Each dot represents the log2 fold change of each sgRNA (sgRNA score) targeting the indicating gene (4 sgRNAs per gene). Bar represents median gene score across all sgRNAs targeting the indicated gene per genotype. (d) Gene set enrichment analysis of the rank ordered differential gene scores across the entire DGL of isogenic pair 1. (e) Fluorescence competition assays of wild-type versus sgCtrl or sgSlc33a1 cells in KP and KPK isogenic cell lines. Plot displays day 2 normalized %GFP+ (pUSPmNG) cells marking sgCtrl or sgSlc33a1 edited cells (mean ± SD; n = 3; n denotes technical replicate infections). Statistics derived from the comparison of the average KP- or KPK-sgCtrl values versus the average KP- or KPK-sgSlc33a1 values across all Slc33a1 targeting sgRNAs. (f) Colony formation of KP and KPK isogenic cells targeted with sgCtrl or sgSlc33a1 (pUSEPR). (g) Overexpression of an sgRNA mutant-Slc33a1 cDNA (*) or control cDNA (mScarlet) in both KPK cell lines. Plot displays %GFP+ (pUSPmNG) cells 10 days post infection relative to day 2 (mean ± SD; n = 3; n denotes technical replicate infections). (h) Fluorescence competition assays of KP, KP-Nrf2 KO (KPN), KPK, KPK-Nrf2 KO (KPKN) isogenic pairs. Plot displays %RFP+ (pUSEPR) cells marking sgCtrl or sgSlc33a1 infected cells 6 days post infection relative to day 2 (mean ± SD; n = 3; n denotes technical replicate infections). (i) Waterfall plot of the rank ordered Pearson correlation coefficient between NRF2 CERES scores versus all genes screened from the DepMap database version 19Q2. (j) Fluorescence competition assay on a panel of KEAP1-mutant human LUAD cell lines. Plot displays day 2 normalized %RFP+ (pUSEPR) cells marking sgCTRL, sgSLC33A1, or sgRPA3 infected cells (mean ± SD; n = 3; n denotes technical replicate infections). Statistics derived from the comparison of the sgCTRL values versus the average sgSLC33A1 values across all SLC33A1 targeting sgRNAs. (k) Differential CERES scores between core NRF2 core gene set high-ranking cell lines (n = 42) versus low-ranking cell lines (n = 32) from the DepMap database 19Q2. Horizontal dotted line represents p-value significance cut-off of p<0.05. Each dot represents the differential CERES score per gene. Blue dots represent genes that pass all set threshold values. Statistical analyses were performed using two-way ANOVA in (e) and (j) with Tukey’s post-hoc multiple comparisons test. Student’s two-tailed t-test was performed for (g), (h) and (k).
Figure 2:
Figure 2:. Loss of Slc33a1 promotes the activation of an unfolded protein response
(a) Schematic of the reported function of SLC33A1. (b) Confocal images of cytoplasmic-tagRFP (pUSEPR; see methods) labeled isogenic pair #1 infected with sgCtrl or sgSlc33a1. Larger picture denotes increase magnification of KPK1-sgSlc33a1 cells. Far right: Phase contrast microscopy of KPK-Slc33a1 cells. (c) GSEA enrichment plot of the Hallmark UPR signature enriched in sgSlc33a1 targeted cells compared to sgCtrl targeted cells. (d) Western blot analysis of Cas9 expressing KP and KPK isogenic pairs targeted with sgCtrl or sgSlc33a1 for autophagy and UPR protein markers. (e) Western blot analysis of dCas9-KRAB expressing KP and KPK isogenic pairs targeted with sgCtrl or sgSlc33a1 for autophagy and UPR protein markers. (f) qPCR validation of UPR and NRF2 target genes in Cas9 expressing isogenic pair #1 targeted with sgCtrl or sgSlc33a1. (mean ± SD; n = 4; n denotes technical replicates). Statistical analyses were performed using two-way ANOVA in (f) with Tukey’s post-hoc test.
Figure 3:
Figure 3:. Loss of Slc33a1 is rescued by inhibiting glutathione synthesis
(a) Schematic of the biosynthetic pathways contributing to GSH synthesis. Enzymes marked in blue circles are direct NRF2 target genes. Small molecule inhibitors are denoted by red font. (b) Fluorescence competition assay in KP and KPK isogenic cell lines infected with pUSEPR lentiviruses expressing sgCtrl, sgSlc33a1, sgSuco, or sgTapt1. All cell and sgRNA combinations are treated with vehicle or 50 uM BSO. Relative %RFP is normalized to %RFP at day 2 post infection. Statistics are derived as the mean ± SD; n = 3; n denotes technical replicate infections. (c) Fluorescence competition assay of RFP+-Slc33a1-deficient cells (pUSEPR) targeted with sgCtrl or sgGclc containing pUSPmNG lentiviral vectors. Double positive %RFP:GFP values normalized to day 2 %RFP:GFP values. Cells were treated with vehicle or 50 uM BSO (mean ± SD; n = 3; n denotes technical replicate infections). (d) Heat map of fluorescence competition assays in KEAP1-mutant human LUAD cell lines (pUSEPR) treated with vehicle or 50 uM BSO. Data normalization as in (b). Each block is derived as the mean ± SD; n = 3; n denotes technical replicate infections. (e) Day 2 normalized %RFP (pUSEPR) marked cells in a fluorescence competition assay targeted with sgCtrl or sgSlc33a1. Cells were treated with vehicle, 50 uM BSO, 500 nM Erastin, 500 nM Auronafin, 1 mM NAC, or 2.5 mM DMG (mean ± SD; n = 3; n denotes technical replicate infections and treatment). (f) qPCR validation of UPR and NRF2 target genes in isogenic pair #1 targeted with sgCtrl or sgSlc33a1. (mean ± SD; n = 4; n denotes technical replicates). Cells were treated with vehicle or 50 uM BSO for 48 hours post infection. Statistical analyses were performed using student’s two-tailed t-test in (b) and (c) and two-way ANOVA in (e) and (f) with Tukey’s multiple comparisons test. All error bars denote standard deviation.
Figure 4:
Figure 4:. Slc33a1 loss results in metabolic rewiring
(a) Unsupervised clustering of significantly differentially detectable polar metabolites. Each row represents a different metabolite. Each column represents a different sample. Each cell line condition was completed in triplicate. Data is normalized by cell counts for each cell line. (b) GSH concentrations of KP and KPK cells 72 hours post transduction with the above labeled sgRNAs. (c) Acetyl-CoA and CoA relative abundances from data represented in (a). Cells were treated with or without 50 uM BSO for 48 hours. Each cell line condition was completed in triplicate. Data is normalized by cell counts for each cell line. Statistical analyses were performed using Mann-Whitney U-test in (b) and (c).
Figure 5:
Figure 5:. Slc33a1 loss validates as a Keap1-mutant-specific vulnerability in transplant models
a) Final subcutaneous tumor masses obtained from the transplantation of indicated cell lines into immunocompromised mice. b) Subcutaneous tumor volumes of KP and KPK cells transduced with the indicated sgRNAs injected into immunocompromised mice (n = 6 per group). KP sgCtrl vs. KP sgSlc33a1, p = 0.0074. KPK sgCtrl vs. KPK sgSlc33a1, p = 0.0003. c)in vivo fluorescence based competition assay of GFP-labeled KPK cells injected into immunocompromised mice. KPK cells were transduced with pUSEPR constructs containing the indicated sgRNAs. Transduced cells representation was normalized to RFP+ cells at d2 (pre-implantation). (d) Subcutaneous tumor volumes of KP or KPK cells transduced with doxycycline-inducible shRNAs targeting Renilla or Slc33a1 (LVt-TSTOP; see methods). Arrow indicates timepoint at which mice began doxycycline treatment. Error bars denote S.E.M. KPK-shRenilla versus KPK-shSlc33a1 groups p = 0.0006. KP-shRenilla versus KP-shSlc33a1 groups p = 0.8467). (e) Tumor volumes related to (d) at the indicated time points. Day 10: KP, p = 0.9387, KPK, p = 0.0088. Day 12: KP, p = 0.5126, KPK, p < 0.0001. (f) Xenografts of the KEAP1-mutant A549 or KEAP1-wild-type H2009 and H441 human lung cell lines infected with either sgCTRL or sgSLC33A1 lentiviral vectors (pUSEPR). Error bars denote S.E.M. A549 (n = 10 per group): p<0.001. H2009 (n = 9 sgCTRL; n = 10 sgSLC33A1): p = 0.292, H441 (n = 10 sgCTRL; n = 10 sgSLC33A1): p = 0.842. (g) Final subcutaneous tumor masses obtained from xenografts of indicated cell lines into immunocompromised mice. A549 (n = 10 sgCTRL; n = 10 sgSLC33A1): p<0.0190. H2009 (n = 9 sgCTRL; n = 7 sgSLC33A1): p<0.8805. H441 (n = 10 sgCTRL; n = 10 sgSLC33A1): p<0.3061. Statistics obtained by: Student’s two-tailed t-test in (a), (c), and (g). Two-way ANOVA with Sidak’s multiple comparisons testing in (b), and (f). Two-way ANOVA with Dunnet’s multiple comparisons testing in (d). One-way ANOVA with Dunnet’s multiple comparisons testing in (e).
Figure 6:
Figure 6:. Keap1-deficient tumors harbor an increased dependency for Slc33a1 in an autochthonous model of murine lung adenocarcinoma
(a) Schematic representation of KrasLSL-G12D/+; p53fl/fl; Rosa26LSL-Cas9 (KPC) or KrasLSL-G12D/+; p53fl/fl; Keap1fl/fl; Rosa26LSL-Cas9 (KPKC) mice intratracheally infected with pUSEC lentiviruses containing dual sgRNAs targeting Slc33a1 or Olfr102 (sgCtrl). (b) Distribution of histological tumor grades (G1-G4) in KPC or KPKC mice 20 weeks after infection with pUSEC lentiviruses expressing control (sgCtrl, KPC, n = 10 mice; KPKC, n = 20 mice) or sgSlc33a1 (KPC, n = 12 mice; KPKC, n = 22 mice). Error bars denote S.E.M. (KP-sgCtrl versus KPK-sgCtrl p = 0.049; KPK-sgCtrl versus KPK-sgSlc33a1 G2 p = 8.2e-9; KPK-sgCtrl versus KPK-sgSlc33a1 G3 p = 2.81e-6; KPK-sgCtrl versus KPK-sgSlc33a1 G4 p = 0.025). (c) Combined quantification of tumor burden (total tumor area/total lung area) in KPC or KPKC mice after infection with pUSEC lentiviruses. Mouse numbers equivalent to (b). (KP-sgCtrl versus KP-sgCtrl p = 0.08; KP-sgCtrl versus KPK-sgCtrl p = 0.029; KPK-sgCtrl versus KPK-sgSlc33a1 p = 5.9e-7). (d) Combined quantification of average tumor number in KPC or KPKC mice after infection with pUSEC lentiviruses. (e) Quantification of phosphorylated histone H3 (pHH3)-positive nuclei per squared millimeter of tumor for assessment of the mitotic index of tumor cells from lung tumors in KPC or KPKC mice at 20 weeks after infection with the indicated pUSEC lentivirus. (f) Fraction of mutant and wild-type reads within individually plucked tumors from 20-week pUSEC-sgSlc33a1 lentiviral infected KPC (mean of n = 15 tumors from 7 mice) and KPKC mice (mean of n = 14 tumors from 7 mice). (g) Mean number of frameshift (FS) reads from USEC-sgSlc33a1 lentiviral infected KPC (mean of n = 15 tumors from 7 mice) and KPKC mice (mean of n = 14 tumors from 7 mice) * P = 0.0102. (h) Representative H&E and IHC staining of serial sections from lung tumors of KPC or KPKC mice 20 weeks after infection with pUSEC-sgCtrl (top) or pUSEC-sgSlc33a1 (bottom). First panels (KPC mice), overall lung tumor burden (scale bar = 2mm). Second panels, higher magnification H&E staining of representative tumors (scale bar = 100 um; insets depict higher-magnification images, scale bar = 50 um). Third panels, representative IHC staining for NRF2 target gene, NQO1. This is repeated for KPKC mice. Statistical analyses were performed using Mann-Whitney U-test with Holm’s multiple comparisons correction used in (b-e). Student’s two-tailed t-test was performed for (g).
Figure 7:
Figure 7:. Genome-wide CRISPR screen identifies suppressors of Slc33a1 deficiency
(a) Schematic of the screen conditions. KPK-Slc33a1 knockout cells were generated and infected with the Brie library to identify hits that would rescue Slc33a1 dependency. (b) Schematic representing screen conditions. KPK-Slc33a1 knockout cells were infected with Brie library in the presence of BSO and subsequently placed in BSO or vehicle treated conditions for 8 cumulative population doublings. (c) Ranked median gene scores of genes in the Brie library that passed all thresholds (see methods). Dotted lines represent the spread of the control sgRNAs and mark the 25th and 75th gene score percentile boundaries. (d) Waterfall plot of the normalized median sgRNA counts across all technical replicates at t8. The median is plotted and the error bars denote the range of the data. (e) Above: denotes the schematic for the validation pipeline. Below: Relative cell numbers post infection with pUSEPR vectors expressing the indicated sgRNA. Cell morphology related to Supplementary Fig. 13a.

Comment in

  • Keap1ing an eye on Slc33A1.
    Gilbert LA. Gilbert LA. Nat Cancer. 2020 Jun;1(6):575-576. doi: 10.1038/s43018-020-0072-0. Nat Cancer. 2020. PMID: 35121976 No abstract available.

References

    1. Shen R et al.Harnessing Clinical Sequencing Data for Survival Stratification of Patients With Metastatic Lung Adenocarcinomas. JCO Precis. Oncol 1–9 (2019). - PMC - PubMed
    1. Jaramillo MC & Zhang DD The emerging role of the Nrf2-Keap1 signaling pathway in cancer. Genes Dev. 27, 2179–2191 (2013). - PMC - PubMed
    1. LUAD TCGA et al.Comprehensive molecular profiling of lung adenocarcinoma. Nature 511, 543–550 (2014). - PMC - PubMed
    1. Romero R et al.Keap1 loss promotes Kras-driven lung cancer and results in dependence on glutaminolysis. Nat. Med. 23, 1362–1368 (2017). - PMC - PubMed
    1. Jonas MC, Pehar M & Puglielli L AT-1 is the ER membrane acetyl-CoA transporter and is essential for cell viability. J. Cell Sci 123, 3378–3388 (2010). - PMC - PubMed

Publication types