. 2021 Sep 10;2(9):1072-1092.e7.
doi: 10.1016/j.medj.2021.08.002. Epub 2021 Aug 14.

A monocyte/dendritic cell molecular signature of SARS-CoV-2-related multisystem inflammatory syndrome in children with severe myocarditis

Affiliations

A monocyte/dendritic cell molecular signature of SARS-CoV-2-related multisystem inflammatory syndrome in children with severe myocarditis

Camille de Cevins et al. Med. .

Abstract

Background: Severe acute respiratory syndrome coronavirus 2 (SARS-CoV-2) infection in children is generally milder than in adults, but a proportion of cases result in hyperinflammatory conditions often including myocarditis.

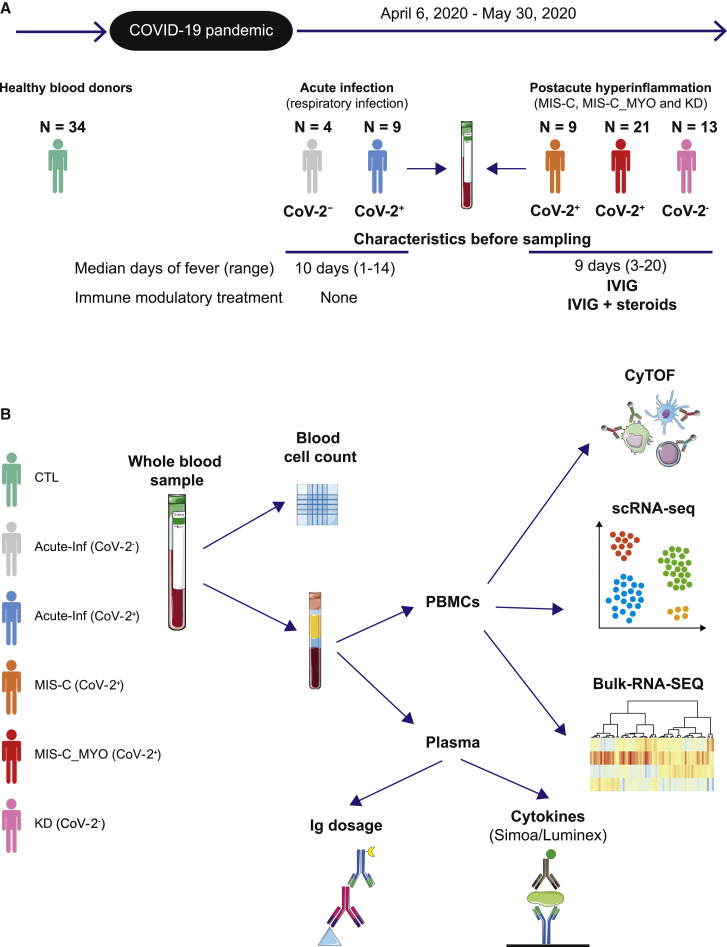
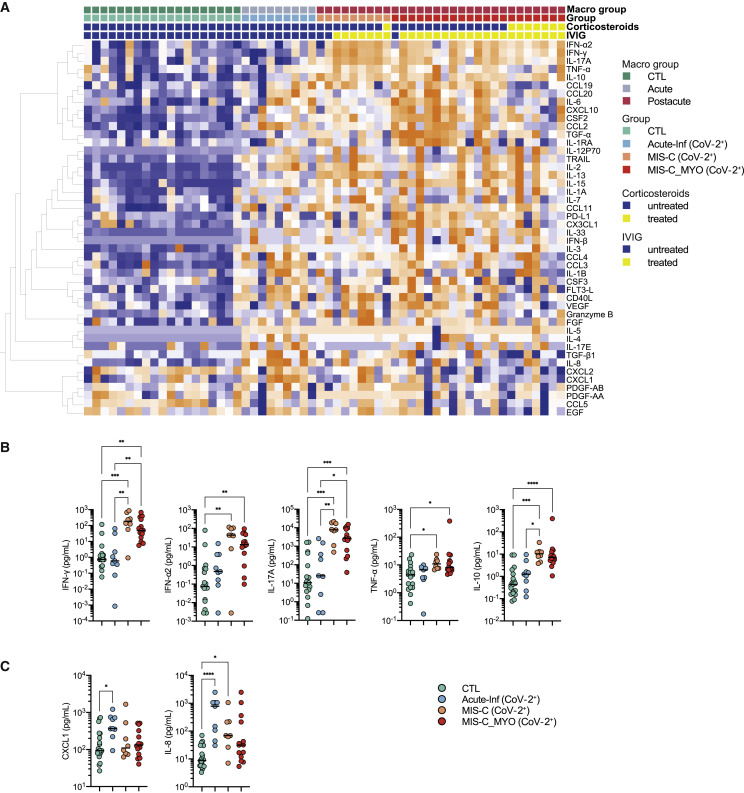
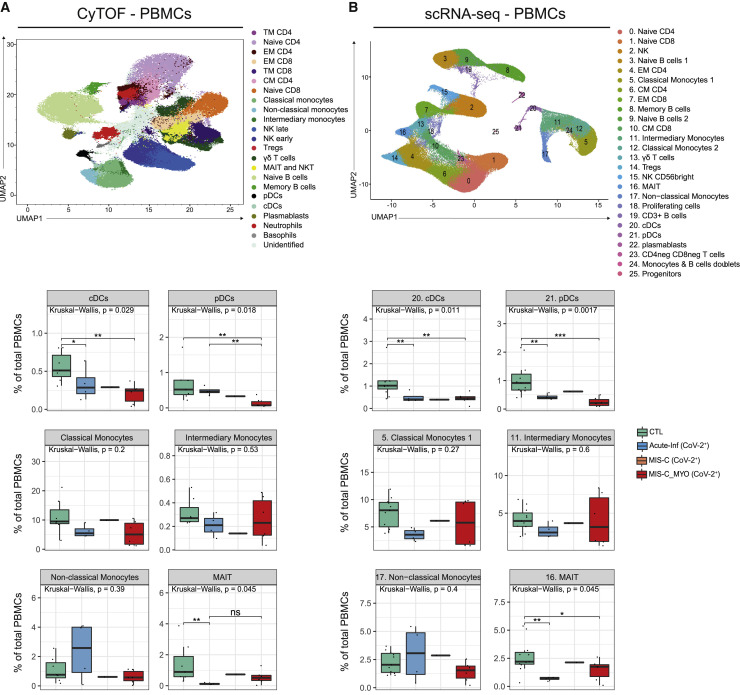
Methods: To better understand these cases, we applied a multiparametric approach to the study of blood cells of 56 children hospitalized with suspicion of SARS-CoV-2 infection. Plasma cytokine and chemokine levels and blood cellular composition were measured, alongside gene expression at the bulk and single-cell levels.

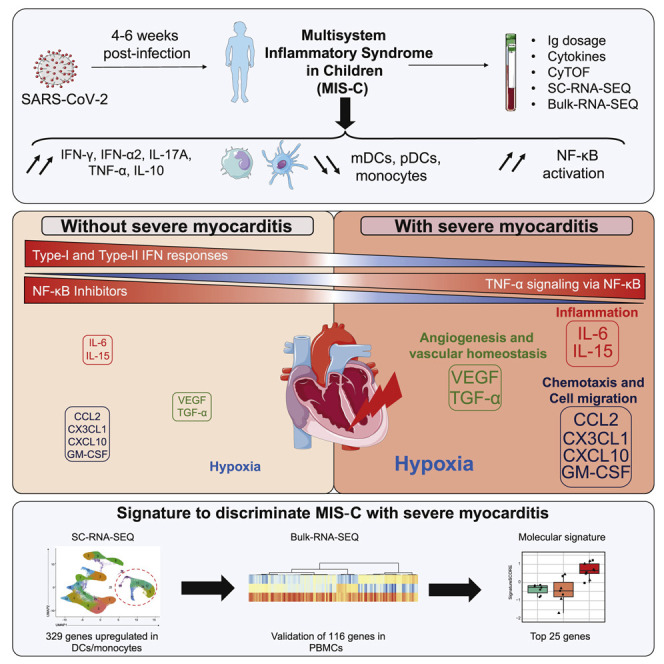
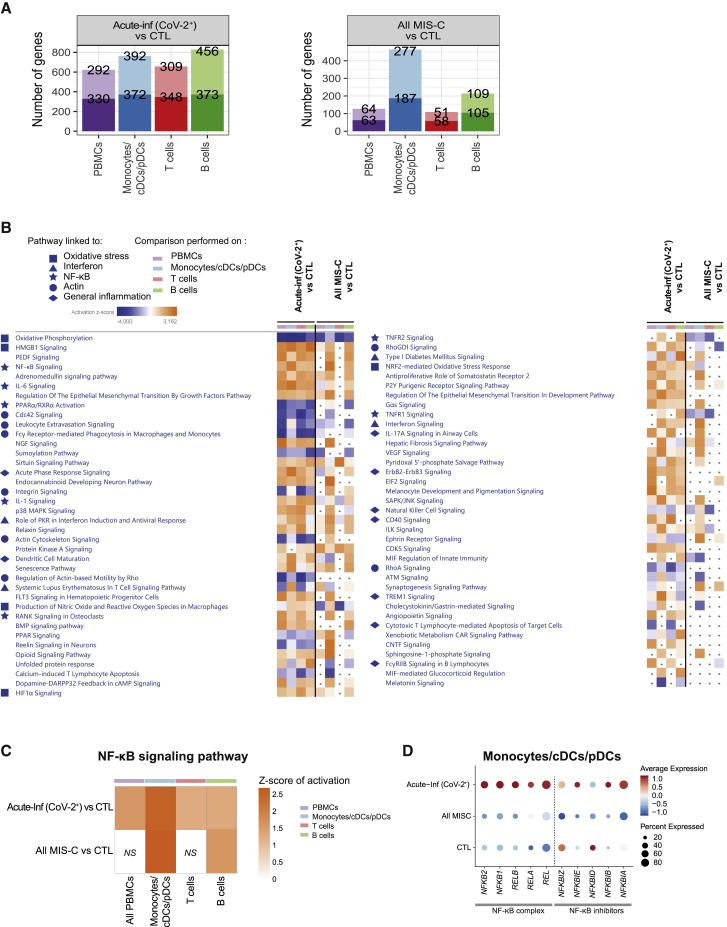
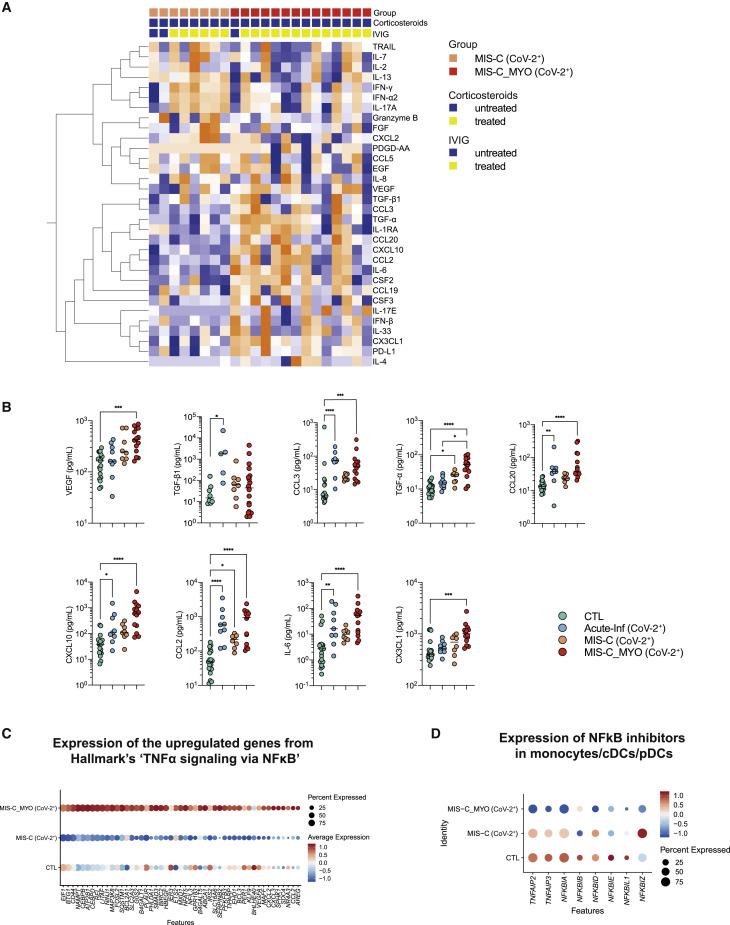
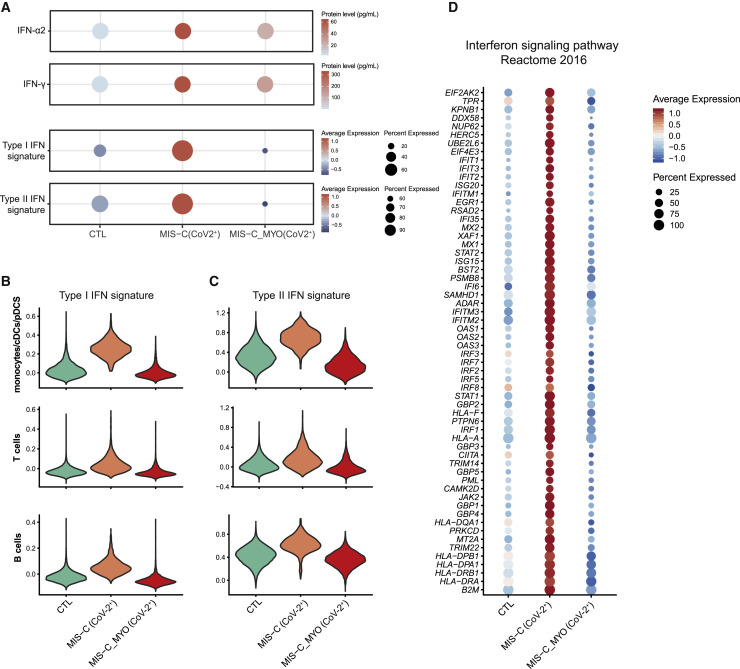
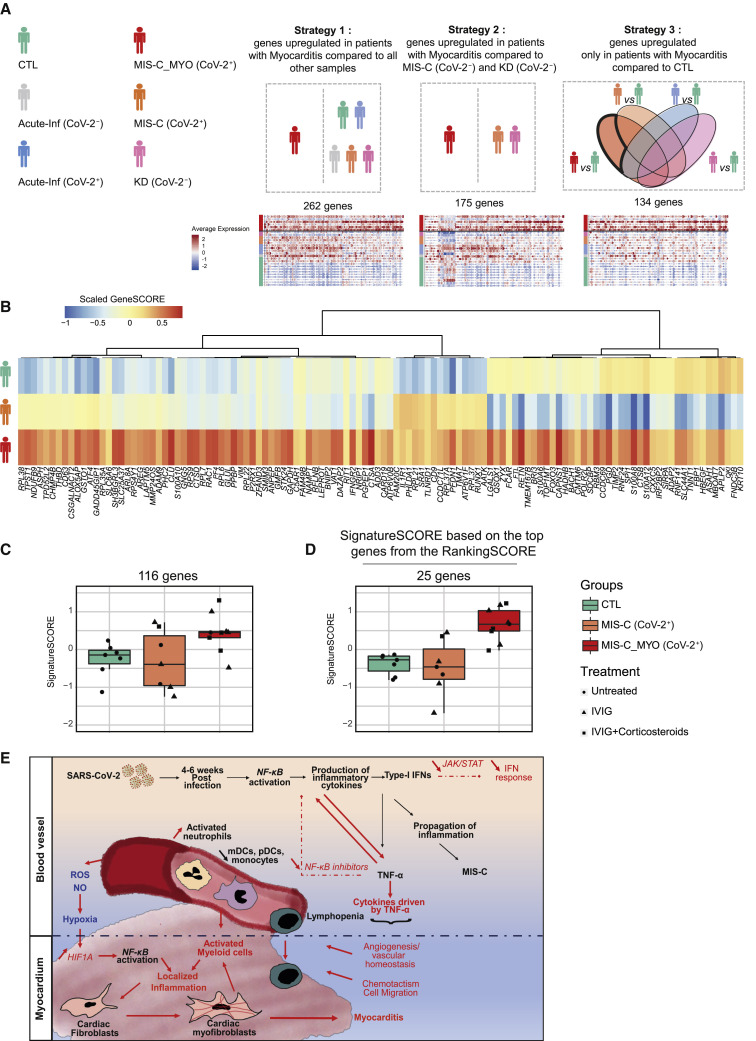
Findings: The most severe forms of multisystem inflammatory syndrome in children (MIS-C) related to SARS-CoV-2 that resulted in myocarditis were characterized by elevated levels of pro-angiogenesis cytokines and several chemokines. Single-cell transcriptomics analyses identified a unique monocyte/dendritic cell gene signature that correlated with the occurrence of severe myocarditis characterized by sustained nuclear factor κB (NF-κB) activity and tumor necrosis factor alpha (TNF-α) signaling and associated with decreased gene expression of NF-κB inhibitors. We also found a weak response to type I and type II interferons, hyperinflammation, and response to oxidative stress related to increased HIF-1α and Vascular endothelial growth factor (VEGF) signaling.

Conclusions: These results provide potential for a better understanding of disease pathophysiology.

Funding: Agence National de la Recherche (Institut Hospitalo-Universitaire Imagine, grant ANR-10-IAHU-01; Recherche Hospitalo-Universitaire, grant ANR-18-RHUS-0010; Laboratoire d'Excellence ''Milieu Intérieur," grant ANR-10-LABX-69-01; ANR-flash Covid19 "AIROCovid" and "CoVarImm"), Institut National de la Santé et de la Recherche Médicale (INSERM), and the "URGENCE COVID-19" fundraising campaign of Institut Pasteur.

Keywords: COVID-19; Kawasaki Disease; MIS-C; PIMS-TS; SARS-CoV-2; TNF-α and NF-κB signaling; lack of responses to type I and type II IFN secretion; myocarditis; scRNA-seq.


Conflict of interest statement

D.D., F.R.-L., J.T., and M.M.M. are listed as inventors on a patent application related to this technology (European Patent Application no. EP21305197, entitled “Methods of predicting multisystem inflammatory syndrome [MIS-C] with severe myocarditis in subjects suffering from a SARS-CoV-2 infection”).

Figures

None
Graphical abstract
Figure 1
Figure 1
Timeline and experimental designs (A) Timeline depicting when the different groups of children were enrolled. (B) Description of the different types of analyses performed on whole blood samples, peripheral blood mononuclear cells (PBMCs), and plasma. CyTOF: mass cytometry (cytometry by time of flight). scRNA-seq: single-cell RNA sequencing; Simoa: single-molecule array, digital ELISA; Luminex: cytokine bead array assays; Ig dosage: quantification of SARS-CoV-2-specific immunoglobulins; Control (CTL): healthy donors, green; Acute-Inf (CoV-2): individuals with acute respiratory infection but no evidence of SARS-CoV-2 infection, gray; Acute-Inf (CoV-2+): individuals with acute respiratory infection and evidence of SARS-CoV-2 infection, blue; MIS-C (CoV-2+): individuals with postacute multi-inflammatory syndrome and evidence of SARS-CoV-2 infection, orange; MIS-C_MYO (CoV-2+): individuals with postacute hyperinflammatory syndrome, severe myocarditis, and evidence of SARS-CoV-2 infection, red; KD (CoV-2): individuals with postacute hyperinflammatory syndrome, no evidence of SARS-CoV-2 infection, but criteria for Kawasaki disease (KD), pink. Illustrations were obtained from Servier Medical Art, licensed under a Creative Common Attribution 3.0 Unported License (https://smart.servier.com/). See also Figure S1 and Table S1.
Figure 2
Figure 2
Analyses of cytokine/chemokine plasma levels (A) Heatmap of all cytokines/chemokines measured in the different clinical groups: CTL, green; Acute-Inf (CoV-2+), blue; MIS-C (CoV-2+), orange; MIS-C_MYO (CoV-2+), red. On the x axis, blood donors are organized by groups and immune-modulatory treatment (untreated, blue; treated, yellow), and on the y axis, cytokines/chemokines are displayed following hierarchical clustering. Cytokines/chemokines were expressed as pg/mL and log transformed, with blue to orange colors representing lower to higher expression, respectively. (B) Dot plots of cytokines/chemokines elevated in postacute hyperinflammatory groups (MIS-C (CoV-2+) and MIS-C_MYO (CoV-2+)) compared with Acute-Inf (CoV-2+) and healthy blood donors (CTL). (C) Dot plots of cytokines/chemokines elevated in Acute-Inf (CoV-2+) compared with postacute hyperinflammatory groups (MIS-C (CoV-2+) and MIS-C_MYO (CoV-2+)) and healthy blood donors (CTL). (B and C) p values are calculated by Kruskal-Wallis test for multiple comparisons, followed by a post hoc Dunn’s test. ∗p < 0.05, ∗∗p < 0.01, ∗∗∗p < 0.001. See also Figure S2.
Figure 3
Figure 3
CyTOF and scRNA-seq characterization of PBMCs distribution (A) Top panel: UMAP of 1,150,000 single cells from PBMCs of 7 CTL, 1 Acute-Inf (CoV-2), 4 Acute-Inf (CoV-2+), 2 MIS-C (CoV-2+), 6 MIS-C_MYO (CoV-2+), and 3 KD (CoV-2) donors following analyses by CyTOF and displayed as 23 clusters identified using the individual expression of 29 proteins, as described in Figure S3A. Bottom panel: boxplots of clusters with differences observed between SARS-CoV-2+ groups and CTL (Acute-Inf (CoV-2+), MIS-C (CoV-2+), and MIS-C_MYO (CoV-2+)). (B) Top panel: Uniform Manifold Approximation and Projection (UMAP) of 152,201 single cells following extraction from PBMCs (9 CTL, 1 Acute-Inf (CoV-2), 4 Acute-Inf (CoV-2+), 2 MIS-C (CoV-2+), 6 MIS-C_MYO (CoV-2+), and 3 KD (CoV-2)) and processed by scRNA-seq. A resolution of 0.8 allows us to segregate cells into 26 clusters identified based on the expression of several markers and gene signatures, as shown in Figure S4B. Bottom panel: boxplots of clusters with significant differences between SARS-CoV-2+ groups and CTL (Acute-Inf (CoV-2+), MIS-C (CoV-2+), and MIS-C_MYO (CoV-2+)). See also Figure S3. Groups are represented by the following colors: CTL, green; Acute-Inf (CoV-2+), blue; MIS-C (CoV-2+), orange; MIS-C_MYO (CoV-2+)). In the boxplots, each dot represents a sample. Boxes range from the 25th to the 75th percentiles. The upper and lower whiskers extend from the box to the largest and smallest values, respectively. Any sample with a value at most ×1.5 the interquartile range of the hinge is considered an outlier and plotted individually. p values are calculated by Kruskal-Wallis test for multiple comparisons, followed by a post hoc Dunn’s test. ∗p < 0.05, ∗∗p < 0.01, ∗∗∗p < 0.001.
Figure 4
Figure 4
Genes and pathways differentially regulated in acute infection and postacute hyperinflammation following SARS-CoV-2 infection (A) Bar charts of the number of up- and downregulated genes in Acute-Inf (CoV-2+) (left panel) and All MIS-C (MIS-C (CoV-2+) and MIS-C_MYO (CoV-2+)) (right panel) compared to CTL in PBMCs, monocyte/cDC/pDC, and T and B cell clusters obtained following scRNA-seq experiments as displayed in Figure 3B. PBMCs represent all clusters. Monocytes/cDCs/pDCs represent clusters 5, 11, 12, 17, 20, 21, and 24. T cells represent clusters 0, 1, 2, 4, 6, 7, 10, 13, 14, 15, 16, 18, and 23. B cells represent clusters 3, 8, 9, 19, and 22. The top value on the light-colored bars represents the upregulated genes, and the bottom value (dark) represents the downregulated genes. Median age for each group: CTL, 15 years; MIS-C (CoV-2+), 3.7 years; MIS-C_MYO (CoV-2+), 8.4 years. (B) Heatmap of the canonical pathways, enriched in the differentially expressed genes (DEGs) from the comparisons performed in (A) in PBMCs, monocytes/cDCs/pDCs, and T and B cells, obtained by using Ingenuity Pathways Analysis (IPA). Left panel: part 1. Right panel: part 2. Symbols are used in front to represent pathways of the same functional groups. Pathways with an absolute Z score ≤ 2 or adjusted p > 0.05 under all conditions were filtered out. Z score > 2 means that a function is increased significantly (orange) whereas Z score < −2 indicates a significantly decreased function (blue). Gray dots indicate non-significant pathways (p > 0.05). (C) Heatmap of activation of the NF-κB signaling pathway, as predicted by IPA, in Acute-Inf (CoV-2+) and in All MIS-C (MIS-C (CoV-2+) and MIS-C_MYO (CoV-2+)) compared with controls. The color scale represents the Z score of the prediction. The higher the score, the more activated the NF-κB signaling pathway. NS, non-significant comparison. (D) Dot plot of the expression in monocytes/cDCs/pDCs of the negative regulators of the NF-κB complex. The color scale shows scaled average expression in all monocytes/cDCs/pDCs, with red and blue being the highest and lowest expression, respectively. Sizes of dots show the percentage of cells that express the gene. See also Figure S4 and Data S2.
Figure 5
Figure 5
Cytokine/chemokine and gene expression analyses reveal exacerbation of TNF-α and NF-κB signaling pathways in MIS-C_MYO (CoV-2+) compared with MIS-C (CoV-2+) (A) Heatmap of the cytokines/chemokines showing differences between MIS-C (CoV-2+) (orange) and MIS-C_MYO (CoV-2+) (red) in individuals not treated with corticosteroids before sampling. On the x axis, blood donors are organized by group and treatment received before sampling. On the y axis, cytokines/chemokines are displayed following hierarchical clustering. Cytokines/chemokines were expressed as pg/mL and log transformed, with blue to orange colors representing lower to higher expression, respectively. (B) Dot plots of cytokines/chemokines elevated in MIS-C_MYO (CoV-2+) compared with MIS-C (CoV-2+) and related to TNF-α and NF-κB signaling. p values are calculated by Kruskal-Wallis test for multiple comparisons, followed by a post hoc Dunn’s test. ∗p < 0.05, ∗∗p < 0.01, ∗∗∗p < 0.001. (C) Dot plot of the expression in monocytes/cDCs/pDCs of the 49 genes from TNF-α signaling via the NF-κB pathway (pathway enrichment analysis by MSigDB Hallmark 2020 obtained from the upregulated genes of in the MIS-C_MYO (CoV-2+) group compared with MIS-C (CoV-2+); Figure S6B). (D) Dot plot of the expression in monocytes/cDCs/pDCs of the negative regulators of the NF-κB complex in the MIS-C groups. See also Figure S5 and Data S2.
Figure 6
Figure 6
Differences in IFN responses between MIS-C (CoV-2+) and MIS-C_MYO (CoV-2+) (A) IFN-α and IFN-γ protein levels measured by Simoa (top two panels) and ISGs (type I and type II ISG) expression measured by scRNA-seq and displayed as signatureSCORE on all PBMCs (bottom two panels). (B and C) Violin plots of type I (B) and type II (C) IFN signaling signatures analyzed in monocytes/cDCs/pDCs and B and T cells. (D) Dot plot of the expression in monocytes/cDCs/pDCs cells of 60 genes from the IFN signaling pathway enrichment analysis by MSigDB Hallmark 2020 obtained from the downregulated genes in the MIS-C_MYO (CoV-2+) group compared with MIS-C (CoV-2+) (Figure S6E). See also Figure S6. (A and D) Color scales show scaled average expression in all cells, with red and blue being the highest and lowest expression, respectively. Sizes of dots show the percentage of cells that express the gene.
Figure 7
Figure 7
Molecular signature and proposed mechanism associated with severe myocarditis in children with MIS-C (A) Schematic of the 3 strategies used to extract 329 markers of the MIS-C_MYO (CoV-2+) group from the monocyte/cDC/pDC clusters using the single-cell dataset. Strategy 1: direct comparison of the monocytes/cDCs/pDCs of the MIS-C_MYO (CoV-2+) group with all other samples. Strategy 2: direct comparison of the monocytes/cDCs/pDCs of MIS-C_MYO (CoV-2+) with other samples with postacute hyperinflammation (MIS-C (CoV-2+) and KD (CoV-2)). Strategy 3: selection of genes upregulated only in the monocytes/cDCs/pDCs of MIS-C_MYO (CoV-2+) compared with CTL. Below each strategy is the corresponding dot plot obtained from scRNA-seq with the number of upregulated genes. The average expression is represented by the centered scaled expression of each gene. On the left, names of each group with their corresponding color are shown. (B) Heatmap of expression of the 116 of 329 genes with a higher expression in MIS-C_MYO (CoV-2+) than in other groups in the bulk dataset generated from PBMCs (7 CTL, 7 MIS-C (CoV-2+), 9 MIS-C_MYO (CoV-2+), and 9 KD (CoV-2) donors). The color scale indicates the scaled GeneSCORE (mean Z score of the gene in all samples of a group), with red and blue representing the highest and lowest expression, respectively. Hierarchical clustering of the genes was computed with a Pearson’s correlation as a distance. (C) Boxplot of the expression of the 116 genes validated in (C), calculated as a SignatureSCORE, which represents the mean Z score in each sample of the 116 genes selected in (B) in the bulk RNA-seq dataset (Figure S7A). (D) Boxplot of the SignatureSCORE of the top 25 genes, as ranked in Figure S7B, in the bulk RNA-seq dataset. (E) Graphical representation based on cytokines,cellular, and transcriptomics analyses (above the black dotted line), combined with known literature (below the black dotted line), illustrating a putative model explaining the occurrence of myocarditis among children in the MIS-C (CoV-2) group. Black represents genes and functions modulated in the MIS-C (CoV-2+) and MIS-C_MYO (CoV-2+) groups compared with CTL, whereas red highlights genes and pathways differentially modulated in the MIS-C (CoV-2+) and MIS-C_MYO (CoV-2+) groups, respectively. See also Figure S7 and Data S3. (C and D) Each mark represents a sample. Dots represent untreated samples, triangles represent IVIG-treated samples, and squares represent IVIG- and steroid-treated individuals. Boxes range from the 25th to the 75th percentiles. The upper and lower whiskers extend from the box to the largest and smallest values, respectively. Any sample with a value at most ×1.5 the inter-quartile range of the hinge is considered an outlier and plotted individually.

Comment in

References

    1. Wiersinga W.J., Rhodes A., Cheng A.C., Peacock S.J., Prescott H.C. Pathophysiology, Transmission, Diagnosis, and Treatment of Coronavirus Disease 2019 (COVID-19): A Review. JAMA. 2020;324:782–793. - PubMed
    1. Brodin P. Why is COVID-19 so mild in children? Acta Paediatr. 2020;109:1082–1083. - PubMed
    1. Castagnoli R., Votto M., Licari A., Brambilla I., Bruno R., Perlini S., Rovida F., Baldanti F., Marseglia G.L. Severe Acute Respiratory Syndrome Coronavirus 2 (SARS-CoV-2) Infection in Children and Adolescents: A Systematic Review. JAMA Pediatr. 2020;174:882–889. - PubMed
    1. Gudbjartsson D.F., Helgason A., Jonsson H., Magnusson O.T., Melsted P., Norddahl G.L., Saemundsdottir J., Sigurdsson A., Sulem P., Agustsdottir A.B., et al. Spread of SARS-CoV-2 in the Icelandic Population. N. Engl. J. Med. 2020;382:2302–2315. - PMC - PubMed
    1. Levy C., Basmaci R., Bensaid P., Bru C.B., Coinde E., Dessioux E., Fournial C., Gashignard J., Haas H., Hentgen V., et al. Changes in RT-PCR-positive SARS-CoV-2 rates in adults and children according to the epidemic stages. medRxiv. 2020 doi: 10.1101/2020.05.18.20098863. - DOI - PubMed

Publication types

Supplementary concepts