. 2021 Oct 1;321(4):H615-H632.
doi: 10.1152/ajpheart.00126.2021. Epub 2021 Aug 20.

MCU overexpression evokes disparate dose-dependent effects on mito-ROS and spontaneous Ca2+ release in hypertrophic rat cardiomyocytes

Affiliations

MCU overexpression evokes disparate dose-dependent effects on mito-ROS and spontaneous Ca2+ release in hypertrophic rat cardiomyocytes

Shanna Hamilton et al. Am J Physiol Heart Circ Physiol. .

Abstract

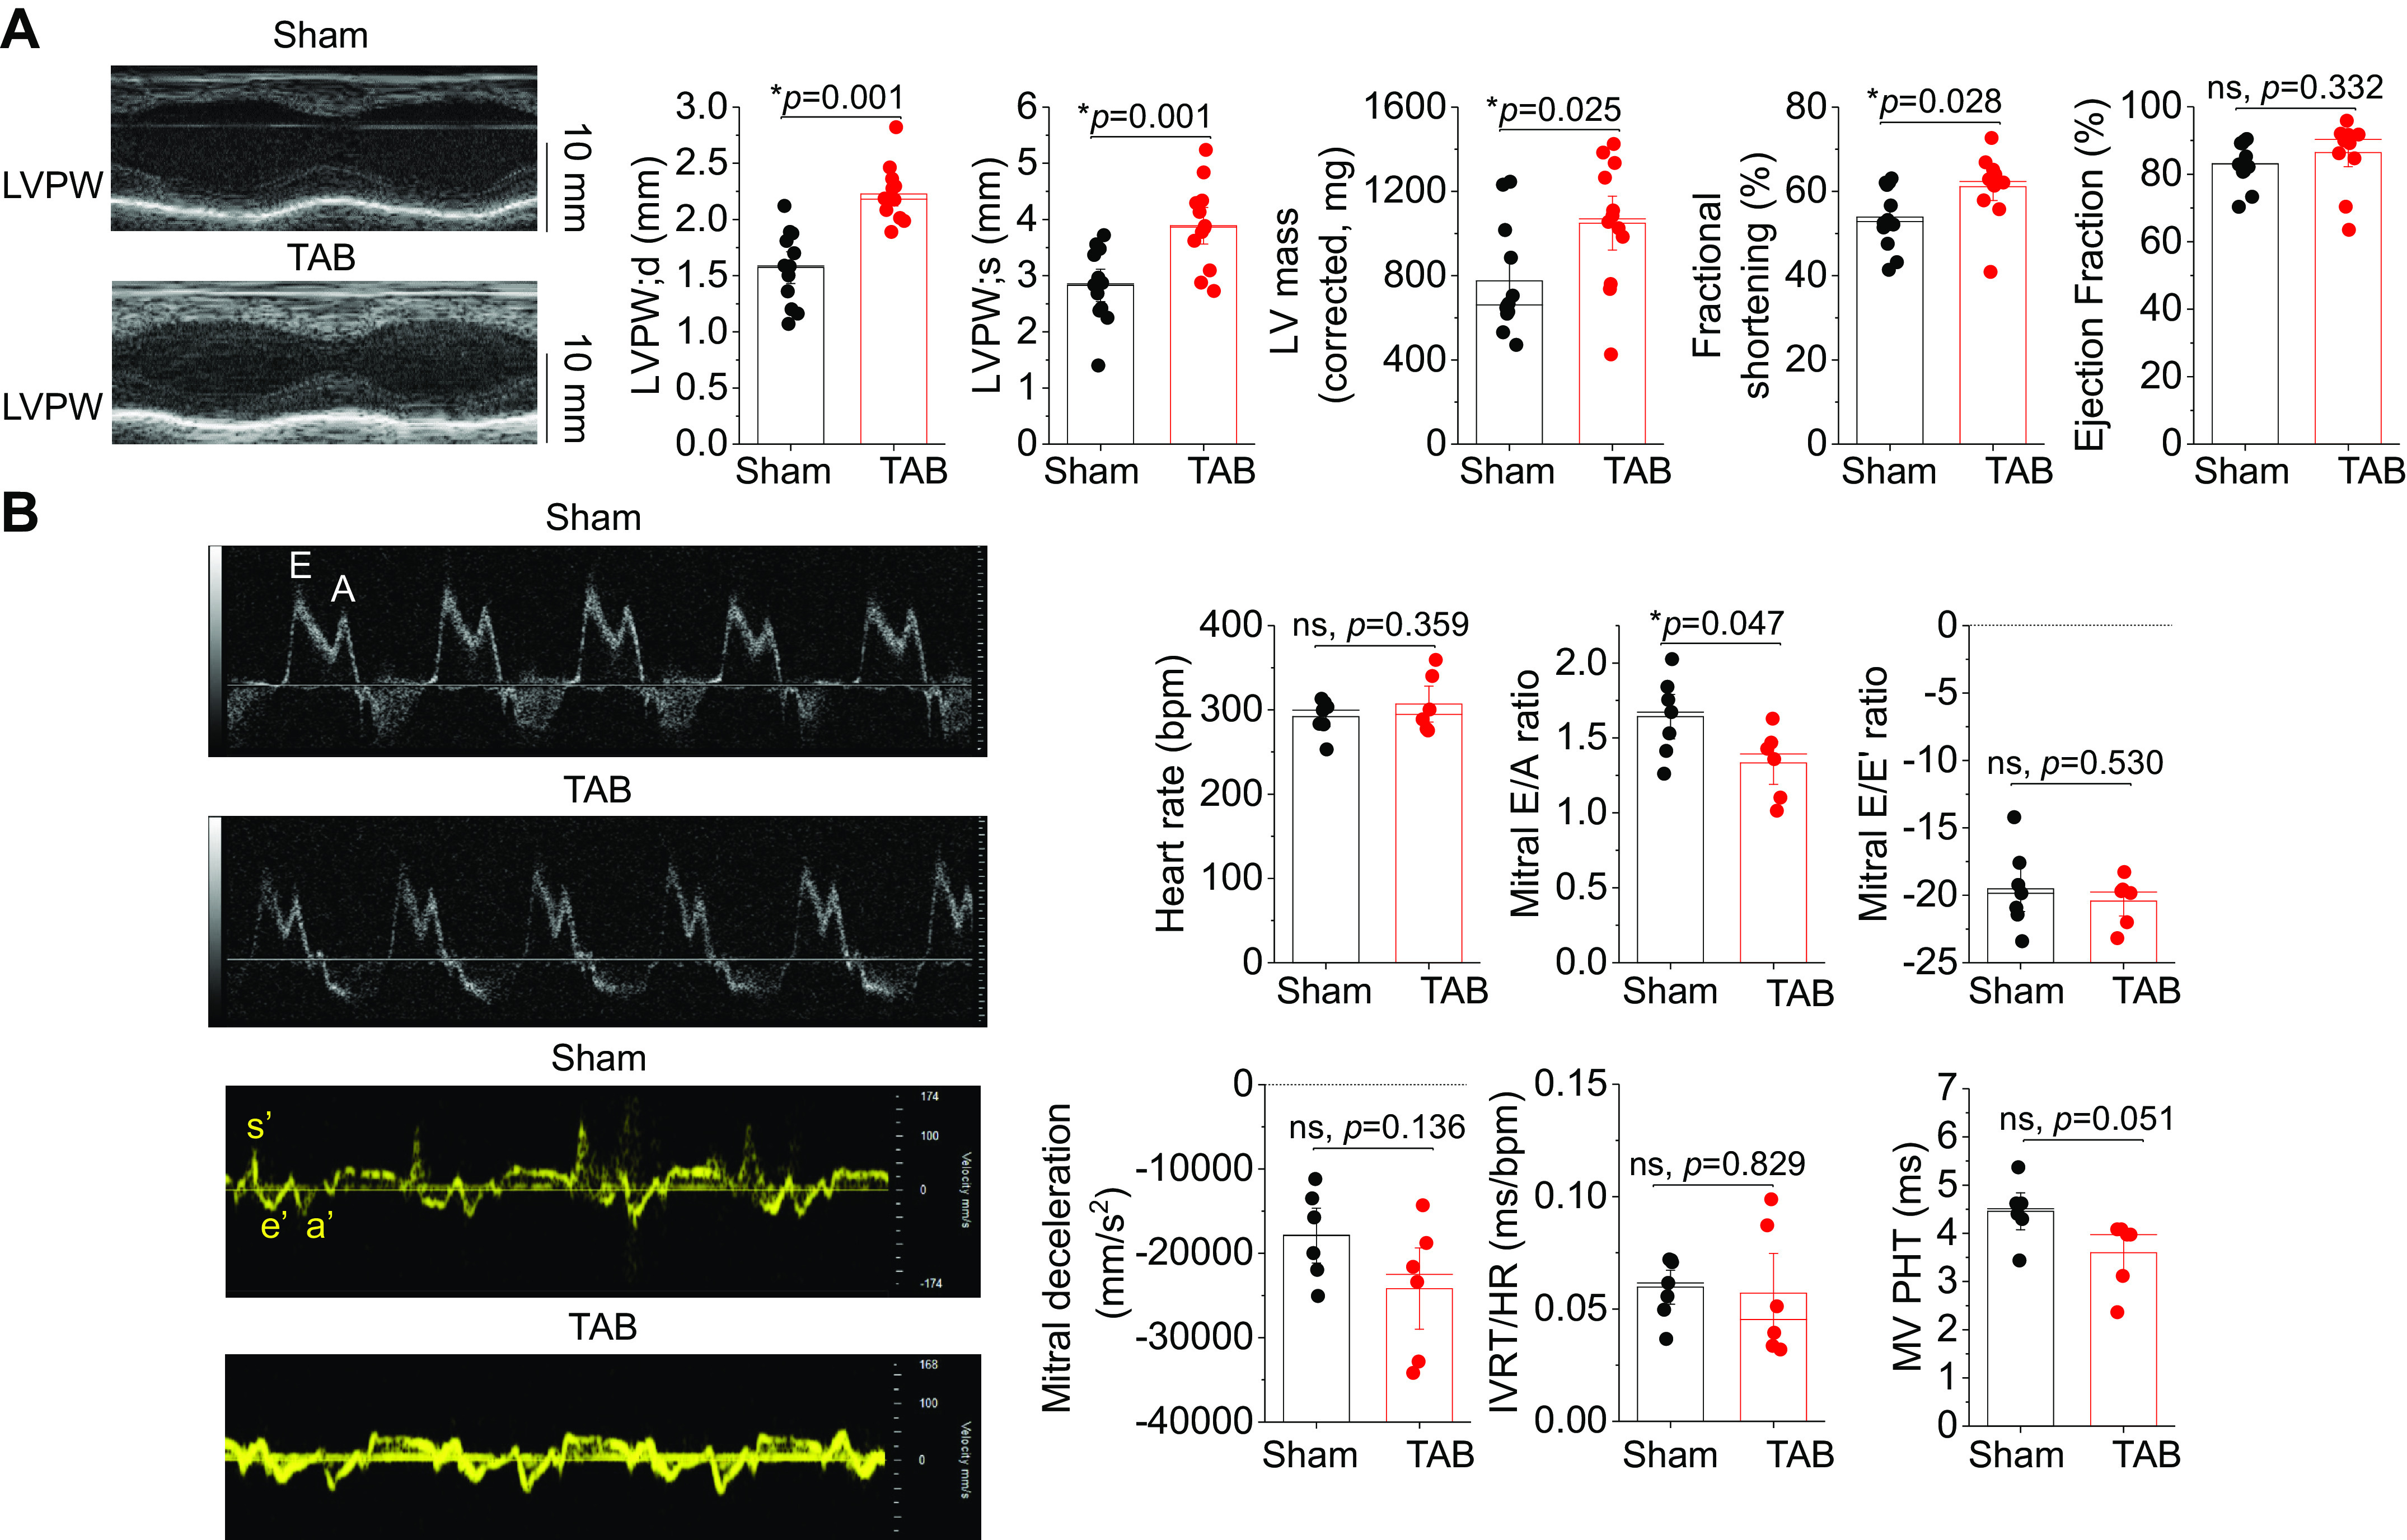
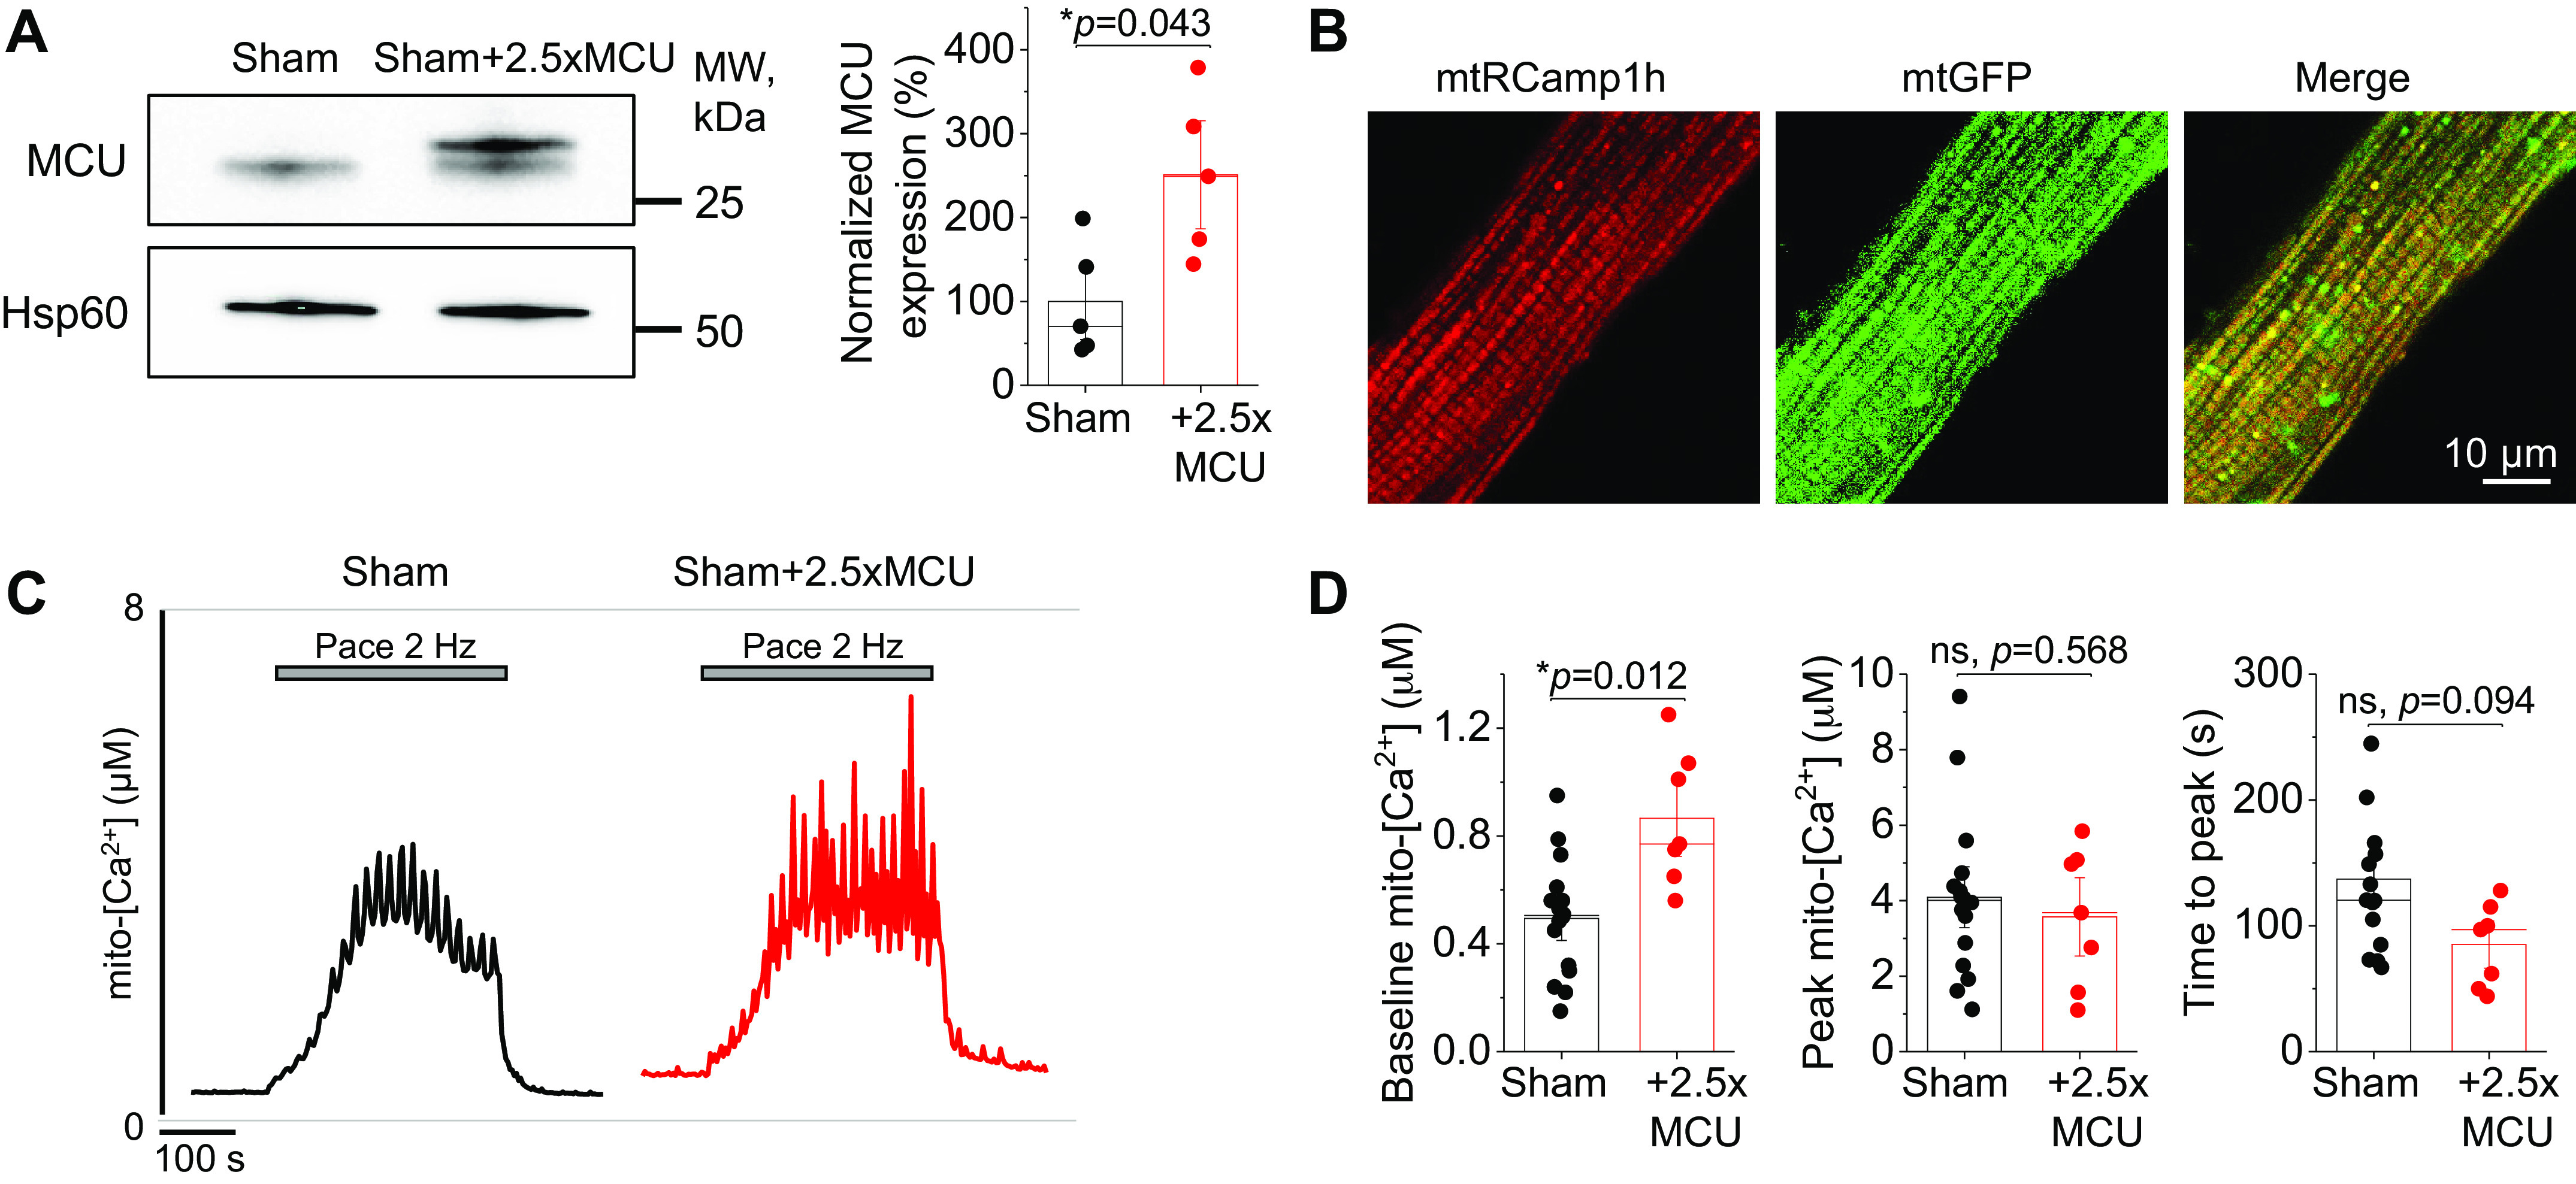
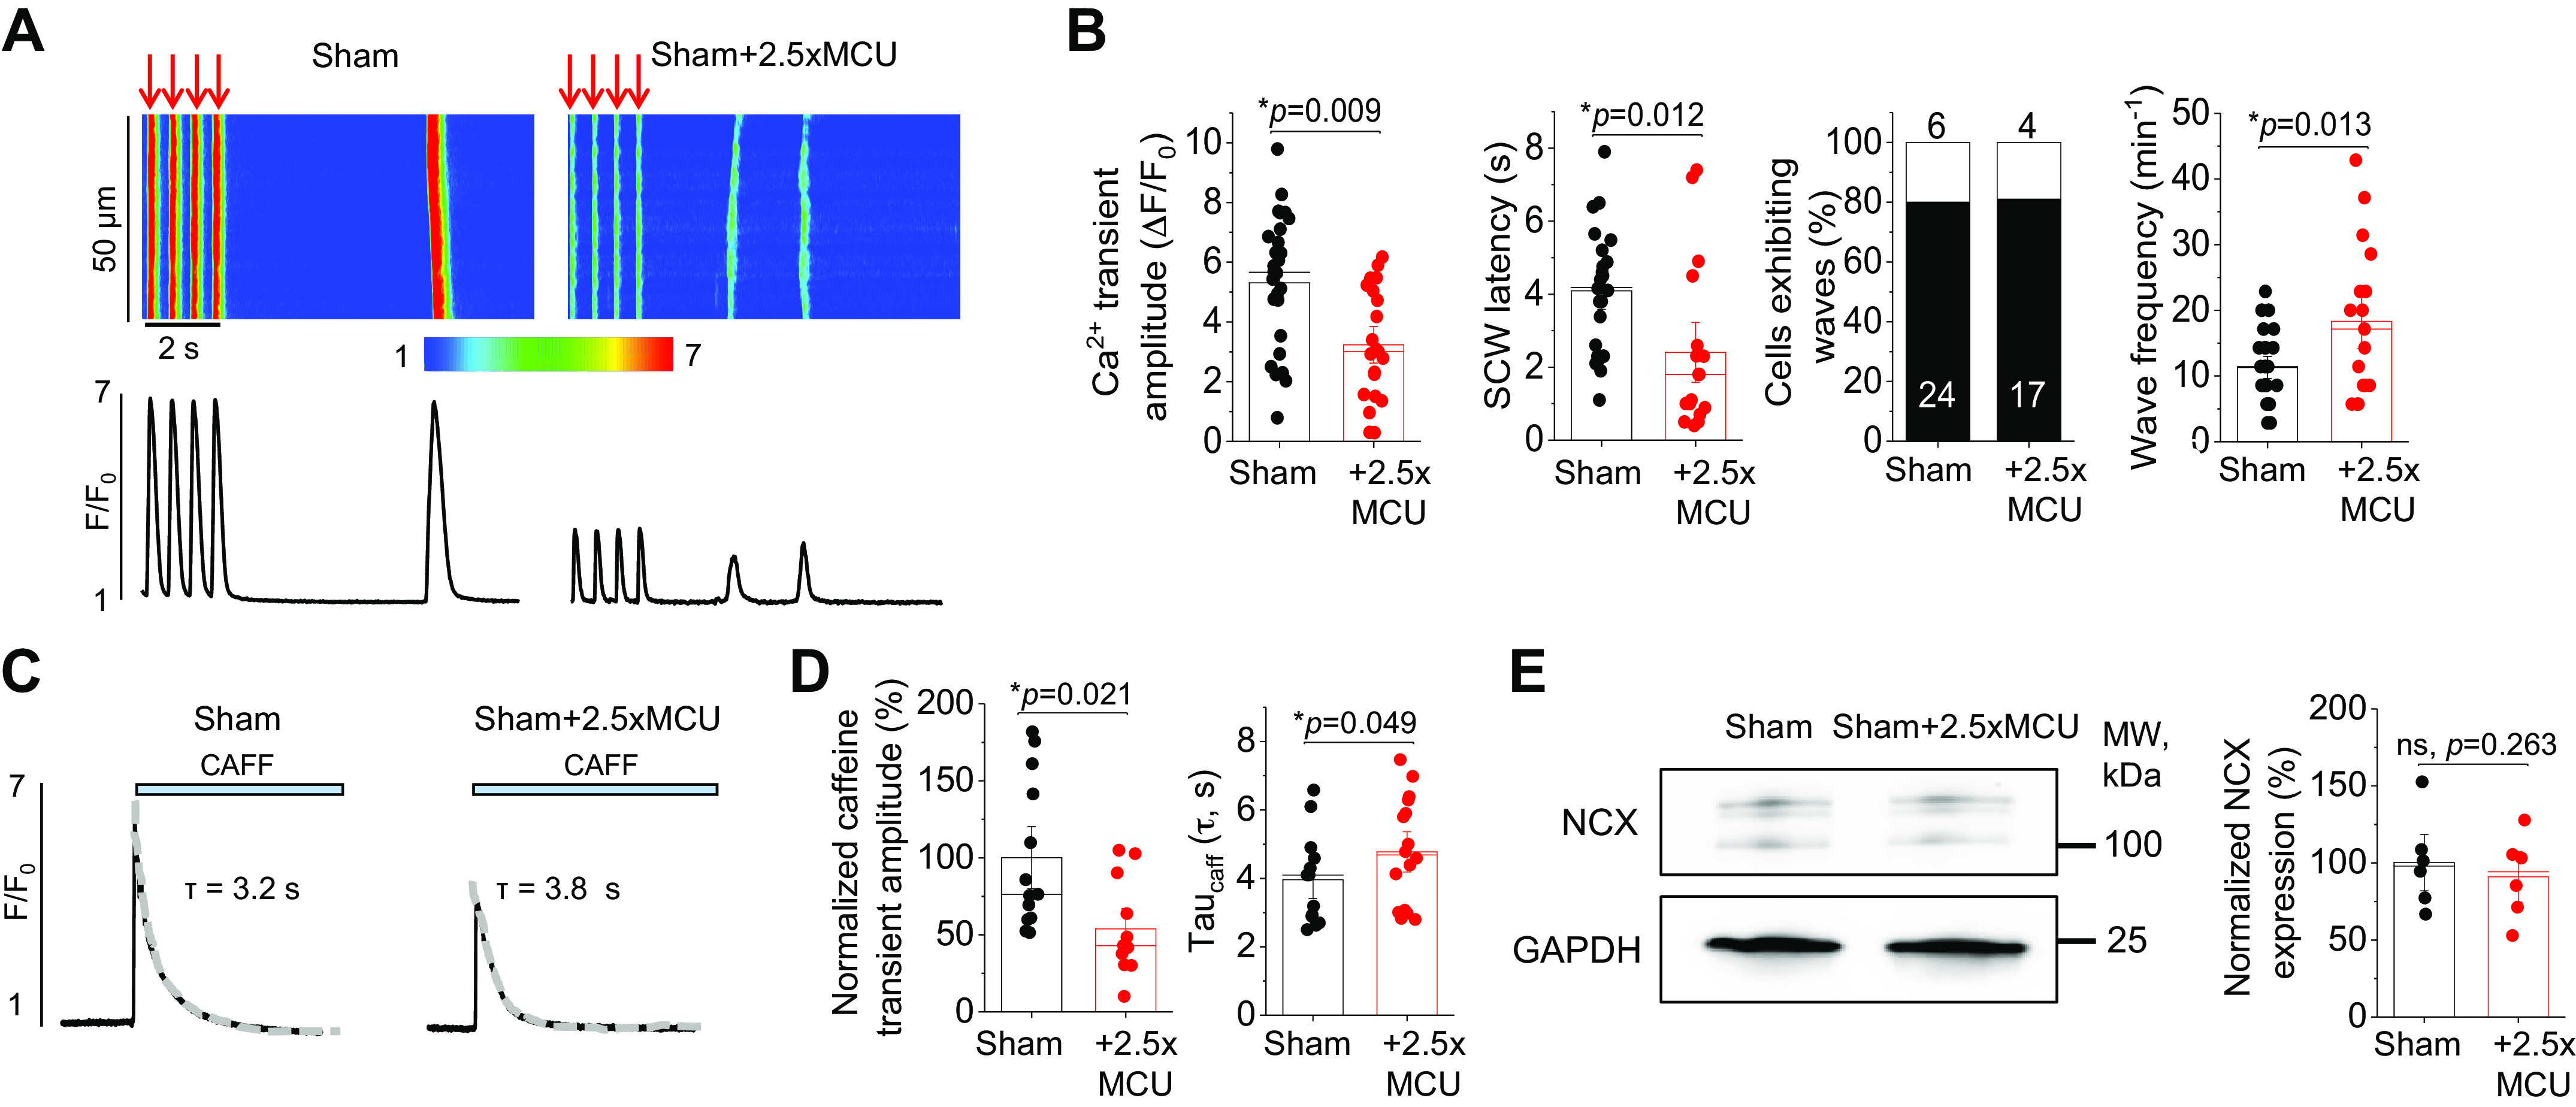
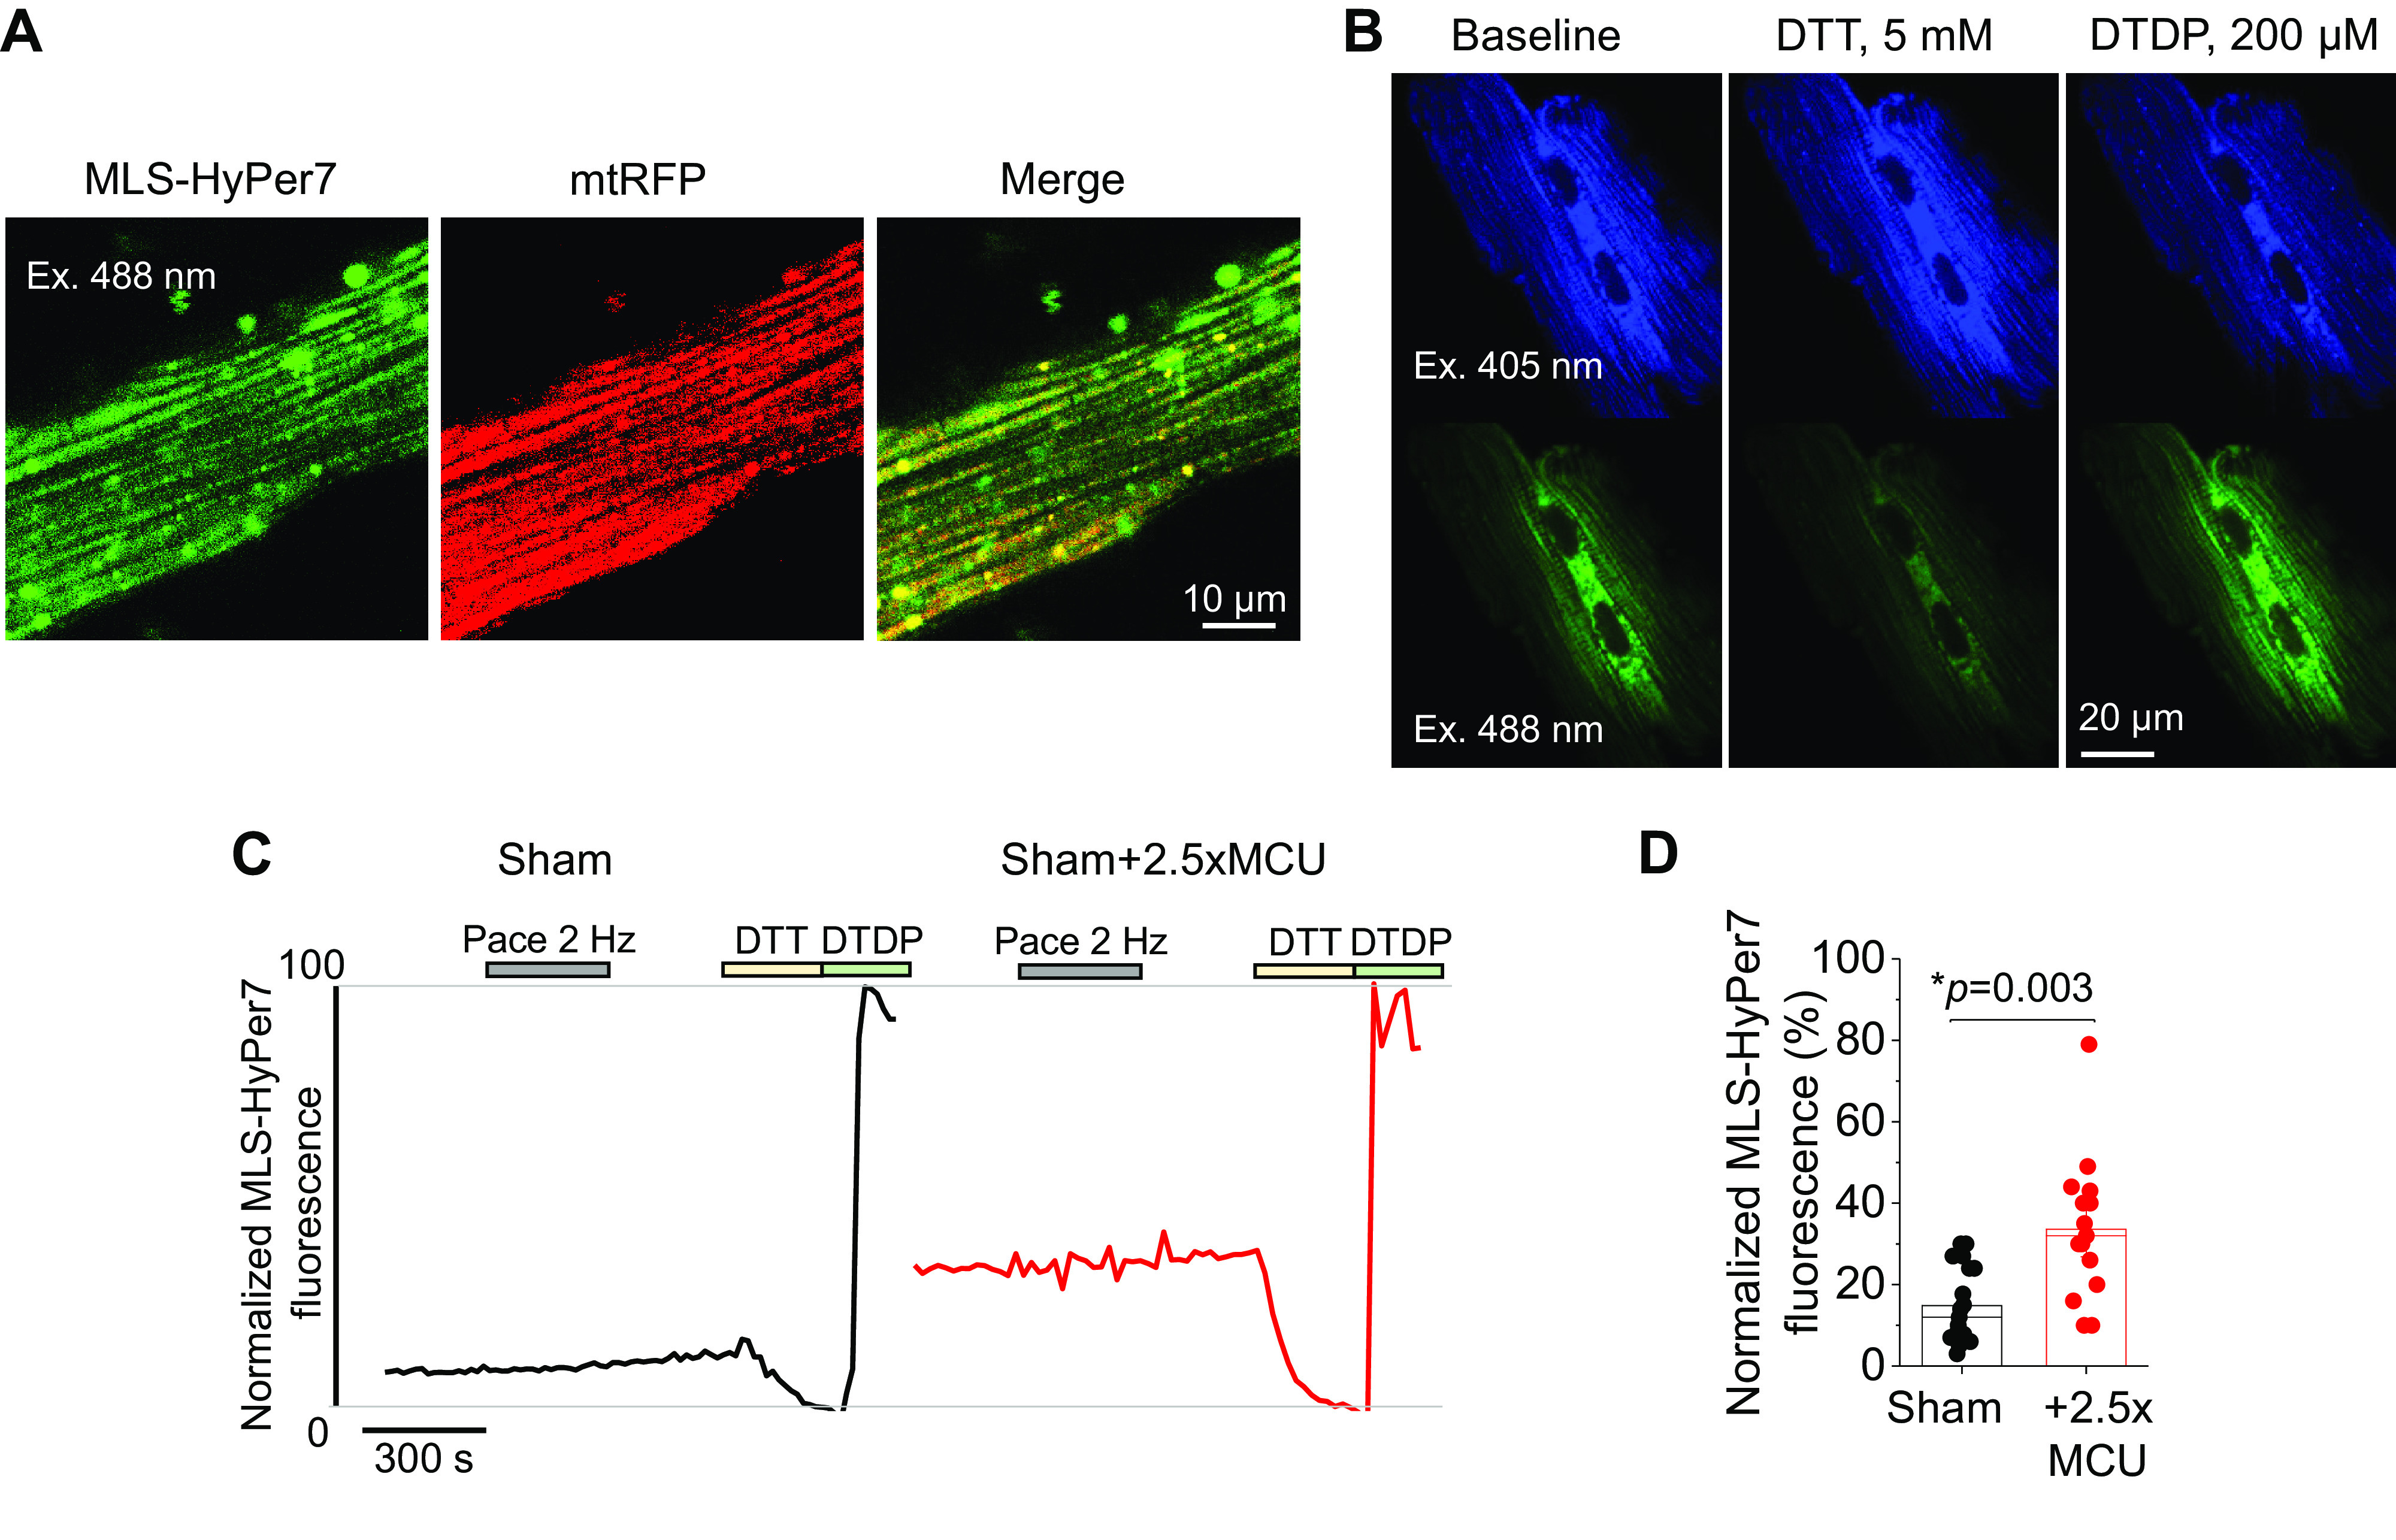
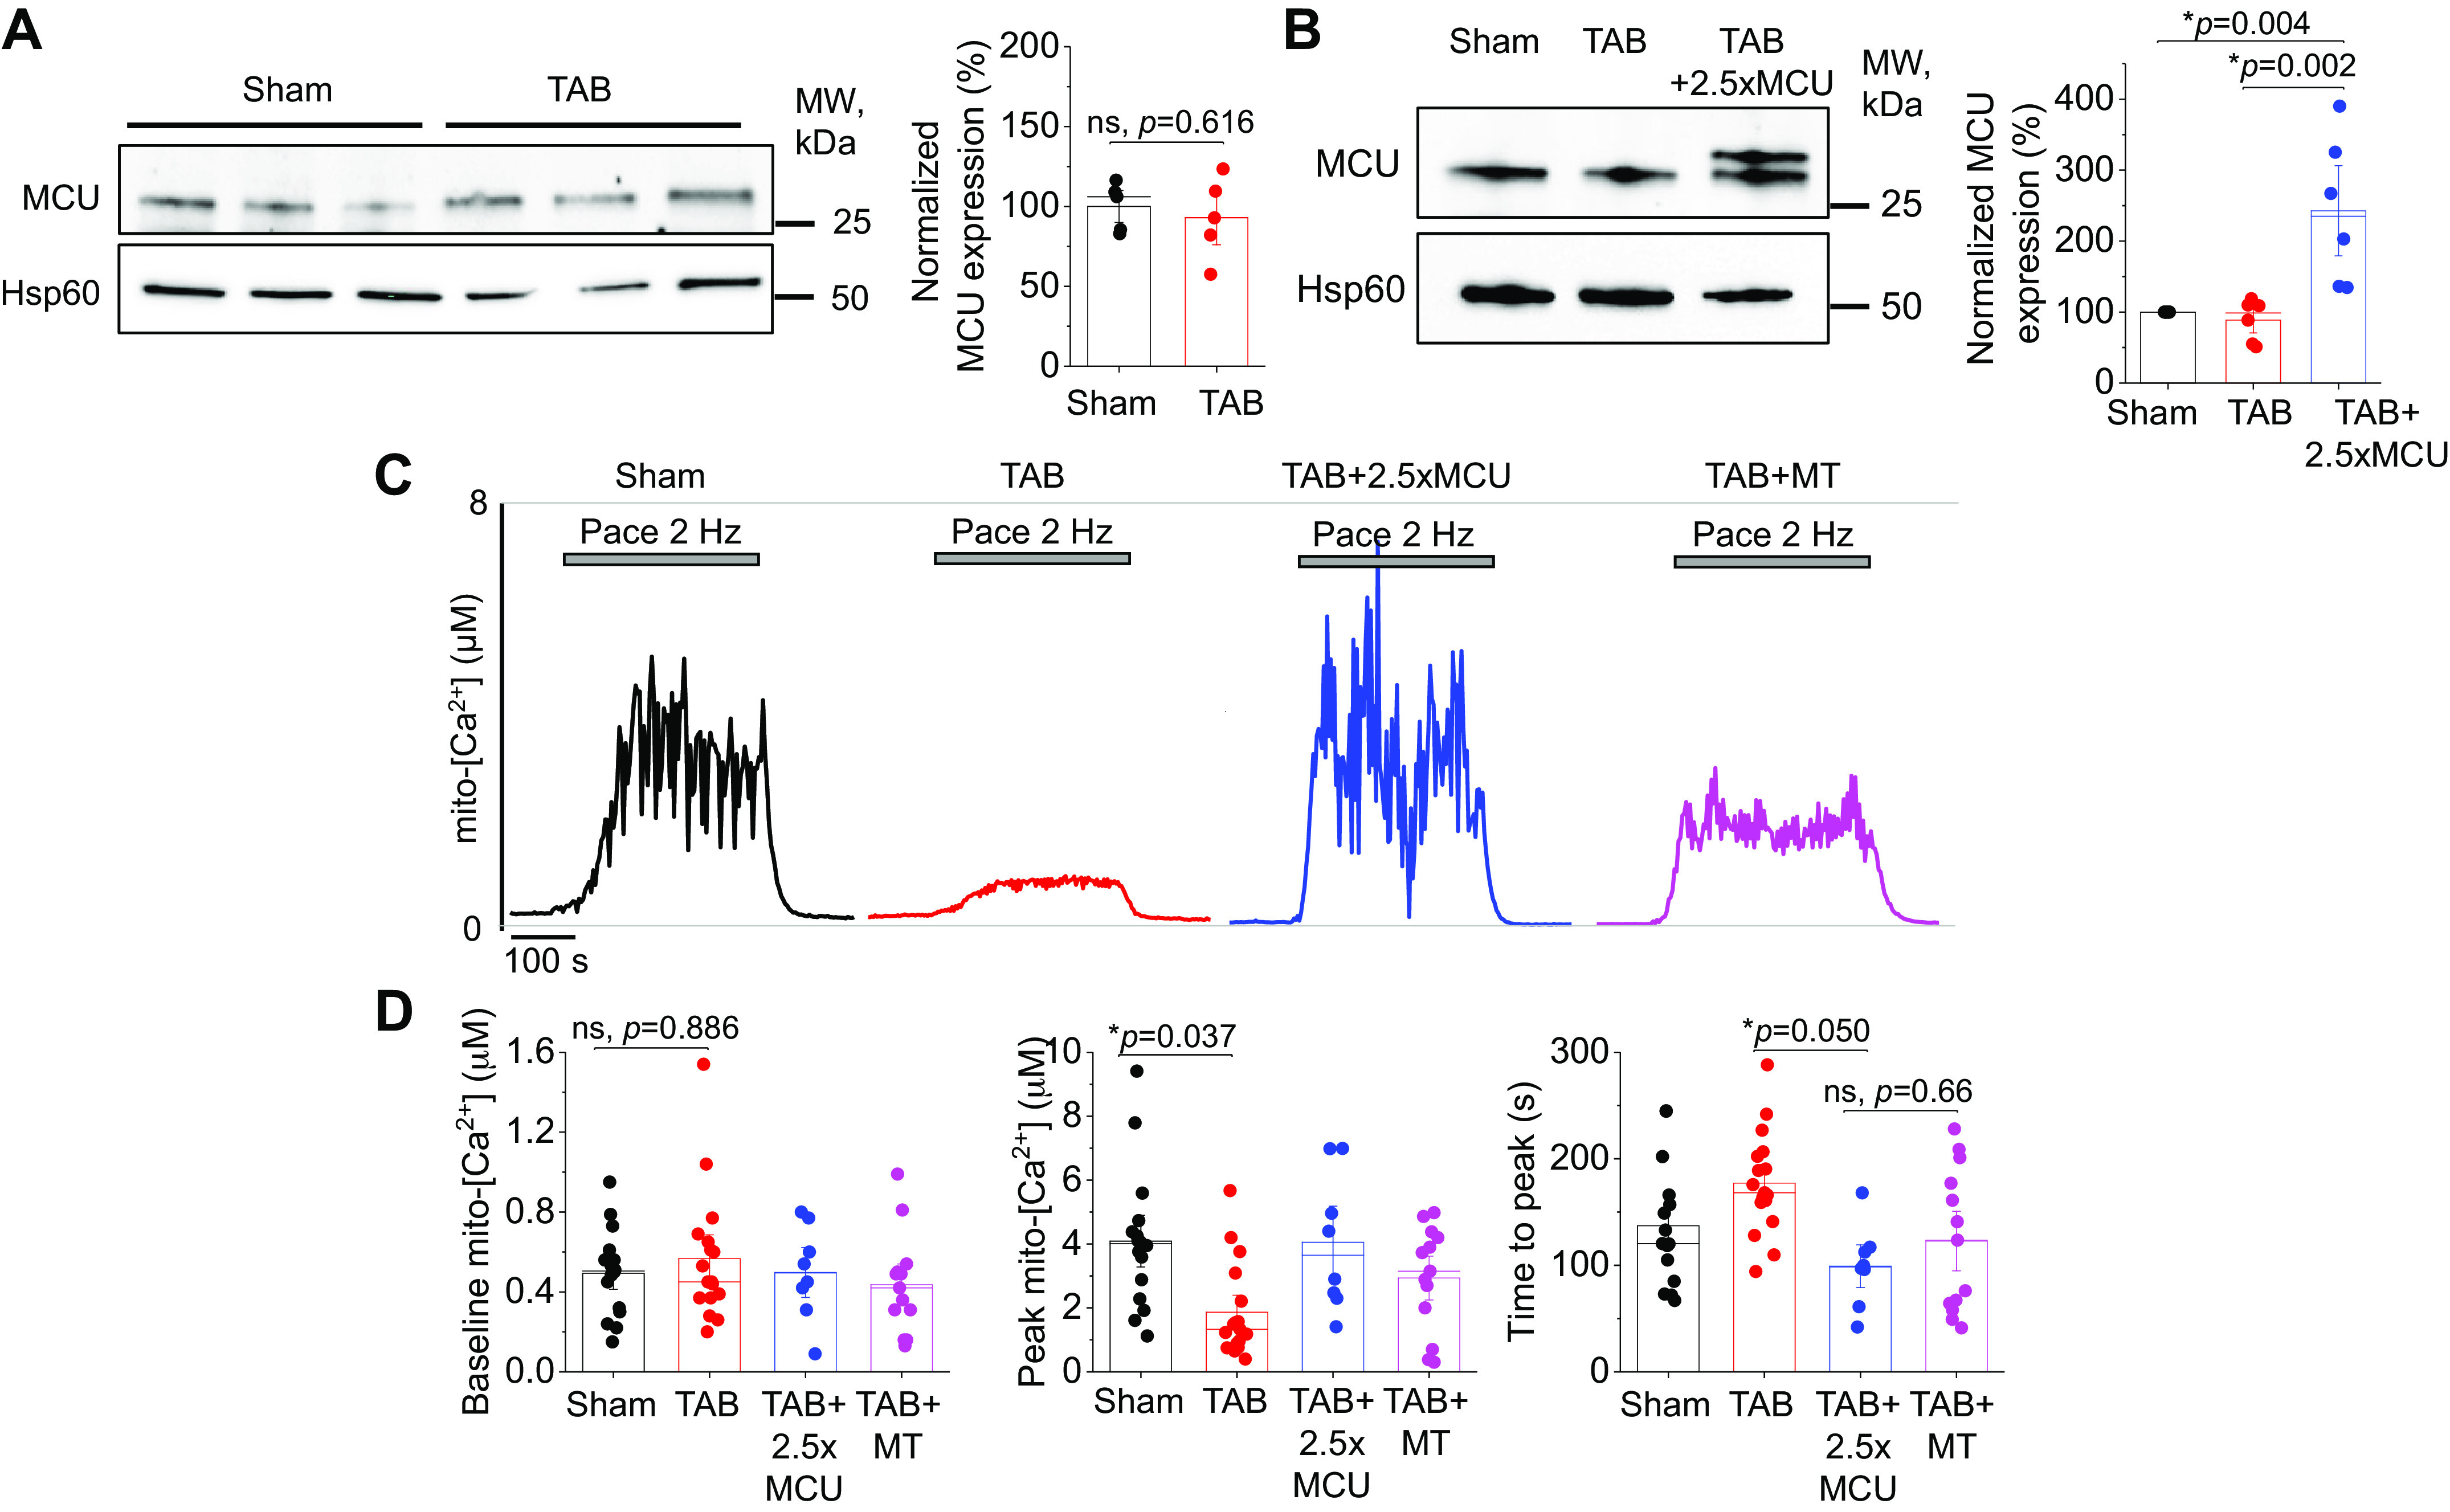
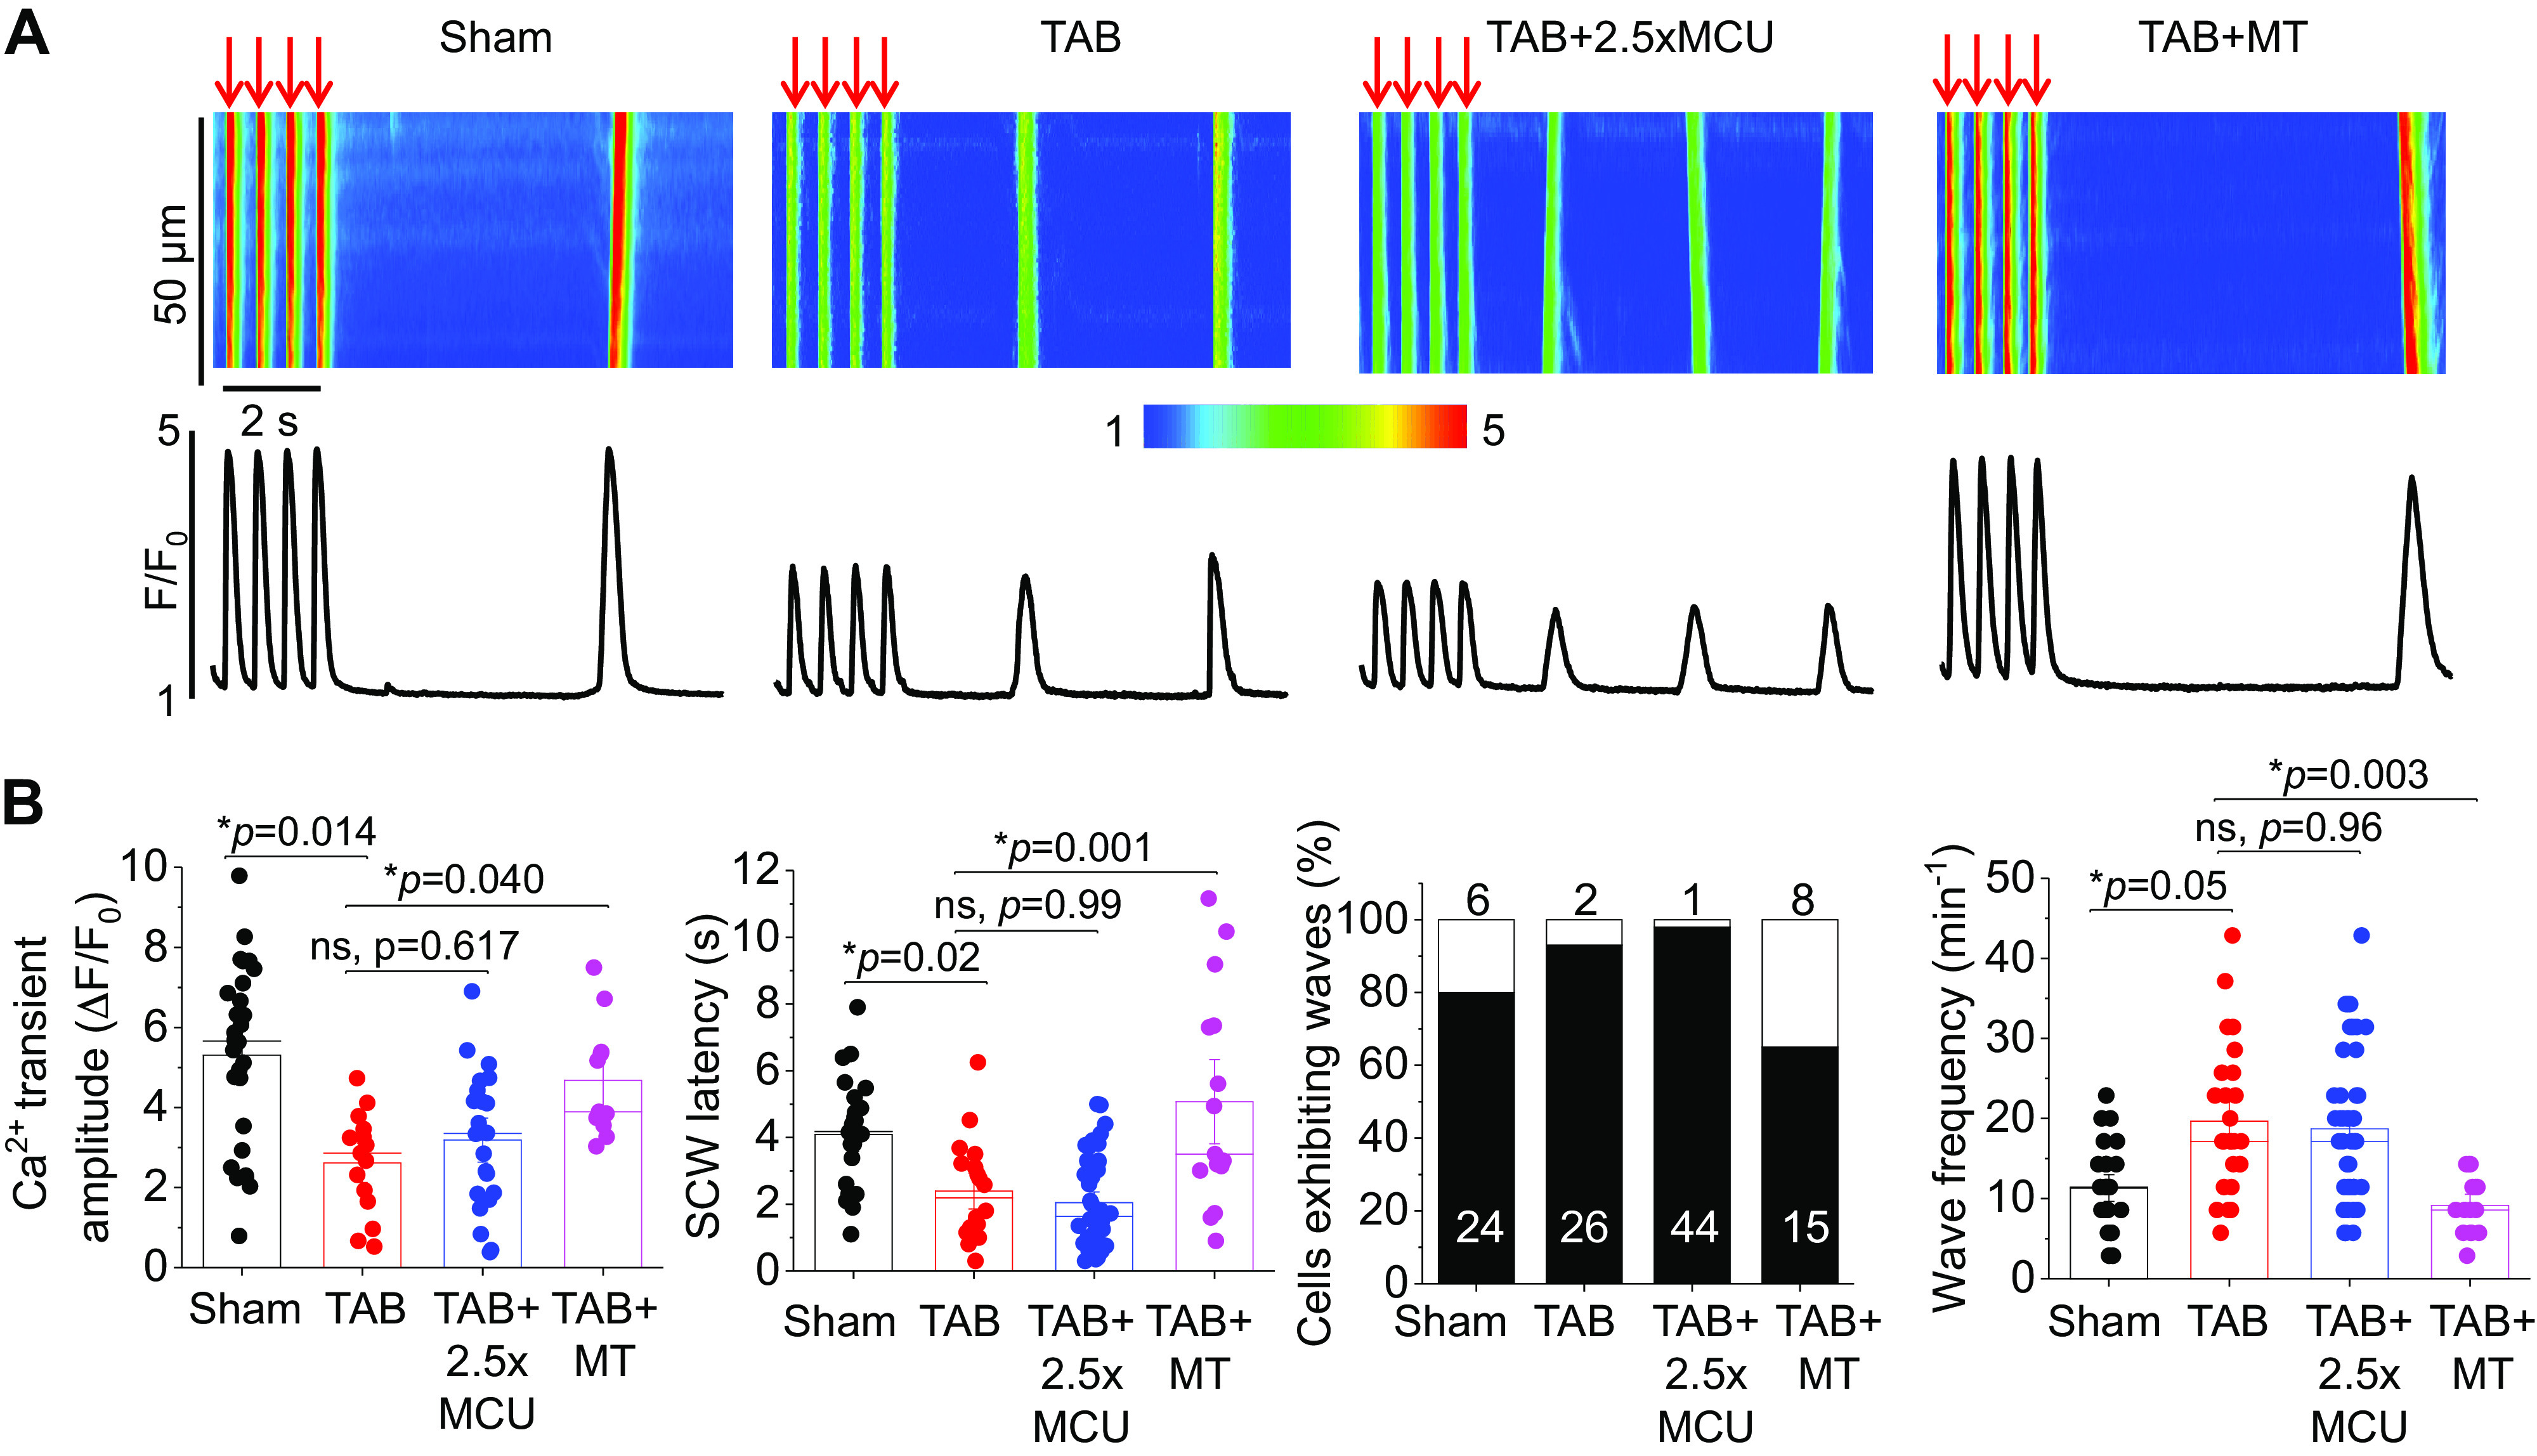
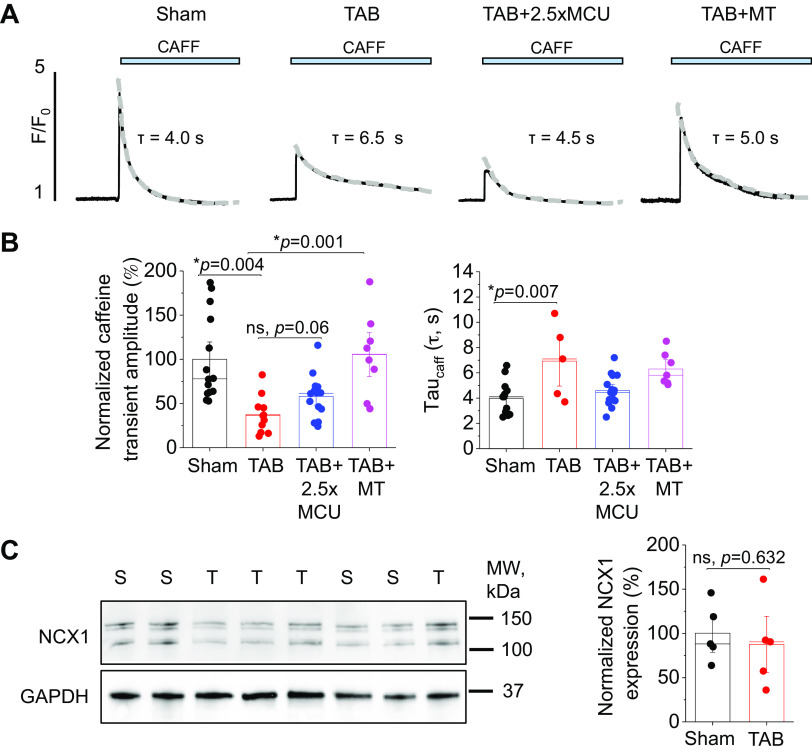
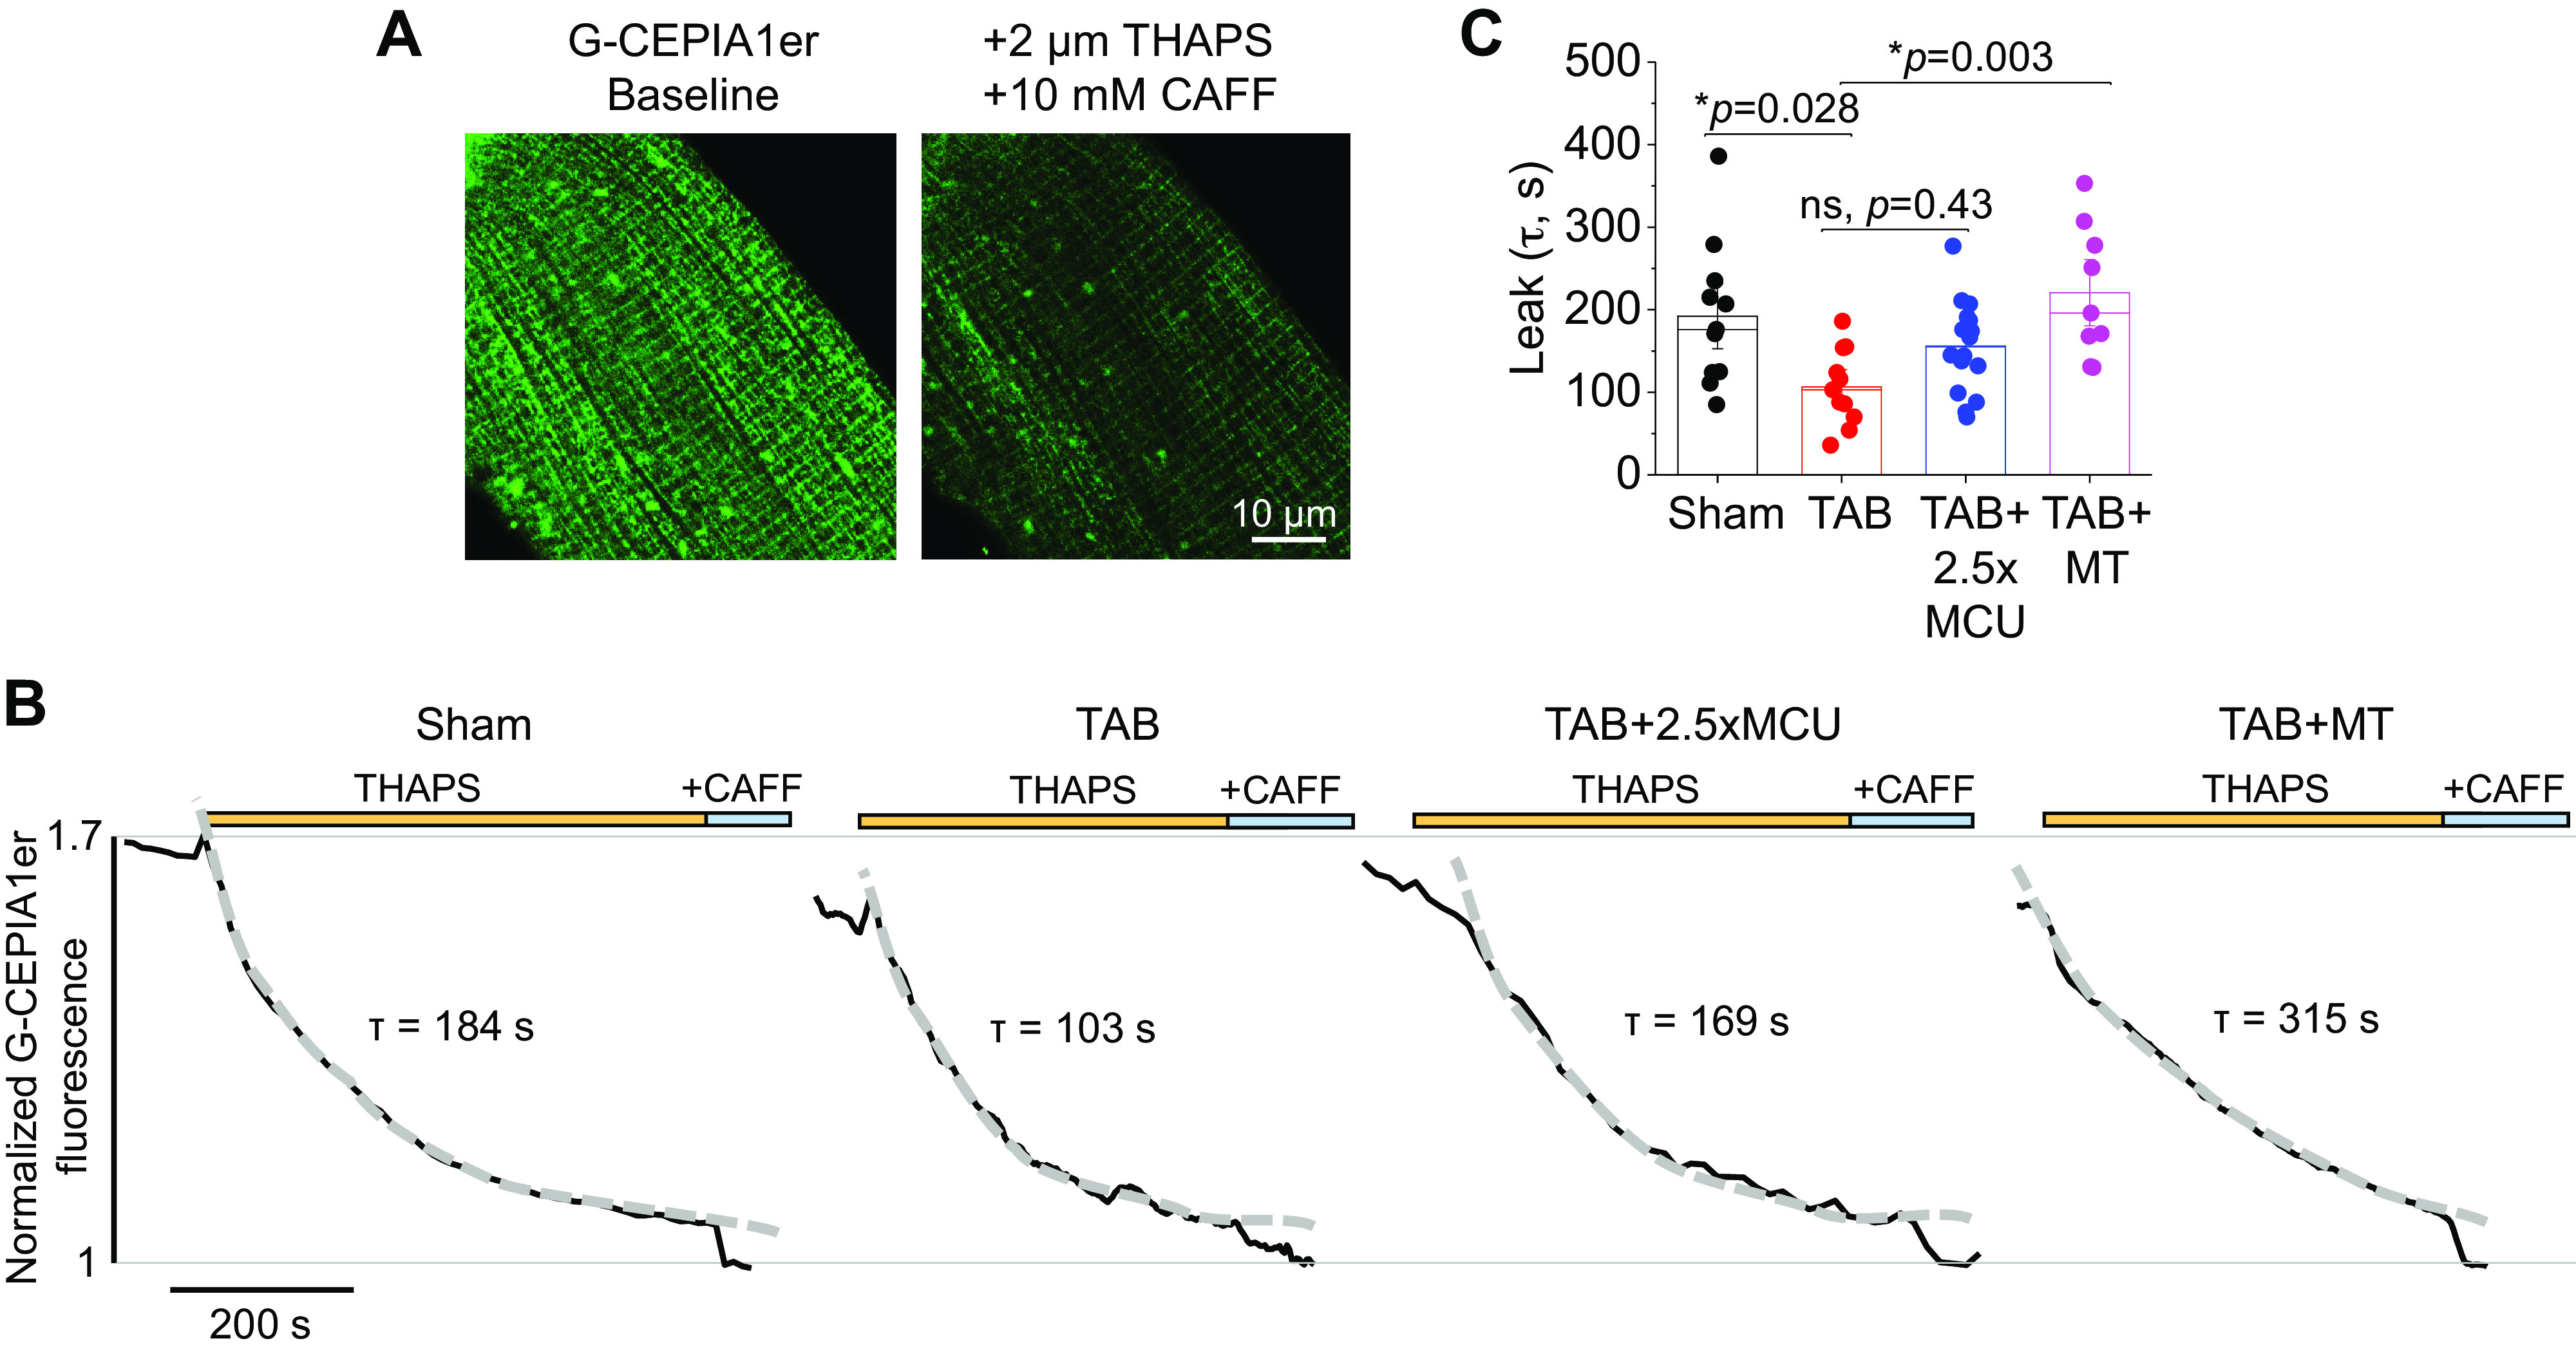
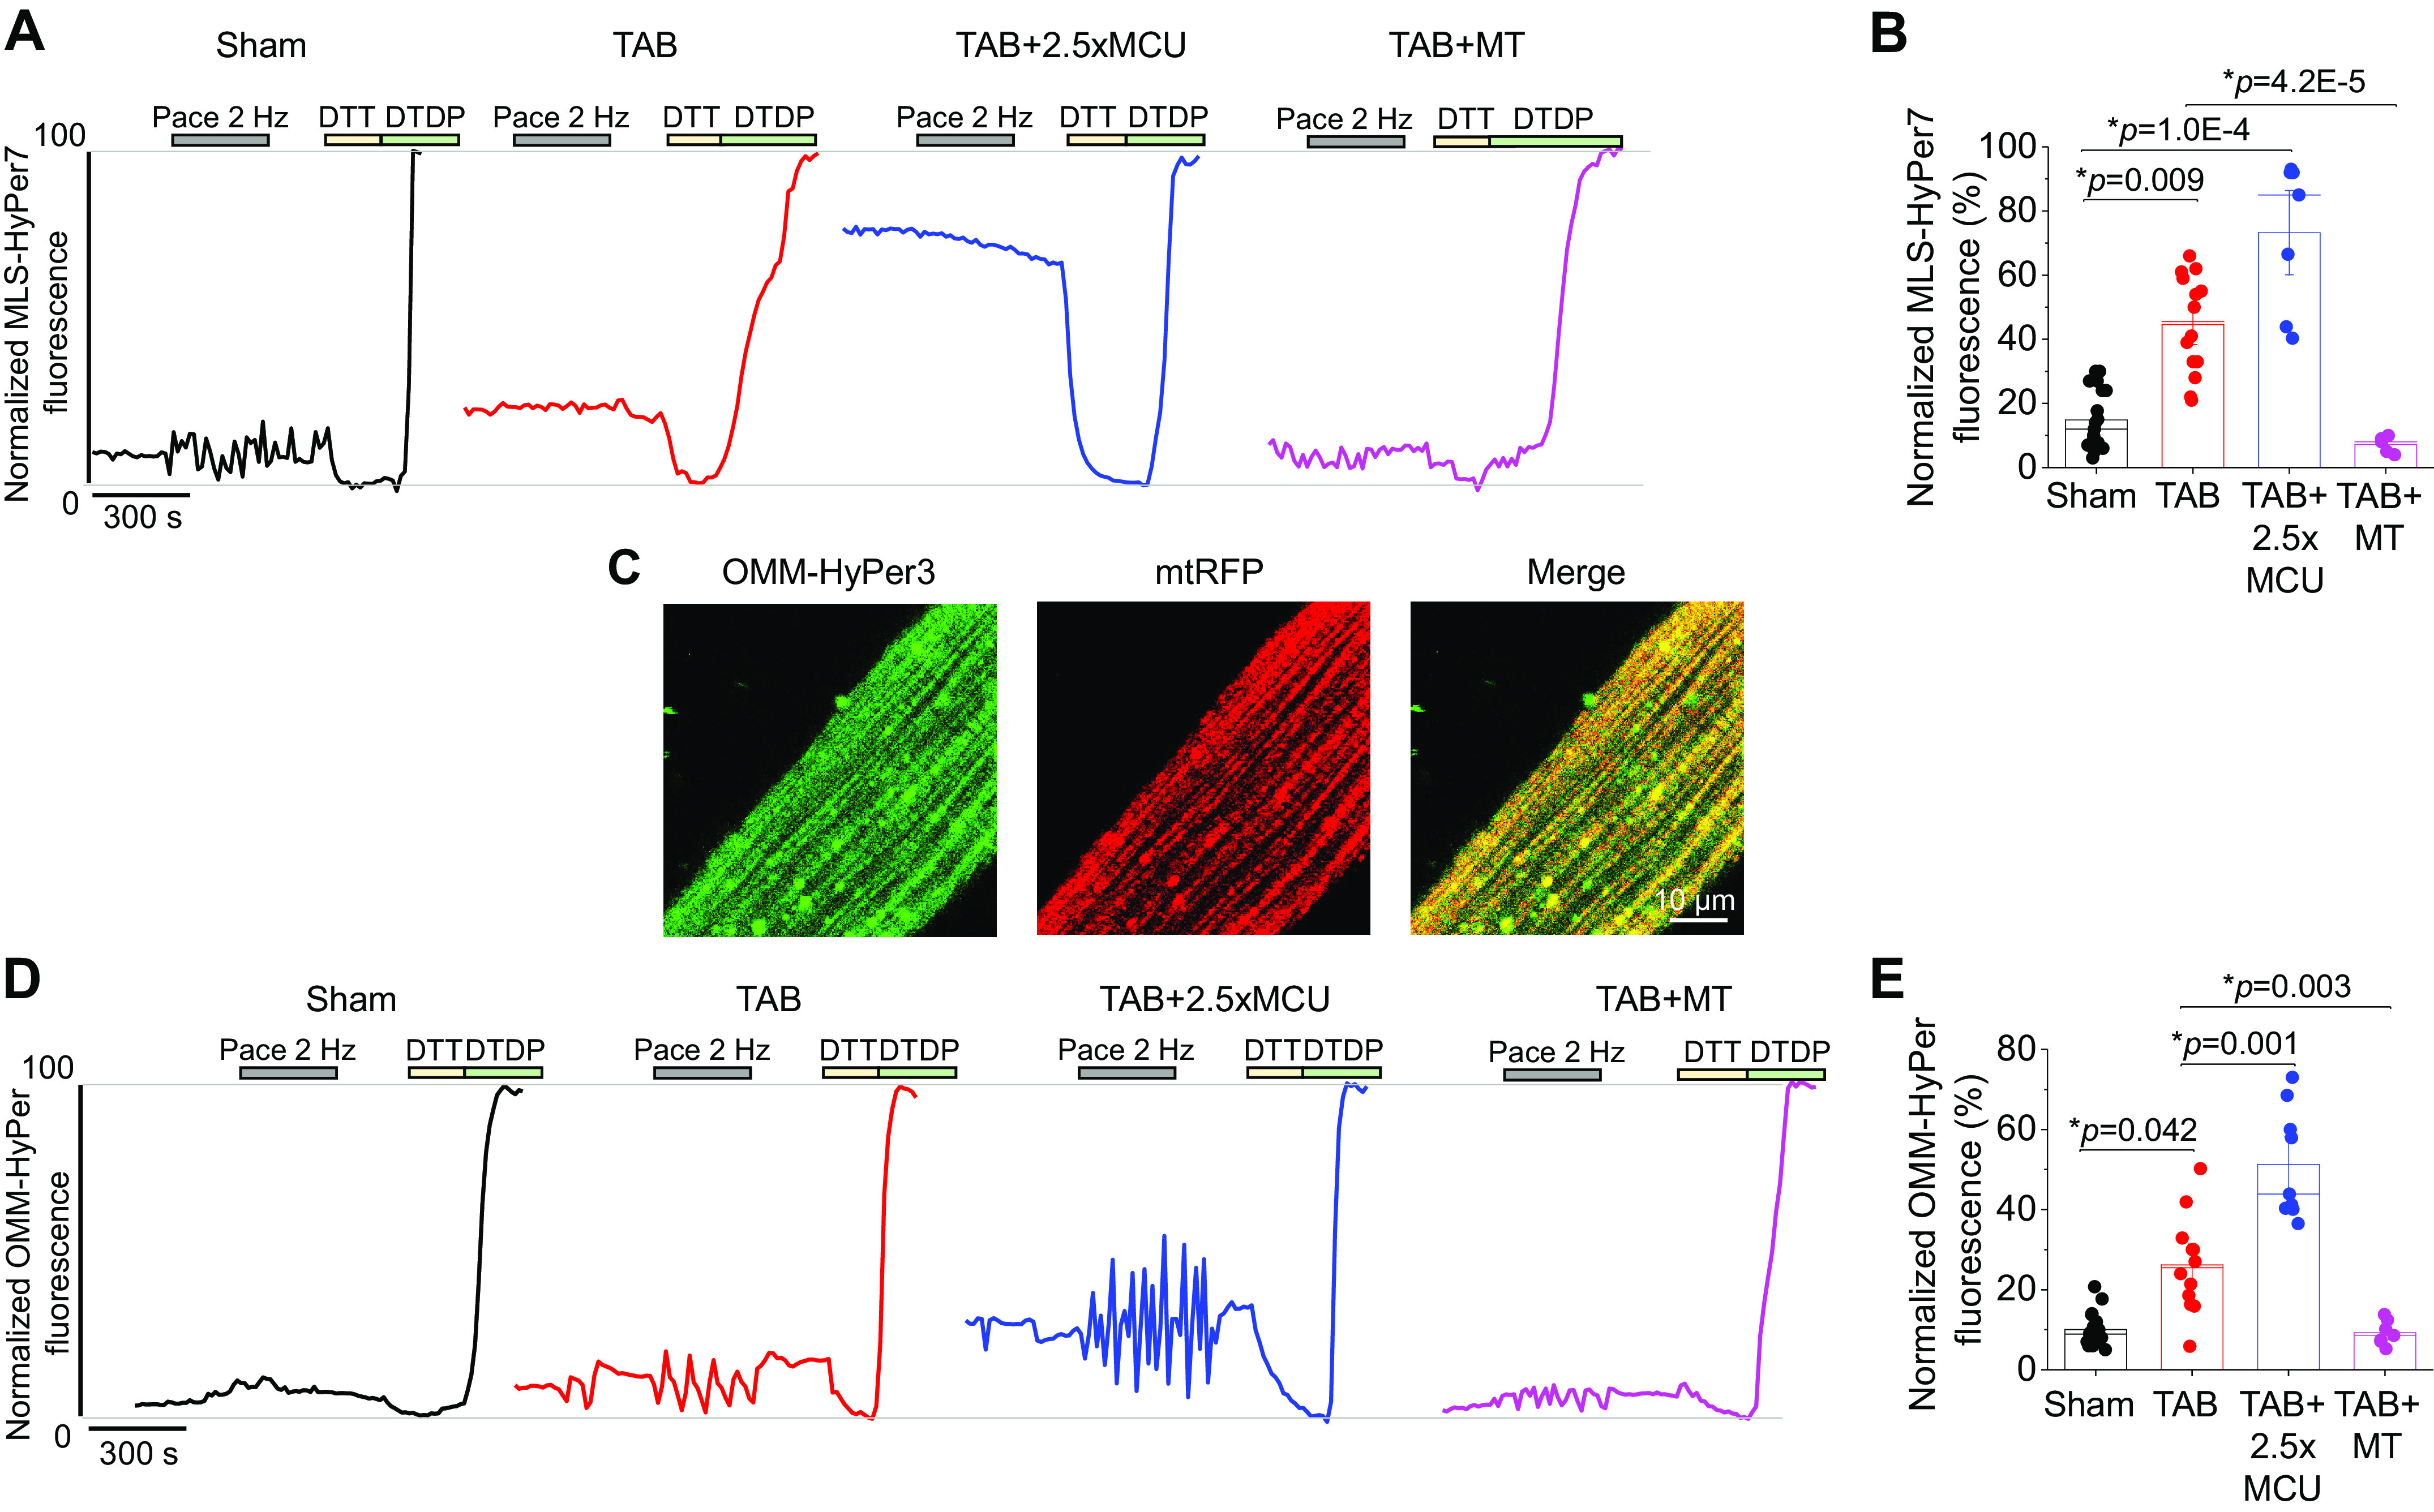
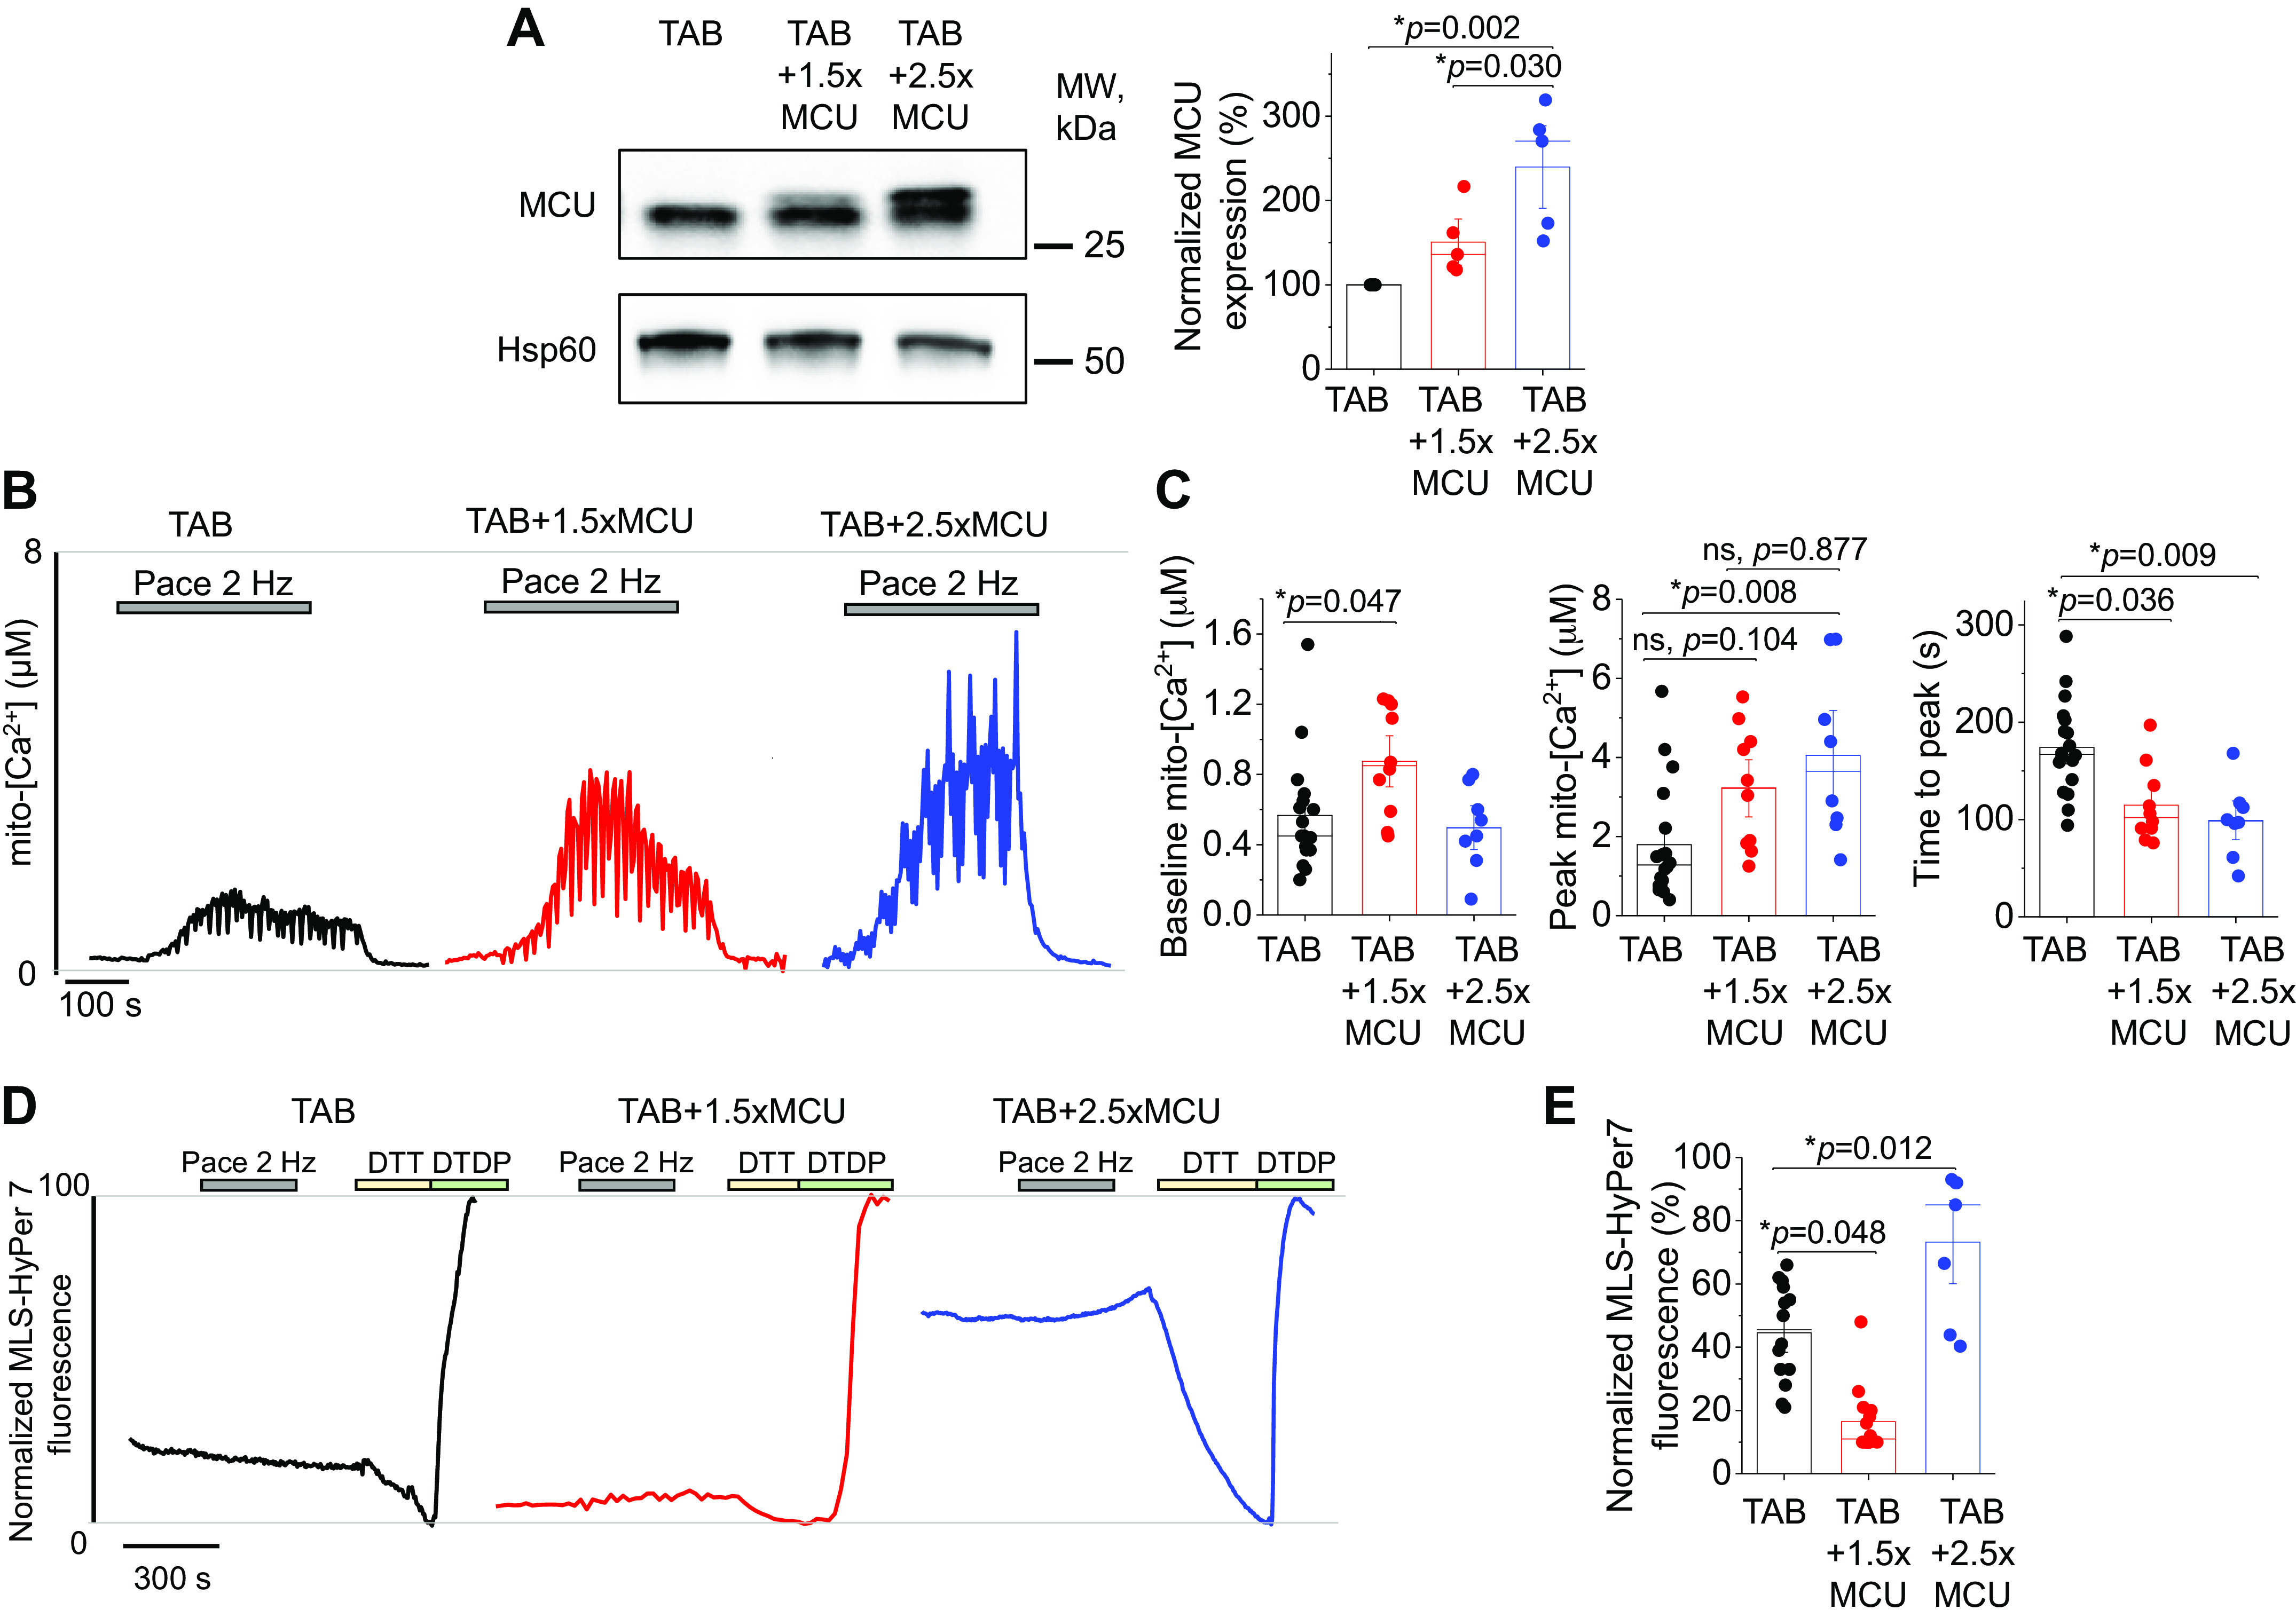
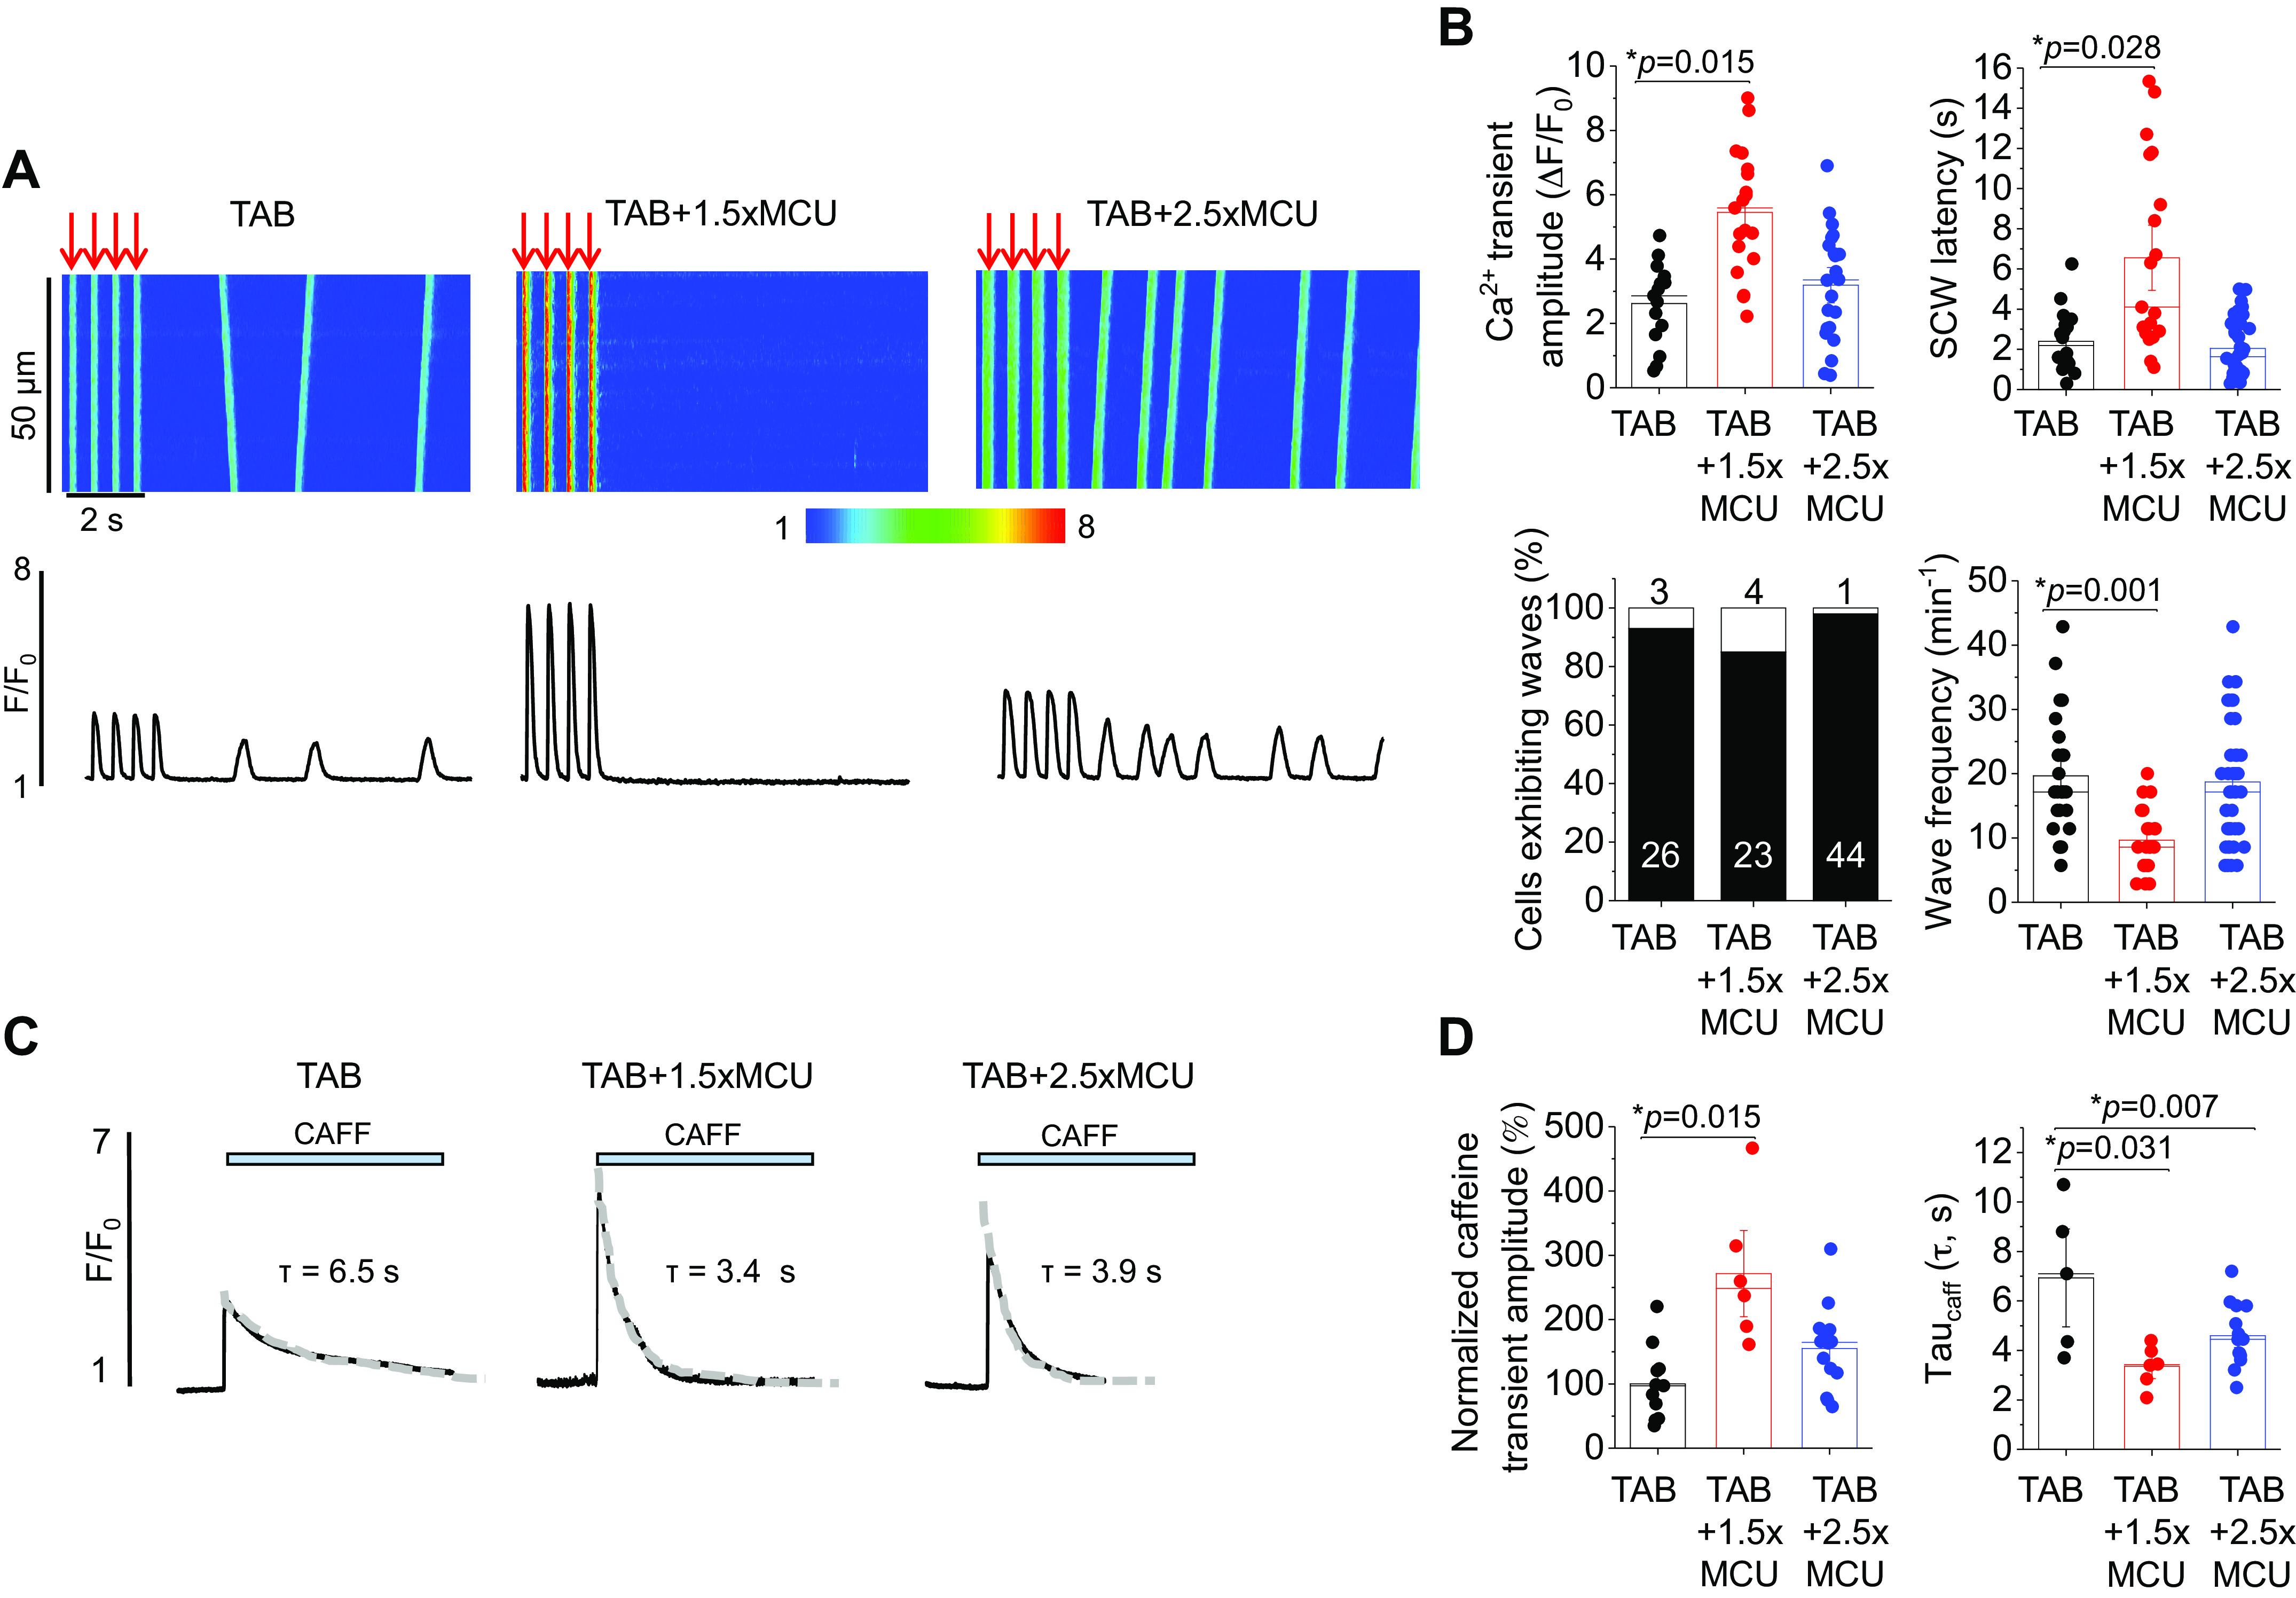
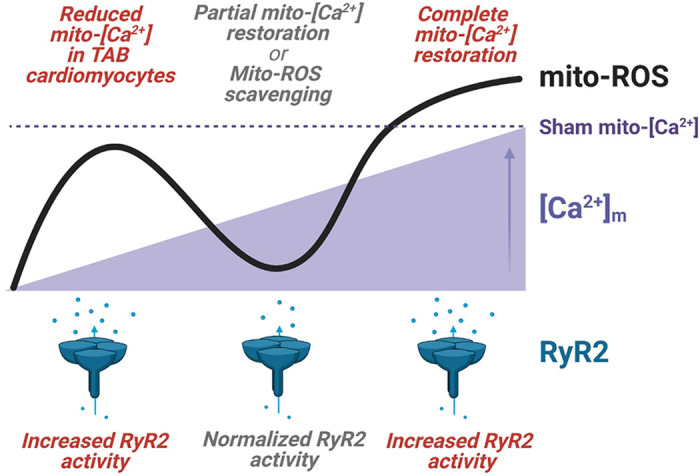
Cardiac dysfunction in heart failure (HF) and diabetic cardiomyopathy (DCM) is associated with aberrant intracellular Ca2+ handling and impaired mitochondrial function accompanied with reduced mitochondrial calcium concentration (mito-[Ca2+]). Pharmacological or genetic facilitation of mito-Ca2+ uptake was shown to restore Ca2+ transient amplitude in DCM and HF, improving contractility. However, recent reports suggest that pharmacological enhancement of mito-Ca2+ uptake can exacerbate ryanodine receptor-mediated spontaneous sarcoplasmic reticulum (SR) Ca2+ release in ventricular myocytes (VMs) from diseased animals, increasing propensity to stress-induced ventricular tachyarrhythmia. To test whether chronic recovery of mito-[Ca2+] restores systolic Ca2+ release without adverse effects in diastole, we overexpressed mitochondrial Ca2+ uniporter (MCU) in VMs from male rat hearts with hypertrophy induced by thoracic aortic banding (TAB). Measurement of mito-[Ca2+] using genetic probe mtRCamp1h revealed that mito-[Ca2+] in TAB VMs paced at 2 Hz under β-adrenergic stimulation is lower compared with shams. Adenoviral 2.5-fold MCU overexpression in TAB VMs fully restored mito-[Ca2+]. However, it failed to improve cytosolic Ca2+ handling and reduce proarrhythmic spontaneous Ca2+ waves. Furthermore, mitochondrial-targeted genetic probes MLS-HyPer7 and OMM-HyPer revealed a significant increase in emission of reactive oxygen species (ROS) in TAB VMs with 2.5-fold MCU overexpression. Conversely, 1.5-fold MCU overexpression in TABs, that led to partial restoration of mito-[Ca2+], reduced mitochondria-derived reactive oxygen species (mito-ROS) and spontaneous Ca2+ waves. Our findings emphasize the key role of elevated mito-ROS in disease-related proarrhythmic Ca2+ mishandling. These data establish nonlinear mito-[Ca2+]/mito-ROS relationship, whereby partial restoration of mito-[Ca2+] in diseased VMs is protective, whereas further enhancement of MCU-mediated Ca2+ uptake exacerbates damaging mito-ROS emission.NEW & NOTEWORTHY Defective intracellular Ca2+ homeostasis and aberrant mitochondrial function are common features in cardiac disease. Here, we directly compared potential benefits of mito-ROS scavenging and restoration of mito-Ca2+ uptake by overexpressing MCU in ventricular myocytes from hypertrophic rat hearts. Experiments using novel mito-ROS and Ca2+ biosensors demonstrated that mito-ROS scavenging rescued both cytosolic and mito-Ca2+ homeostasis, whereas moderate and high MCU overexpression demonstrated disparate effects on mito-ROS emission, with only a moderate increase in MCU being beneficial.

Keywords: calcium-dependent ventricular arrhythmia; mitochondrial calcium uniporter; mitochondrial calcium uptake; mitochondrial reactive oxygen species; ryanodine receptor.


Conflict of interest statement

No conflicts of interest, financial or otherwise, are declared by the authors.

Figures

Figure 1.
Figure 1.
Echocardiographic phenotype of rats with thoracic aortic banding. A: representative M-mode echocardiography images of age-matched sham and TAB rat hearts, 4–5 wk after banding procedure. Data shown include left ventricular posterior wall (LVPW) both in diastole (LVPWd) and systole (LVPWs), LV mass, fractional shortening, and ejection fraction. Data are presented as means ± SE. n = 12 sham animals, n = 12 TAB animals. *P < 0.05, Student’s t test. B: representative B-mode and tissue Doppler echocardiography images of sham and TAB rat hearts. Data shown include heart rate, mitral E/A ratio, mitral E/E′ ratio, mitral deceleration, isovolumetric relaxation time normalized to heart rate (IVRT/HR), and mitral valve pressure half time (MV PHT). Data are presented as means ± SE. n = 7 sham rats, n = 6 TAB rats. *P < 0.05, Student’s t test. ns, not significant; TAB, thoracic aortic banding.
Figure 2.
Figure 2.
MCU overexpression does not increased maximum mito-[Ca2+] in healthy myocytes. A: Western blots demonstrating overexpression (2.5-fold, 2.5×) of MCU in cultured sham rat VMs. Data were normalized to Hsp60 expression, and are presented as means ± SE. n = 5 sham animals, with VMs from each animal split into sham and sham + 2.5×MCU groups for culture. *P < 0.05, paired Student’s t test. B: representative confocal images of VM infected with mtRCamp1h and mtGFP, with a merged figure to demonstrate correct probe localization. C: representative traces of cultured sham and sham + 2.5×MCU VMs expressing Ca2+ biosensor mtRCamp1h. Myocytes were treated with isoproterenol (ISO, 50 nM) for 5 min before pacing at 2 Hz for 5 min. Cells were then saponin permeabilized, treated with EGTA (2 mM) for minimum fluorescence, and Ca2+ (20 µM) to obtain maximum fluorescence. Signal was converted using equation mito-[Ca2+] = 1.3 × (F-min)/(max-F). D: means ± SE of baseline mito-[Ca2+], peak mito-[Ca2+], and time to peak. n = 5 sham animals, with VMs from each animal split into sham and sham + 2.5×MCU groups for culture. n = 16 sham VMs, n = 7 sham + 2.5×MCU VMs. *P < 0.05, two-level random intercept model with Tukey’s post hoc adjustment. MCU, mitochondrial Ca2+ uniporter; mito-[Ca2+], mitochondrial calcium concentration; ns, not significant; VMs, ventricular myocytes.
Figure 3.
Figure 3.
MCU overexpression promotes proarrhythmic spontaneous Ca2+ waves and reduces SR Ca2+ content in healthy myocytes. A: confocal line scan images of cytosolic Ca2+ transients and Fluo-3 fluorescence (F/F0) profiles of isoproterenol (ISO, 50 nM)-treated sham VMs undergoing 2 Hz pace-pause protocol to induce spontaneous Ca2+ waves (SCWs). A subset of sham VMs was infected with MCU adenovirus (2.5-fold, 2.5×) to enhance mito-[Ca2+]. B: means ± SE of cytosolic Ca2+ transient amplitude at 2 Hz, SCW latency, cells exhibiting waves, and wave frequency. n = 10 sham animals, with VMs from each animal split into sham and sham + 2.5×MCU groups for culture. Cytosolic Ca2+ transient amplitude: n = 28 sham VMs, n = 21 sham + 2.5×MCU VMs. SCW latency: n = 24 sham VMs, n = 17 sham + 2.5×MCU VMs. Wave frequency: n = 24 sham VMs, n = 17 sham + 2.5×MCU VMs. *P < 0.05, two-level random intercept model with Tukey’s post hoc adjustment. C: representative images of caffeine-induced (CAFF, 10 mM) Ca2+ transients in ISO-treated (50 nM) sham and sham + 2.5×MCU VMs. D: means ± SE of caffeine-sensitive SR Ca2+ content and time constant of caffeine transient decay (tau, s). Tau was calculated by fitting fluorescence data to a monoexponential function. n = 10 sham animals, with VMs from each animal split into sham and sham + 2.5×MCU groups for culture. n = 13 sham VMs, n = 12 sham + 2.5×MCU VMs. *P < 0.05, two-level random intercept model with Tukey’s post hoc adjustment. E: Western blot demonstrating NCX1 expression in sham and sham + 2.5×MCU VMs. Data were normalized to GAPDH expression, and are presented as means ± SE. n = 6 sham animals, with VMs from each animal split into sham and sham + 2.5×MCU groups for culture. *P < 0.05, paired Student’s t test. MCU, mitochondrial Ca2+ uniporter; mito-[Ca2+], mitochondrial calcium concentration; NCX1, Na+/Ca2+ exchanger type 1; ns, not significant; SR, sarcoplasmic reticulum; VMs, ventricular myocytes.
Figure 4.
Figure 4.
MCU overexpression increases mito-ROS emission in healthy myocytes. A: representative confocal images of VM infected with MLS-HyPer7 and mtRFP, with a merged figure to demonstrate correct probe localization. B: representative images of VMs infected with MLS-HyPer7, and treated with DTT (5 mM) followed by DTDP (200 µmol/L) to achieve minimum and maximum fluorescence, demonstrating sensitivity of the ratiometric probe. C: representative traces of MLS-HyPer7 fluorescence from cultured sham VMs. One subset of VMs was infected with MCU adenovirus (2.5-fold, 2.5×) to enhance mito-[Ca2+]. Cells were treated with isoproterenol (ISO, 50 nM) for 5 min, before being paced at 2 Hz for a further 5 min. Fluorescence was normalized to minimum (DTT, 5 mM) and maximum (200 µM) fluorescence. D: means ± SE for MLS-HyPer7 fluorescence. n = 7 sham animals, with VMs from each animal split into sham and sham + 2.5×MCU groups for culture. n = 19 sham VMs, n = 15 sham + 2.5×MCU VMs. *P < 0.05, two-level random intercept model with Tukey’s post hoc adjustment. DTDP, deoxythymidine diphosphate; DTT, dithiothreitol; mito-[Ca2+], mitochondrial calcium concentration; MCU, mitochondrial Ca2+ uniporter; VMs, ventricular myocytes.
Figure 5.
Figure 5.
2.5-fold MCU overexpression completely restores mito-[Ca2+] in hypertrophic myocytes. A: Western blots demonstrating expression of MCU in cultured sham and TAB rat VMs. Data were normalized to Hsp60 expression, and are presented as means ± SE. B: n = 5 sham, n = 4 TAB animals. *P < 0.05, Student’s t test. B: Western blots demonstrating adenoviral overexpression of MCU (2.5-fold, 2.5×) in cultured TAB VMs. Data were normalized to Hsp60 expression, and are presented as means ± SE. n = 6 sham animals, n = 6 TAB animals, with VMs from each TAB animal split into TAB and TAB + 2.5×MCU groups for culture. *P < 0.05, one-way ANOVA with Bonferroni post hoc adjustment. C: representative traces of cultured sham and TAB VMs expressing Ca2+ biosensor mtRCamp1h. One subset of TAB VMs were infected with MCU adenovirus to enhance mito-[Ca2+], and another was pretreated with mito-ROS scavenger mitoTEMPO (20 µM, 5 min). Myocytes were treated with isoproterenol (ISO, 50 nM) for 5 min before pacing at 2 Hz for 5 min. Cells were then saponin permeabilized, treated with EGTA (2 mM) for minimum fluorescence, and Ca2+ (20 µM) to obtain maximum fluorescence. Signal was converted using equation mito-[Ca2+] = 1.3 × (F-min)/(max-F). D: means ± SE of baseline mito-[Ca2+], peak mito-[Ca2+], and time to peak. n = 5 sham animals, n = 5 TAB animals, with VMs from each TAB animal split into TAB, TAB + 2.5×MCU, and TAB+MT groups for culture. n = 16 sham VMs, n = 17 TAB VMs, n = 8 TAB + 2.5×MCU VMs, n = 13 TAB+MT VMs. *P < 0.05, two-level random intercept model with Tukey’s post hoc adjustment. MCU, mitochondrial Ca2+ uniporter; mito-[Ca2+], mitochondrial calcium concentration; mito-ROS, mitochondria-derived reactive oxygen species; ns, not significant; TAB, thoracic aortic banding; VMs, ventricular myocytes.
Figure 6.
Figure 6.
Complete restoration of mito-[Ca2+] does not restore defective Ca2+ homeostasis in hypertrophic myocytes. A: confocal line scan images of Ca2+ transients and Fluo-3 fluorescence (F/F0) profiles of isoproterenol (ISO, 50 nM)-treated sham and TAB rat VMs undergoing 2 Hz pace-pause protocol to induce spontaneous Ca2+ waves (SCWs). One subset of TAB VMs were infected with MCU adenovirus (2.5×) to enhance mito-[Ca2+], and another were pretreated with mito-ROS scavenger mitoTEMPO (MT, 20 µM, 5 min). B: means ± SE of cytosolic Ca2+ transient amplitude at 2 Hz, SCW latency, cells exhibiting waves, and wave frequency. n = 10 sham animals, n = 6 TAB animals, with VMs from each TAB animal split into TAB, TAB + 2.5×MCU, and TAB+MT groups for culture. Cytosolic Ca2+ transient amplitude and SCW latency: n = 28 sham VMs, n = 15 TAB VMs, n = 22 TAB + 2.5×MCU VMs, n = 11 TAB+MT VMs. Wave frequency: n = 24 sham VMs, n = 26 TAB VMs, n = 44 TAB + 2.5×MCU VMs, n = 15 TAB+MT VMs. *P < 0.05, two-level random intercept model with Tukey’s post hoc adjustment. MCU, mitochondrial Ca2+ uniporter; mito-[Ca2+], mitochondrial calcium concentration; mito-ROS, mitochondria-derived reactive oxygen species; TAB, thoracic aortic banding; VMs, ventricular myocytes.
Figure 7.
Figure 7.
Complete restoration of mito-[Ca2+] does not restore SR Ca2+ content in hypertrophic myocytes. A: representative images of caffeine-induced (CAFF, 10 mM) Ca2+ transients in isoproterenol (ISO, 50 nM)-treated sham and TAB VMs. One subset of TAB VMs were infected with MCU adenovirus (2.5×) to enhance mito-[Ca2+], and another were pretreated with mito-ROS scavenger mitoTEMPO (MT, 20 µM, 5 min). B: means ± SE of caffeine-sensitive SR Ca2+ content and time constant (tau, s) of caffeine transient decay. Tau was calculated by fitting fluorescence data to a monoexponential function. n = 10 sham animals, n = 6 TAB animals, with VMs from each TAB animal split into TAB, TAB + 2.5×MCU, and TAB+MT groups for culture. n = 14 sham VMs, n = 11 TAB VMs, n = 14 TAB + 2.5×MCU VMs, n = 8 TAB+MT VMs. *P < 0.05, two-level random intercept model with Tukey’s post hoc adjustment. C: Western blot demonstrating NCX1 expression in sham and sham + 2.5×MCU VMs. Data were normalized to GAPDH expression, and are presented as means ± SE. n = 5 sham animals, n = 5 TAB animals. *P < 0.05 Student’s t test. MCU, mitochondrial Ca2+ uniporter; mito-[Ca2+], mitochondrial calcium concentration; NCX1, Na+/Ca2+ exchanger type 1; ns, not significant; SR, sarcoplasmic reticulum; TAB, thoracic aortic banding; VMs, ventricular myocytes.
Figure 8.
Figure 8.
Complete mito-[Ca2+] restoration does not reduce RyR2-mediated SR Ca2+ leak. A: representative images of VM infected with G-CEPIA1er adenovirus demonstrating probe sensitivity. Myocytes were treated with SERCa2a inhibitor thapsigargin (THAPS, 2 µM) and high-dose caffeine (CAFF, 10 mM) to inhibit SR Ca2+ uptake and deplete the store. B: representative time-dependent profiles (F/F0) of isoproterenol (ISO, 50 nM)-treated sham and TAB VMs. One subset of TAB VMs were infected with MCU adenovirus (2.5×) to enhance mito-[Ca2+], and another were pretreated with mito-ROS scavenger mitoTEMPO (MT, 20 µM, 5 min). Myocytes were perfused with ISO for 5 min before recording. Fluorescence was recorded for 30 s before application of THAPS, and the time constant of decay (tau, s) was calculated as a measure of RyR2-mediated SR Ca2+ leak, by fitting fluorescence data to a monoexponential function. G-CEPIA1er fluorescence was normalized to minimal fluorescence signal obtained by application of high-dose caffeine to empty the SR at the end of the experiment. C: means ± SE of tau of decay. n = 6 sham animals, n = 7 TAB animals, with VMs from each TAB animal split into TAB, TAB + 2.5×MCU, and TAB+MT groups for culture. n = 11 sham VMs, n = 11 TAB VMs, n = 16 TAB + 2.5×MCU VMs, n = 9 TAB+MT VMs. *P < 0.05, two-level random intercept model with Tukey’s post hoc adjustment. MCU, mitochondrial Ca2+ uniporter; mito-[Ca2+], mitochondrial calcium concentration; mito-ROS, mitochondria-derived reactive oxygen species; ns, not significant; RyR2, ryanodine receptor type 2; SR, sarcoplasmic reticulum; TAB, thoracic aortic banding; VMs, ventricular myocytes.
Figure 9.
Figure 9.
Complete restoration of mito-[Ca2+] in hypertrophic myocytes increases mito-ROS. A: representative traces of MLS-HyPer7 fluorescence from cultured sham and TAB VMs. One subset of TAB VMs were infected with MCU adenovirus to enhance mito-[Ca2+], and another were pretreated with mito-ROS scavenger mitoTEMPO (20 µM, 5 min). Cells were treated with isoproterenol (ISO, 50 nM) for 5 min, before being paced at 2 Hz for a further 5 min. Fluorescence was normalized to minimum (DTT, 5 mM) and maximum (200 µM) fluorescence. B: means ± SE for MLS-HyPer7 fluorescence. n = 6 sham animals, n = 3 TAB animals, with VMs from each TAB animal split into TAB, TAB + 2.5×MCU, and TAB+MT groups for culture. n = 19 sham VMs, n = 14 TAB VMs, n = 7 TAB+MCU VMs, n = 5 TAB+MT VMs. *P < 0.05, two-level random intercept model with Tukey’s post hoc adjustment. C: representative confocal images of VM infected with OMM-HyPer and mtRFP, with a merged figure to demonstrate correct probe localization. D: representative traces of OMM-HyPer fluorescence from cultured sham and TAB VMs. The same recording protocol was followed as for MLS-HyPer7. E: means ± SE for OMM-HyPer fluorescence. n = 6 sham, 6 TAB animals, n = 19 sham VMs, 12 TAB VMs, 9 TAB+MCU VMs, 7 TAB+MT VMs. *P < 0.05, two-level random intercept model with Tukey’s post hoc adjustment. DTT, dithiothreitol; MCU, mitochondrial Ca2+ uniporter; mito-[Ca2+], mitochondrial calcium concentration; mito-ROS, mitochondria-derived reactive oxygen species; TAB, thoracic aortic banding; VMs, ventricular myocytes.
Figure 10.
Figure 10.
Partial restoration of mito-[Ca2+] with 1.5-fold MCU overexpression reduces mito-ROS in hypertrophic myocytes. A: Western blots demonstrating modest (1.5-fold, 1.5×) and high (2.5-fold, 2.5×) adenoviral overexpression of MCU in cultured TAB VMs. Data were normalized to Hsp60 expression, and are presented as means ± SE. n = 5 TAB animals, with VMs from each TAB animal split into TAB, TAB + 1.5×MCU, and TAB + 2.5×MCU groups for culture. *P < 0.05, one-way ANOVA with Bonferroni post hoc adjustment. B: representative traces of cultured TAB VMs expressing Ca2+ biosensor mtRCamp1h. One subset of TAB VMs were infected with 1.5×MCU and another 2.5×MCU. Myocytes were treated with isoproterenol (ISO, 50 nM) for 5 min before pacing at 2 Hz for 5 min. Cells were then saponin permeabilized, treated with EGTA (2 mM) for minimum fluorescence, and Ca2+ (20 µM) to obtain maximum fluorescence. Signal was converted using equation mito-[Ca2+] = 1.3 × (F-min)/(max-F). C: means ± SE of baseline mito-[Ca2+], peak mito-[Ca2+], and time to peak. n = 8 TAB animals, with VMs from animals split into TAB, TAB + 1.5×MCU, and TAB + 2.5×MCU groups for culture. n = 17 TAB VMs, n = 10 TAB + 1.5×MCU VMs, n = 8 TAB + 2.5×MCU VMs. *P < 0.05, two level random intercept model with Tukey’s post hoc adjustment. D: representative traces of MLS-HyPer7 fluorescence from cultured TAB VMs. Cells were treated with isoproterenol (ISO, 50 nM) for 5 min, before being paced at 2 Hz for a further 5 min. Fluorescence was normalized to minimum (DTT, 5 mM) and maximum (200 µM) fluorescence. E: means ± SE for MLS-HyPer7 fluorescence. n = 6 TAB animals, with VMs from each TAB animal split into TAB, TAB + 1.5×MCU, and TAB + 2.5×MCU groups for culture. n = 14 TAB VMs, n = 14 TAB + 1.5×MCU VMs, n = 7 TAB + 2.5×MCU VMs. *P < 0.05, two level random intercept model with Tukey’s post hoc adjustment. DTT, dithiothreitol; MCU, mitochondrial Ca2+ uniporter; mito-[Ca2+], mitochondrial calcium concentration; mito-ROS, mitochondria-derived reactive oxygen species; ns, not significant; TAB, thoracic aortic banding; VMs, ventricular myocytes.
Figure 11.
Figure 11.
Partial restoration of mito-[Ca2+] attenuates defective Ca2+ homeostasis in hypertrophic myocytes. A: confocal line scan images of Ca2+ transients and Fluo-3 fluorescence (F/F0) profiles of isoproterenol (ISO, 50 nM)-treated TAB rat VMs undergoing 2 Hz pace-pause protocol to induce spontaneous Ca2+ waves (SCWs). One subset of TAB VMs were infected with 1.5-fold (1.5×) MCU, and another 2.5-fold (2.5×) MCU. B: means ± SE of cytosolic Ca2+ transient amplitude at 2 Hz, SCW latency, cells exhibiting waves, and wave frequency. n = 9 TAB animals, with VMs from each TAB animal split into TAB, TAB + 1.5×MCU, and TAB + 2.5×MCU groups for culture. Cytosolic Ca2+ transient amplitude and SCW latency: n = 15 TAB VMs, n = 19 TAB + 1.5×MCU VMs, n = 22 TAB + 2.5×MCU VMs. Wave frequency: n = 26 TAB VMs, n = 23 TAB + 1.5×MCU VMs, n = 44 TAB + 2.5×MCU VMs. *P < 0.05, two-level random intercept model with Tukey’s post hoc adjustment. C: representative images of caffeine-induced (CAFF, 10 mM) Ca2+ transients in isoproterenol (ISO, 50 nM)-treated sham and TAB VMs. One subset of TAB VMs were infected with 1.5-fold (1.5×) MCU, and another 2.5-fold (2.5×) MCU. D: means ± SE of caffeine-sensitive SR Ca2+ content and time constant (tau, s) of caffeine transient decay. Tau was calculated by fitting fluorescence data to a monoexponential function. n = 6 TAB animals, with VMs from each TAB animal split into TAB, TAB + 1.5×MCU, and TAB + 2.5×MCU groups for culture. n = 11 TAB VMs, n = 6 TAB + 1.5×MCU VMs, n = 14 TAB + 2.5×MCU VMs. *P < 0.05, two-level random intercept model with Tukey’s post hoc adjustment. MCU, mitochondrial Ca2+ uniporter; mito-[Ca2+], mitochondrial calcium concentration; SR, sarcoplasmic reticulum; TAB, thoracic aortic banding; VMs, ventricular myocytes.
Figure 12.
Figure 12.
The relationship between mito-[Ca2+], mito-ROS and RyR2 activity in hypertrophic myocytes. In TAB VMs under β-adrenergic stimulation, reduced mito-[Ca2+] levels are associated with increased mito-ROS production and increased RyR2 activity. Partial normalization of mito-[Ca2+] with modest MCU overexpression, or scavenging of mito-ROS with mitoTEMPO, can reduce mito-ROS emission and normalizes RyR2 activity. Complete restoration of mito-[Ca2+] with high MCU overexpression to sham levels significantly augments mito-ROS emission and increases proarrhythmic RyR2 activity. Figure created using Biorender.com. MCU, mitochondrial Ca2+ uniporter; mito-[Ca2+], mitochondrial calcium concentration; mito-ROS, mitochondria-derived reactive oxygen species; RyR2, ryanodine receptor type 2; TAB, thoracic aortic banding; VMs, ventricular myocytes.

References

    1. Brown DA, O'Rourke B. Cardiac mitochondria and arrhythmias. Cardiovasc Res 88: 241–249, 2010. doi:10.1093/cvr/cvq231. - DOI - PMC - PubMed
    1. Cortassa S, Juhaszova M, Aon MA, Zorov DB, Sollott SJ. Mitochondrial Ca2+, redox environment and ROS emission in heart failure: two sides of the same coin? J Mol Cell Cardiol 151: 113–125, 2021. doi:10.1016/j.yjmcc.2020.11.013. - DOI - PMC - PubMed
    1. Dillmann WH. Diabetic cardiomyopathy. Circ Res 124: 1160–1162, 2019. doi:10.1161/CIRCRESAHA.118.314665. - DOI - PMC - PubMed
    1. Hamilton S, Terentyeva R, Kim TY, Bronk P, Clements RT, O-Uchi J, Csordás G, Choi BR, Terentyev D. Pharmacological modulation of mitochondrial Ca2+ content regulates sarcoplasmic reticulum Ca2+ release via oxidation of the ryanodine receptor by mitochondria-derived reactive oxygen species. Front Physiol 9: 1831, 2018. doi:10.3389/fphys.2018.01831. - DOI - PMC - PubMed
    1. Hamilton S, Terentyev D. Proarrhythmic remodeling of calcium homeostasis in cardiac disease; implications for diabetes and obesity. Front Physiol 9: 1517, 2018. doi:10.3389/fphys.2018.01517. - DOI - PMC - PubMed

Publication types

MeSH terms