Review
. 2022 Oct;29(6-7):e12726.
doi: 10.1111/micc.12726. Epub 2021 Aug 29.

Capturing membrane trafficking events during 3D angiogenic development in vitro

Affiliations
Review

Capturing membrane trafficking events during 3D angiogenic development in vitro

Caitlin R Francis et al. Microcirculation. 2022 Oct.

Abstract

Objectives: Vesicular trafficking dictates protein localization, functional activity, and half-life, providing a critically important regulatory step in tissue development; however, there is little information detailing endothelial-specific trafficking signatures. This is due, in part, to limitations in visualizing trafficking events in endothelial tissues. Our aim in this investigation was to explore the use of a 3-dimensional (3D) in vitro sprouting model to image endothelial membrane trafficking events.

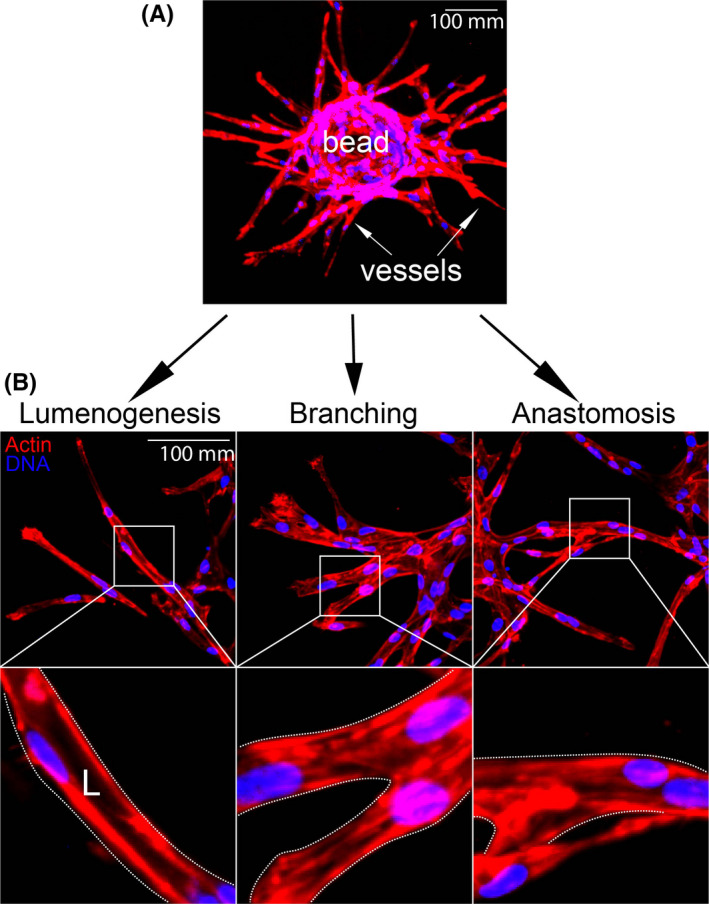
Methods: Endothelial cells were challenged to grow sprouts in a fibrin bead assay. Thereafter, spouts were transfected with fluorescent proteins and stained for various cell markers. Sprouts were then imaged for trafficking events using live and fixed-cell microscopy.

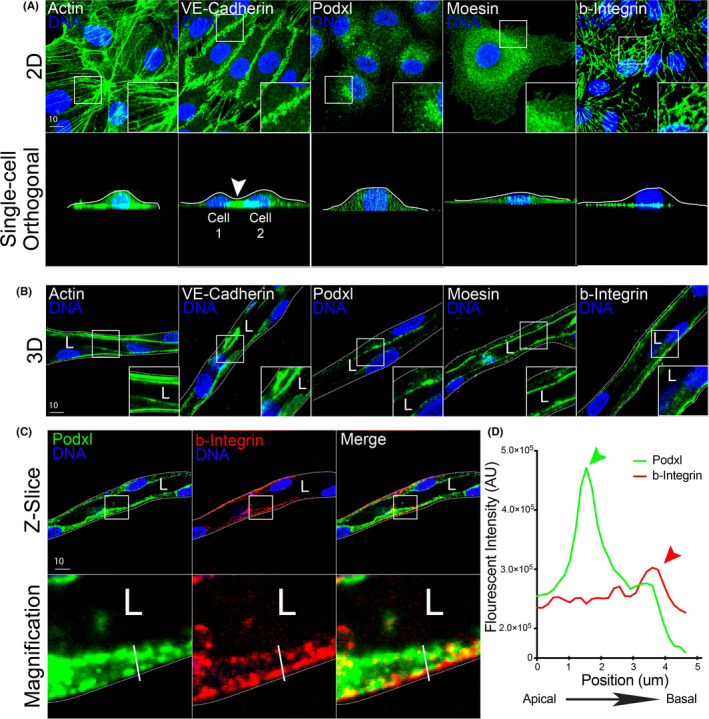
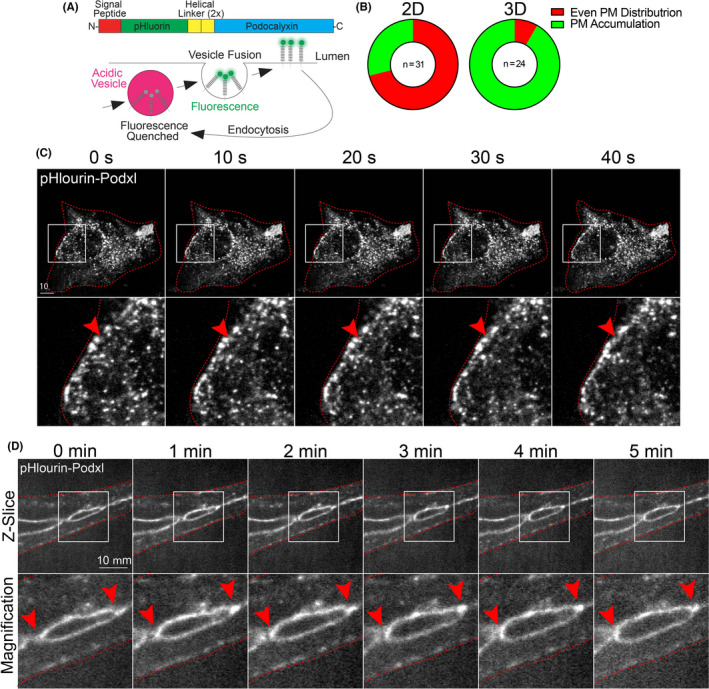
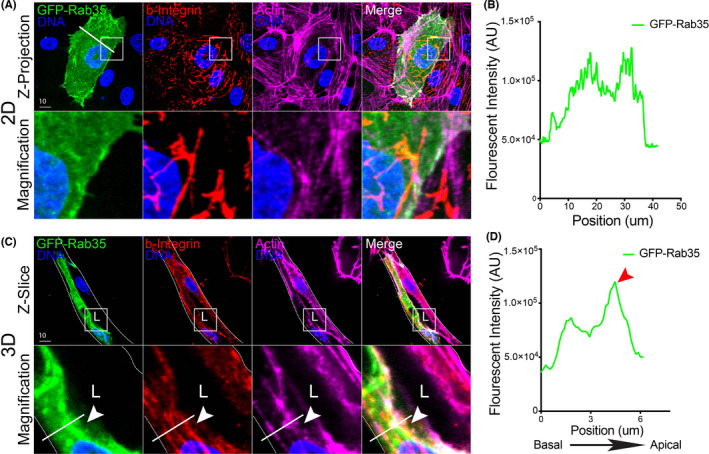
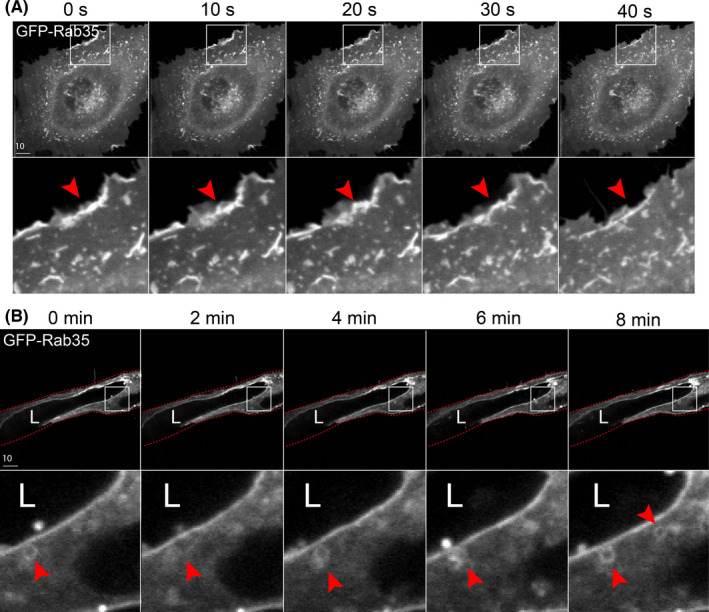
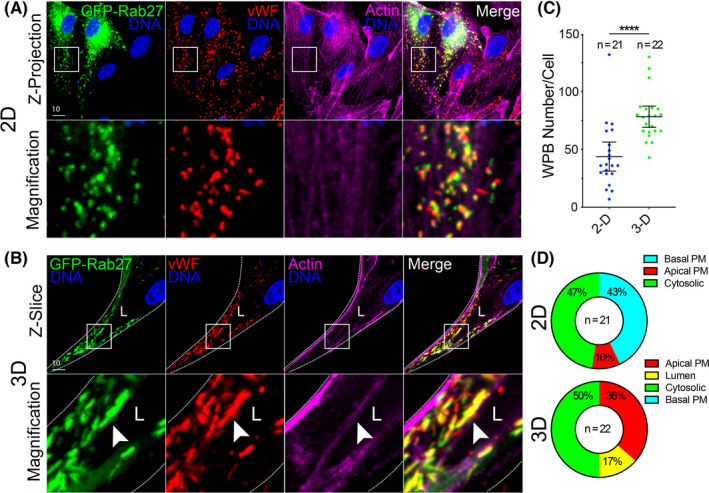
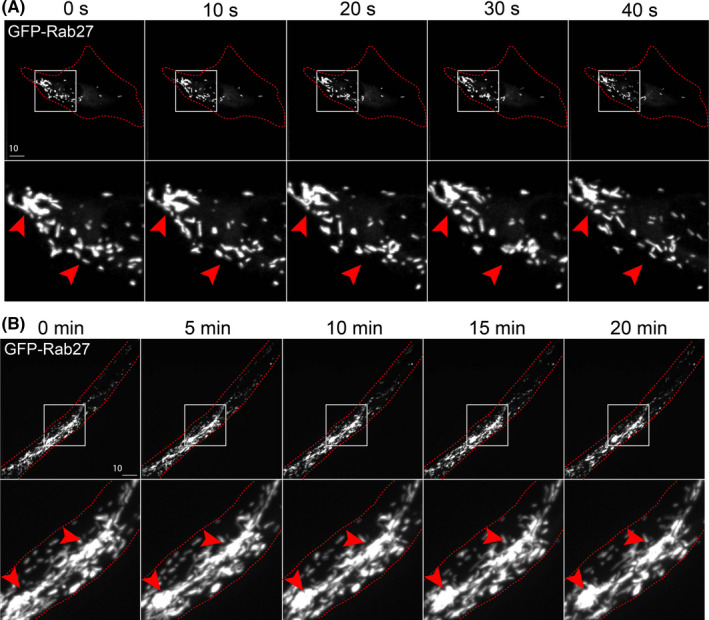
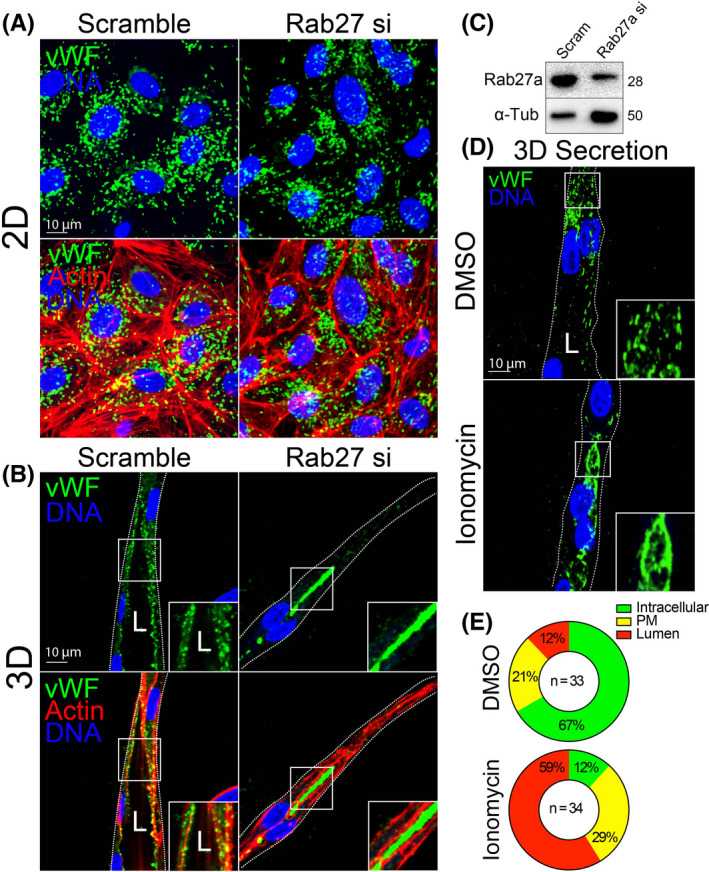
Results: Our results demonstrate that fibrin bead sprouts have a strong apicobasal polarity marked by apical localization of proteins moesin and podocalyxin. Comparison of trafficking mediators Rab27a and Rab35 between 3D sprouts and 2D culture showed that vesicular carriers can be imaged at high resolution, exhibiting proper membrane polarity solely in 3D sprouts. Lastly, we imaged exocytic events of von Willebrand Factor and demonstrated a distinct imaging advantage for monitoring secretion events in 3D sprouts as compared with 2D culture.

Conclusions: Our results establish that the fibrin bead sprouting assay is well-suited for imaging of trafficking events during angiogenic growth.

Keywords: Rab27a; Weibel-Palade body; angiogenesis; apical membrane; blood vessel; development; endothelial; endothelium; exocytosis; imaging; lumen; sprouting; trafficking; vascular; vesicle; von Willebrand factor.


Conflict of interest statement

None.

Figures

FIGURE 1
FIGURE 1
Fibrin bead assay recapitulates angiogenic traits in vitro. Top: representative image of embedded fibrin bead after 4 days of growth. Bottom: representative images of lumenogenesis, branching, and anastomosis with magnifications (boxes). L denotes lumen [Colour figure can be viewed at wileyonlinelibrary.com]
FIGURE 2
FIGURE 2
Comparison of cell polarity markers in 2D culture and 3D sprouts. (A) Representative images of endothelial cell cultured on 2D surface (top panels) and axial view (xz plane, bottom panels). Cells were stained with actin (cytoskeleton), VE‐cadherin (cell junctions), podocalyxin (Podxl, apical membrane), moesin (apical membrane), and beta‐1 integrin (b‐integrin, basal membrane). White lines mark apical surface and arrowhead denotes junction between two cells. (B) Representative images of fibrin bead generated sprouts stained for indicated proteins. (C) Representative imaging showing co‐staining of Podxl and b‐integrin within the same sprout cross‐section to highlight differences in apical and basal domains. (D) Line scan illustrating peaks in fluorescent intensity of podxl and b‐Integrin relative to apical and basal domains. The green arrowhead denotes peak of podxl and red arrowhead denotes peak of b‐Integrin. The white line in panel (C) denotes the line scan area. White boxes are areas of magnification and while dotted lines indicated sprout boundaries. L denotes lumen [Colour figure can be viewed at wileyonlinelibrary.com]
FIGURE 3
FIGURE 3
Live imaging of podocalyxin trafficking in 2D culture and 3D sprouts. (A) Structure of engineered pHluorin‐Podxl fusion protein. In acidified vesicles, pHluorin fluorescence is significantly quenched. However, once inserted on the plasma membrane at neutral pH, fluorescence is rescued allowing for visualization of plasma membrane insertion. (B) Graph showing percentages of pHluorin‐Podxl with either even or punctate plasma membrane (PM) distribution. (C) Live imaging of 2D cell expressing pHluorin‐Podxl over time. Red arrowheads denote puncta accumulated at the leading edge of the cell. (D) Live imaging of fibrin bead generated sprout expressing pHluorin‐Podxl over time. Red arrowheads indicate active areas of lumen expansion where Podxl is accumulating. White boxes are areas of magnification and red lines indicated sprout boundaries. L denotes lumen [Colour figure can be viewed at wileyonlinelibrary.com]
FIGURE 4
FIGURE 4
Visualizing Rab35 GTPase localization in 2D culture and 3D sprouts. (A) Representative image of endothelial cell expressing GFP‐Rab35, stained for beta‐1 integrin (b‐integrin) and actin in 2D. Lower panels are magnification. While line is line scan area. (B) Line scan of Rab35 intensity in panel (A). White line across cell in panel (A) represents line scan location. (C) Representative image of fibrin bead sprout expressing GFP‐Rab35, stained for b‐integrin and actin. Arrowhead indicates Rab35 accumulation at apical membrane. While line is line scan area. (D) Line scan of Rab35 intensity in panel (C). Red arrowhead indicates border of apical membrane. White boxes are areas of magnification and while dotted lines indicated sprout boundaries. L denotes lumen [Colour figure can be viewed at wileyonlinelibrary.com]
FIGURE 5
FIGURE 5
Live imaging of Rab35 trafficking in 2D culture and 3D sprouts. (A) Live imaging of cell expressing GFP‐Rab35 over time. Red arrowheads denote puncta accumulated at the leading edge of the cell. (B) Live imaging of fibrin bead generated sprout expressing GFP‐Rab35 over time. Red arrowheads indicate small endosome movements. White boxes are areas of magnification and red lines indicated sprout boundaries. L denotes lumen [Colour figure can be viewed at wileyonlinelibrary.com]
FIGURE 6
FIGURE 6
Imaging vWF exocytosis in 2D culture and 3D sprouts. (A) Representative images of endothelial cells in 2D culture expressing GFP‐Rab27a and stained for von Willebrand Factor (vWF) and actin. (B) Representative images of a sprout expressing GFP‐Rab27a and stained for vWF and actin. White arrowhead denotes Weibel‐Palade Body accumulation. (C) Quantification of the number of vWF puncta between 2D culture and 3D sprouts. (D) Percentage of vWF accumulations (≥4 vWF puncta) that localize to a particular cellular location. PM = plasma membrane. N = number of cells. White boxes are areas of magnification and white dotted lines indicated sprout boundaries. L denotes lumen. Values are means ± SEM; significance: ****< .0001. Statistical significance was assessed with an unpaired Students t test [Colour figure can be viewed at wileyonlinelibrary.com]
FIGURE 7
FIGURE 7
Live imaging of Weibel‐Palade Body trafficking in 2D culture and 3D sprouting. (A) Live imaging of endothelial cells expressing GFP‐Rab27a (Weibel‐Palade Body marker) over time in 2D culture. Red arrowheads denote puncta accumulated at the leading edge of the cell. (B) Live imaging of fibrin bead generated sprout expressing GFP‐Rab27a over time. Red arrowheads indicate accumulations of Weibel‐Palade Bodies at cell‐cell interface. White boxes are areas of magnification and red botted lines indicated cell boundaries. L denotes lumen [Colour figure can be viewed at wileyonlinelibrary.com]
FIGURE 8
FIGURE 8
Monitoring exocytic events between 2D culture and 3D sprouting. (A) Representative 2D culture of endothelial cells stained for von Willebrand Factor (vWF) and actin treated with scramble or Rab27a‐targeting siRNA (si). (B) Representative 3D fibrin bead generated sprout stained for vWF and actin treated with scramble or Rab27a‐targeting siRNA. (C) Western blot confirmation of Rab27a knockdown efficiency. (D) Representative 3D fibrin bead generated sprout stained for vWF and treated with DMSO (vehicle) or ionomycin to induced Weibel‐Palade Body exocytosis. (E) Percentage of intracellular or lumen trapped vWF between indicated conditions. N = number of cells. White boxes are areas of magnification and white dotted lines indicated sprout boundaries. L denotes lumen [Colour figure can be viewed at wileyonlinelibrary.com]

References

    1. Bussmann J, Wolfe SA, Siekmann AF. Arterial‐venous network formation during brain vascularization involves hemodynamic regulation of chemokine signaling. Development. 2011;138(9):1717‐1726. - PMC - PubMed
    1. Kushner EJ, Bautch VL. Building blood vessels in development and disease. Curr Opin Hematol. 2013;20(3):231‐236. - PubMed
    1. Farquhar MG. Multiple pathways of exocytosis, endocytosis, and membrane recycling: validation of a Golgi route. Fed Proc. 1983;42(8):2407‐2413. - PubMed
    1. Orzech E, Cohen S, Weiss A, Aroeti B. Interactions between the exocytic and endocytic pathways in polarized Madin‐Darby canine kidney cells. J Biol Chem. 2000;275(20):15207‐15219. - PubMed
    1. Foley K, Boguslavsky S, Klip A. Endocytosis, recycling, and regulated exocytosis of glucose transporter 4. Biochemistry. 2011;50(15):3048‐3061. - PubMed

Publication types

MeSH terms