

Should international borders re-open? The impact of travel restrictions on COVID-19 importation risk
- PMID: 34416860
- PMCID: PMC8378112
- DOI: 10.1186/s12889-021-11616-9
Should international borders re-open? The impact of travel restrictions on COVID-19 importation risk
Abstract
Background: Novel coronavirus disease (COVID-19) has spread across the world at an unprecedented pace, reaching over 200 countries and territories in less than three months. In response, many governments denied entry to travellers arriving from various countries affected by the virus. While several industries continue to experience economic losses due to the imposed interventions, it is unclear whether the different travel restrictions were successful in reducing COVID-19 importations.
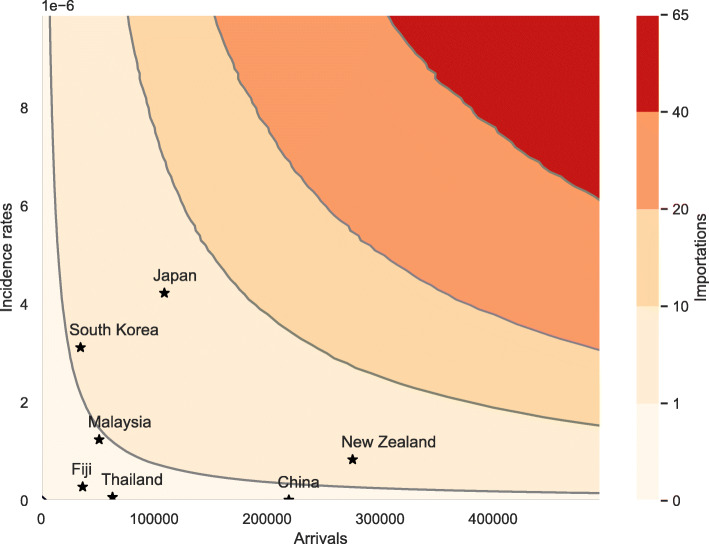
Methods: Here we develop a comprehensive probabilistic framework to model daily COVID-19 importations, considering different travel bans. We quantify the temporal effects of the restrictions and elucidate the relationship between incidence rates in other countries, travel flows and the expected number of importations into the country under investigation.
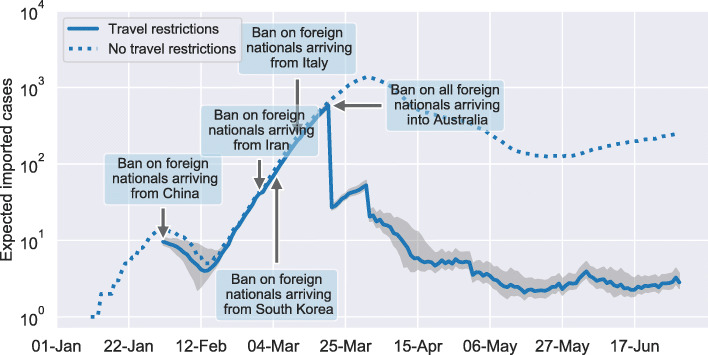
Results: As a cases study, we evaluate the travel bans enforced by the Australian government. We find that international travel bans in Australia lowered COVID-19 importations by 87.68% (83.39 - 91.35) between January and June 2020. The presented framework can further be used to gain insights into how many importations to expect should borders re-open.
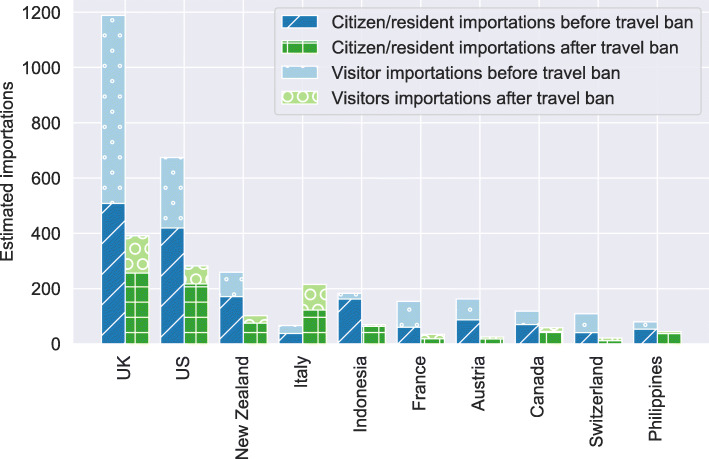
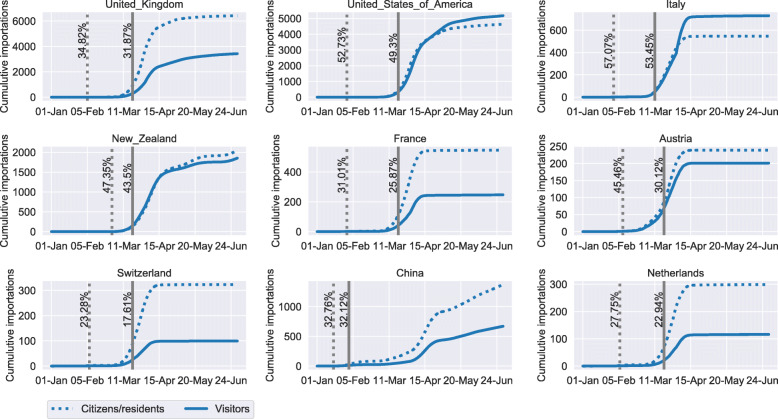
Conclusions: While travel bans lowered the number of COVID-19 importations overall, the effectiveness of bans on individual countries varies widely and directly depends on the change in behaviour in returning residents and citizens. Authorities may consider the presented information when planning a phased re-opening of international borders.
Keywords: COVID-19; Disease modelling; Infectious disease spread; Travel restrictions.
© 2021. The Author(s).
Conflict of interest statement
The authors declare that they have no competing interests.
Figures
References
-
- World Health Organisation. Coronavirus disease 2019 (COVID-19) situation report – 51. Technical report. 2020. https://www.who.int/emergencies/diseases/novel-coronavirus-2019/situatio....
-
- Gössling S, Scott D, Hall C. Pandemics, tourism and global change: A rapid assessment of COVID-19. J Sustain Tour. 2020:1–20. 10.1080/09669582.2020.1758708.
-
- Box G, Jenkins G. Time Series Analysis: Forecasting and Control. San Francisco: Holden-Day; 1970.
-
- Jagodnik K, Ray F, Giorgi F, Lachmann A. Correcting under-reported COVID-19 case numbers: Estimating the true scale of the pandemic. medRxiv. 2020. 10.1101/2020.03.14.20036178.
MeSH terms
LinkOut - more resources
Full Text Sources
Medical
Research Materials
