. 2021 Aug 20;7(34):eabf3126.
doi: 10.1126/sciadv.abf3126. Print 2021 Aug.

Subsynaptic positioning of AMPARs by LRRTM2 controls synaptic strength

Affiliations

Subsynaptic positioning of AMPARs by LRRTM2 controls synaptic strength

Austin M Ramsey et al. Sci Adv. .

Abstract

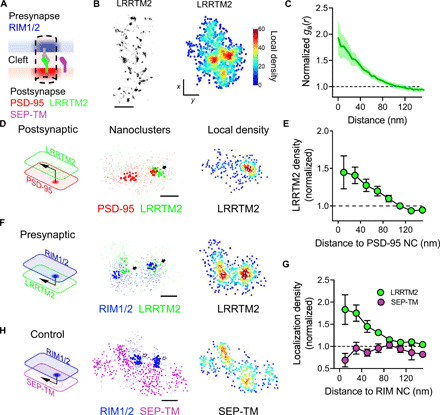
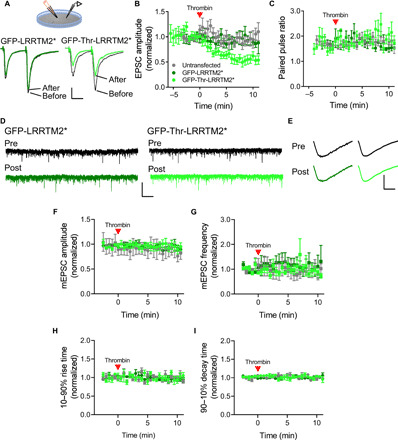
Recent evidence suggests that nano-organization of proteins within synapses may control the strength of communication between neurons in the brain. The unique subsynaptic distribution of glutamate receptors, which cluster in nanoalignment with presynaptic sites of glutamate release, supports this hypothesis. However, testing it has been difficult because mechanisms controlling subsynaptic organization remain unknown. Reasoning that transcellular interactions could position AMPA receptors (AMPARs), we targeted a key transsynaptic adhesion molecule implicated in controlling AMPAR number, LRRTM2, using engineered, rapid proteolysis. Severing the LRRTM2 extracellular domain led quickly to nanoscale declustering of AMPARs away from release sites, not prompting their escape from synapses until much later. This rapid remodeling of AMPAR position produced significant deficits in evoked, but not spontaneous, postsynaptic receptor activation. These results dissociate receptor numbers from their nanopositioning in determination of synaptic function and support the novel concept that adhesion molecules acutely position receptors to dynamically control synaptic strength.


Figures

Fig. 1
Fig. 1. Acute and specific cleavage of the LRRTM2 extracellular domain.
(A) Schematic demonstrating the juxtamembrane insertion of the thrombin recognition sequence (38) and the N-terminal GFP* denotes co-packaging of an shRNA (33) that targets endogenous LRRTM2 expressed in the same vector as GFP-Thr-LRRTM2. LNS, laminin/neurexin/sex hormone-binding globulin-domain. (B) Expression of GFP-Thr-LRRTM2* in cultured hippocampal neurons and immunostaining of endogenous PSD-95 and RIM1/2 visualized by confocal microscopy. Scale bars, (left) 30 μm and (right) 10 μm. (C) Quantification of the colocalization between expressed GFP-Thr-LRRTM2*, RIM1/2, and PSD-95. (n = 120 synapses/6 neurons/2 independent cultures per condition). (D) Quantification of Bassoon recruitment by LRRTM2 in an HEK-neuron coculture synaptogenesis assay alongside positive [cyan fluorescent protein (CFP)–NL-1] and negative (CFP alone) controls. CFP alone (n = 30 cells per two independent cultures), CFP–NL-1 (n = 34/2), BRS-Thr-LRRTM2* (n = 24/2), GFP-Thr-LRRTM2* (n = 25/2), and GFP-LRRTM2* (n = 32/2). (E) Quantification of PSD-95 puncta density in neurons expressing GFP-Thr-LRRTM2* (KDR; n = 19 neurons/3 independent cultures), GFP-Thr-LRRTM2 (OE; n = 16/3), or cytosolic mCerulean3 (Cer3; n = 15/3). (F) Quantification of spine density (n = 10 neurons per three independent cultures per condition). (G) Quantification of spine length (n = 10/3). (H) Quantification of spine area (n = 10/3). (I) Representative images from a confocal time series of GFP-Thr-LRRTM2* cleavage following thrombin application (red arrow; 10 U ml−1). Scale bars, 10 μm. (J) Quantification of GFP-Thr-LRRTM2* (n = 100 synapses/5 neurons/3 independent cultures) and GFP-LRRTM2* (n = 40/2/2) cleavage. (K) Quantification of GFP-LRRTM2* (n = 100/5/2) or GFP-Thr-LRRTM2* (n = 120/6/2) for up to 60 min after thrombin exposure. One-way analysis of variance (ANOVA) with post hoc Dunnett’s test was used in (E) to (H). Data are presented as means ± SEM. *P ≤ 0.05 and **P ≤ 0.01.
Fig. 2
Fig. 2. No rapid loss of AMPARs following removal of the LRRTM2 extracellular domain.
(A) Representative images of neuronal dendrites coexpressing GFP-Thr-LRRTM2* and PSD-95–mCherry*. The red arrow indicates the bath application of thrombin (10 U ml−1). Scale bar, 10 μm. (B) Enlarged view. Scale bar, 2 μm. (C) Left: Quantification of fluorescence intensity of both GFP-Thr-LRRTM2* and PSD-95*–mCherry. Right: Summary of baseline measurements compared to 30′ after thrombin application. (n = 14 neurons/3 independent cultures). (D) Representative images of neuronal dendrites coexpressing BRS-Thr-LRRTM2* and superecliptic pHluorin (SEP)–GluA1/2. Red arrow indicates the bath application of thrombin (10 U ml−1). Scale bar, 10 μm. (E) Enlarged view. Scale bar, 2 μm. (F) Left: Quantification of fluorescence intensity of both BRS-Thr-LRRTM2* labeled with α-bungarotoxin conjugated to Alexa-647 and SEP-GluA1/2 over time normalized to their respective baseline. Right: Summary of baseline measurements compared to 30′ after thrombin application. (n = 11 neurons/3 independent cultures). (G) Representative images of immunocytochemical staining of endogenous RIM1/2 and PSD-95 from cultured hippocampal neurons expressing GFP-Thr-LRRTM2* and mCerulean3 treated with either vehicle (aCSF; top; n = 173 synapses/9 neurons/3 independent cultures) or thrombin (bottom; 10 U ml−1 for 10 min; n = 176/9/3). Scale bar, 5 μm. (H) Quantification of synaptic staining intensity for PSD-95 (top) and RIM1/2 (bottom). au, arbitrary unit. (I) Cumulative distribution of synaptic staining intensities for cells treated with vehicle (aCSF; gray) or thrombin (magenta for PSD-95 and green for RIM1/2). Data are presented as means ± SEM.
Fig. 3
Fig. 3. LRRTM2 is enriched within the transsynaptic nanocolumn.
(A) Schematic demonstrating the transsynaptic nanoscale organization of LRRTM2 relative to RIM and PSD-95. (B) Left: 3D dSTORM reconstruction of a dendrite from a neuron expressing GFP-LRRTM2*. Scale bar, 2 μm. Right: 3D dSTORM reconstructions of an individual synapse with localizations color coded by local density [five times nearest neighbor distance (NND)]. Scale bar, 100 nm. (C) Autocorrelation of LRRTM2 synaptic clusters. (D) Schematic demonstrating the measurement of 3D coenrichment between protein pairs (LRRTM2, green; PSD-95, red). Middle (left): En face view of the localized positions of PSD-95 (red) and LRRTM2 (green) with detected nanoclusters indicated in bold. Middle (right): The same LRRTM2 localizations coded by their local density (five times NND). Scale bar, 100 nm. (E) Quantification of LRRTM2 density as a function of the distance to the PSD-95 nanocluster (NC) center. (F) LRRTM2 cross-enrichment with RIM1/2 as displayed in (D) and (E). Scale bar, 100 nm. (G) Quantification LRRTM2 cross-enrichment with RIM1/2 nanoclusters. (n = 176 nanoclusters/16 neurons/5 independent cultures). (H) Cross-enrichment of a diffuse target, SEP-TM, across from presynaptic RIM1/2 nanoclusters displayed as in (D) and (E). Scale bar, 100 nm. (n = 85/9/3). (G) Quantification of SEP-TM density as a function of the distance to the RIM1/2 nanocluster center. Data are presented as means ± SEM.
Fig. 4
Fig. 4. LRRTM2 is critical for AMPAR enrichment across from preferential sites of evoked neurotransmitter release.
(A) Schematic demonstrating the measurement of AMPAR localization density across from RIM1/2 nanoclusters (left). Quantification of AMPAR enrichment from neurons coexpressing BRS-Thr-LRRTM2* and SEP-GluA1/2 following treatment with thrombin (10 min; green) or vehicle (black). (B) RIM1/2 density across from AMPAR nanoclusters from neurons in (A). (C) Quantification of AMPAR enrichment from neurons coexpressing either BRS-Thr-LRRTM2* (cleavable, green; n = 95 nanoclusters/11 neurons/3 independent cultures) or BRS-LRRTM2* (noncleavable, black; n = 127/15/3) and SEP-GluA1/2 following treatment with thrombin (10 min). (D) RIM1/2 density across from AMPAR nanoclusters as displayed in (B). Quantification (cleavable, magenta; n = 90/11/3) of BRS-LRRTM2* (noncleavable, black; n = 103/15/3) and AMPARs following treatment with thrombin (10 min). (E) Representation of AMPAR density across from RIM1/2 peak density averaged across many synapses. Scale bar, 50 nm. (F) Paired cross correlation gc(r) < 50 nm of synaptic protein pairs of SEP-GluA1/2 and RIM1/2 from thrombin-treated neurons expressing BRS-LRRTM2* (black) or BRS-Thr-LRRTM2* (green). (G) Volume of AMPAR nanoclusters. (H) Number of detected AMPAR nanoclusters. (I) Enrichment indices (gr < 50 nm) for AMPARs across from RIM1/2 nanoclusters (gray and green, left) and RIM1/2 across from AMPAR nanoclusters (gray and magenta, right). Data are presented as means ± SEM; *P ≤ 0.05 and **P ≤ 0.01. Mann Whitney rank sum test was performed for (F) to (I).
Fig. 5
Fig. 5. Numerical model to predict the effects of LRRTM2 loss on synapse function.
(A) Example of the distribution of randomized AMPAR positions within the PSD and nanodomain and the distribution of randomized vesicle release positions, where release is constrained to either the boundary of the nanodomain (black) or PSD (magenta). Scale bar, 100 nm. (B) Representative density histograms of individual modeled receptor distributions. Scale bar, 50 nm. (C) Schematic demonstrating the calculation of peak open probability of all AMPARs within the PSD given a randomized release position constrained as described in (A). (D) Calculation of the summed peak open probability of AMPARs as the release position is offset from the nanodomain. (E) Calculation of the summed peak open probability of AMPARs for release positions constrained to the nanodomain (left) and release positions constrained to the PSD (right) using the modeled nanodomain parameters (gray and black) and redistribution of AMPARs (pink and magenta). (F) Calculation of the summed peak open probability of AMPARs as PSD diameter is adjusted. (G) Calculation of the summed peak open probability of AMPARs as the proportion of AMPARs included in the nanodomain is adjusted. (H) Calculation of the summed peak open probability of AMPARs as the peak open probability as a function of distance decay constant is adjusted ±50%. Data in (F) to (H) are normalized to the baseline parameters condition. Data are presented as means ± SEM. For all modeled data, n = 100 randomizations/bin or 100 randomizations/condition. Mann-Whitney rank sum test was performed in (E). ****P ≤ 0.0001.
Fig. 6
Fig. 6. LRRTM2 is critical for basal strength of evoked but not spontaneous transmission.
(A) Top: Schematic of whole-cell patch-clamp recordings from cultured hippocampal neurons with bipolar electrode stimulation to evoke synaptic currents. Bottom: Averaged traces of evoked synaptic events. Neurons transfected with GFP-Thr-LRRTM2* (light green, cleavable, post-thrombin) and GFP-LRRTM2* (dark green, noncleavable, post-thrombin), where black indicates their respective baselines. Scale bar, 100 pA, 20 ms. (B) Quantification of evoked synaptic current amplitudes normalized to their baseline measurements over time from neurons expressing GFP-LRRTM2* (dark green; n = 9 neurons/3 independent cultures), GFP-Thr-LRRTM2* (light green; n = 12/3), or untransfected neurons (gray; n = 9/3). (C) Quantification of the paired-pulse ratio. (D) Representative traces of miniature EPSC (mEPSC) recordings from cultured hippocampal neurons transfected with GFP-LRRTM2* (dark green) or GFP-Thr-LRRTM2*(light green) before and after the application of thrombin. Scale bar, 35 pA, 2 s. (E) Averaged traces of miniature synaptic currents. GFP-Thr-LRRTM2* (light green) and GFP-LRRTM2* (dark green). Scale bar, 5 pA, 2 ms. (F) Quantification of miniature synaptic current amplitudes from GFP-LRRTM2* (n = 8/3), GFP-Thr-LRRTM2* (n = 8/3), or untransfected neurons (n = 5/3) before and after the application of thrombin. (G) Quantification of miniature frequency before and after the application of thrombin. (H) Quantification of the 10 to 90% rise times of mEPSC events over time, before and after the application of thrombin. (I) Quantification of the 90 to 10% decay time of mEPSC events over time, before and after the application of thrombin. Data are presented as means ± SEM.

References

    1. Malinow R., Malenka R. C., AMPA receptor trafficking and synaptic plasticity. Annu. Rev. Neurosci. 25, 103–126 (2002). - PubMed
    1. Sheng M., Kim M. J., Postsynaptic signaling and plasticity mechanisms. Science 298, 776–780 (2002). - PubMed
    1. Huganir R. L., Nicoll R. A., AMPARs and synaptic plasticity: The last 25 years. Neuron 80, 704–717 (2013). - PMC - PubMed
    1. Traynelis S. F., Wollmuth L. P., McBain C. J., Menniti F. S., Vance K. M., Ogden K. K., Hansen K. B., Yuan H., Myers S. J., Dingledine R., Glutamate receptor ion channels: Structure, regulation, and function. Pharmacol. Rev. 62, 405–496 (2010). - PMC - PubMed
    1. Biederer T., Kaeser P. S., Blanpied T. A., Transcellular nanoalignment of synaptic function. Neuron 96, 680–696 (2017). - PMC - PubMed