. 2021 Aug 20;6(62):eabg4925.
doi: 10.1126/sciimmunol.abg4925.

A high-affinity human TCR-like antibody detects celiac disease gluten peptide-MHC complexes and inhibits T cell activation

Affiliations

A high-affinity human TCR-like antibody detects celiac disease gluten peptide-MHC complexes and inhibits T cell activation

Rahel Frick et al. Sci Immunol. .

Abstract

Antibodies specific for peptides bound to human leukocyte antigen (HLA) molecules are valuable tools for studies of antigen presentation and may have therapeutic potential. Here, we generated human T cell receptor (TCR)-like antibodies toward the immunodominant signature gluten epitope DQ2.5-glia-α2 in celiac disease (CeD). Phage display selection combined with secondary targeted engineering was used to obtain highly specific antibodies with picomolar affinity. The crystal structure of a Fab fragment of the lead antibody 3.C11 in complex with HLA-DQ2.5:DQ2.5-glia-α2 revealed a binding geometry and interaction mode highly similar to prototypic TCRs specific for the same complex. Assessment of CeD biopsy material confirmed disease specificity and reinforced the notion that abundant plasma cells present antigen in the inflamed CeD gut. Furthermore, 3.C11 specifically inhibited activation and proliferation of gluten-specific CD4+ T cells in vitro and in HLA-DQ2.5 humanized mice, suggesting a potential for targeted intervention without compromising systemic immunity.


Figures

Fig. 1.
Fig. 1.. Isolation and characterization of an antibody specific for HLA-DQ2.5:DQ2.5-glia-α2.
(A) The selection output after three rounds of selection was batch cloned into a vector for soluble scFv expression and single colonies were expressed in the E. coli periplasm followed by screening for binding to HLA-DQ2.5:DQ2.5-glia-α2 (target) and HLA-DQ2.5:CLIP2 (background) in ELISA. ScFv anti-phOx binding to BSA-phOx and empty E. coli were included as positive and negative controls, respectively. The ratios of target/background binding are represented as dots for each clone. Positive clones were sequenced, and colors represent clones found repeatedly. Grey dots denote clones with unknown sequence. (B) 14 unique clones were expressed, and periplasmic fractions were analyzed for binding to related gluten pMHC complexes in ELISA. E. coli XL1-Blue were included as a negative control (ctrl) and pMHC capture levels were controlled with the HLA-DQ2 antibody 2.12.E11. Error bars illustrate mean ± SD of duplicates (n=2). (C) The lead candidate 206 was reformatted to hIgG1 and binding to a larger peptide panel of pMHC complexes was tested in ELISA. Error bars illustrate mean ± SD of duplicates (n=2). (D) Structural alignment of DQ2.5-glia-α2 (PDB code 4OZH (27)) and the related DQ2.5-glia-ω2 epitope (model). Differing positions are underlined. (E) The monomeric affinity of Fab 206 for HLA-DQ2.5:DQ2.5-glia-α2 was determined by SPR using single cycle kinetics and fitting a 1:1 binding model to the data (n=2, representative sensorgram shown).
Fig. 2.
Fig. 2.. Selection and screening of antibody libraries.
(A) Schematic overview of the selection strategy. Low valence (LV) and high valence (HV) display were achieved by packaging with the helper phages M13K07 or DeltaPhage, respectively. After R1 the libraries were split into a competition branch and a thermostability branch. (B) The selection outputs after R3 were screened as soluble scFvs to assess binding to target pMHC and HLA-DQ2.5:CLIP2 (background) in ELISA and ratios were calculated. Each dot represents one clone. Grey dots denote unknown sequences, black dots denote unique single sequences and colors represent enriched amino acid sequences. The H1/H3T library containing pooled CDR H1 and H3 libraries was selected in the thermostability branch, while the H1C library (CDR H1 only) was selected in the competition branch. (C) The R3 selection outputs were screened in phage format and are represented as in B. (D) Purified, monomeric Fab fragments were tested for binding to a panel of HLA-DQ2.5:peptide complexes in ELISA. Error bars illustrate mean ± SD of duplicates (n=2). (E) Sequence alignment of the mother clone 206 and the high-affinity offspring containing CDR H1 mutations (bold red). IGHV gene segment usage and numbering according to the IMGT scheme. The IGHV1–69 V gene of clone 206 is in germline configuration.
Fig. 3.
Fig. 3.. Biophysical characterization of leads.
(A) Fab fragments were ranked based on off-rates in SPR with the lead clone 3.C11 highlighted in red and the parent clone using dotted lines (n=2). (B) Representative sensorgrams of Fab 3.C11 (n=3). (C) 3.C11 was reformatted to full-length hIgG1 and analyzed in ELISA against a panel of related soluble peptide:HLA-DQ2.5 complexes. Error bars illustrate mean ± SD of duplicates (n=3). (D) Melting temperatures of mother clone Fab 206 (squared) and the affinity matured Fab fragments with the lead candidate 3.C11 highlighted in red. Error bars illustrate mean ± SD of triplicates (n=1).
Fig. 4.
Fig. 4.. TCR-like binding mode of 3.C11 to HLA-DQ2.5:DQ2.5-glia-α2.
(A) Overview of the Fab 3.C11 - HLA-DQ2.5:DQ2.5-glia-α2 complex. HLA-DQ2.5 α- and β-chains are light green and light yellow, respectively; the peptide is dark grey and shown in stick representation; 3.C11 H- and L-chains are brown and grey, respectively. CDRs and framework are colored as indicated in the figure. (B) CDR loop arrangement (top) and footprint (bottom) of the Fab 3.C11 - HLA-DQ2.5:DQ2.5-glia-α2 complex. In the footprint, HLA-DQ2.5:HLA-DQ2.5-glia-α2 is shown in surface representation with the peptide in dark grey. Atoms contacted by the Fab are colored according to the nearest CDR loop or framework residue. Black dots and line represent the center of mass positions of the antibody variable domains and illustrate the approximate docking angle. (C) Overview and (D) CDR loop arrangement and footprint of the TCR S16 - HLA-DQ2.5:DQ2.5-glia-α2 complex illustrated for comparison (27).
Fig. 5.
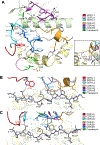
Fig. 5.. TCR-like features in the HLA-DQ2.5:DQ2.5-glia-α2 binding interface of 3.C11.
(A) Interactions of the Fab 3.C11 with HLA-DQ2.5 α- and β-chains (light green and light yellow, respectively). CDRs and framework are colored as indicated in the figure with interacting residues represented as sticks. The peptide is shown in grey. Black dashes, hydrogen bonds and salt bridges; dotted lines, van der Waals interactions. All amino acids are indicated by their single-letter abbreviations. Box inset: Overlay of the 3.C11 CDR H1 (orange) with canonical IGHV1–69 CDR H1 from published structures (PDB codes green, 5WL2; cyan, 5I18; lime, 6O41; pink, 5J74). (B) Interactions of the Fab 3.C11 with the DQ2.5-glia-α2 peptide. (C) Interactions of the TCR S16 with the DQ2.5-glia-α2 peptide (27).
Fig. 6.
Fig. 6.. 3.C11 binds peptide-loaded cells and detects gluten peptide presentation on cells from CeD patient biopsies.
(A) Raji B cells were in vitro loaded with gluten peptides as annotated and stained with R-PE-conjugated 206 or 3.C11 mIgG2b (n=1) (B) Human EBV transduced B-cell lines expressing different HLA-DQ allotypes were loaded with gluten peptides and stained with 3.C11 as before (n=2). (C-F) Single-cell suspensions were prepared from untreated HLA-DQ2.5+ CeD patients (n=8, UCeD) or controls with a normal intestinal histology (n=5, two of the controls were HLA-DQ2.5+). PCs were gated as live, large lymphocytes, CD3-CD11c-CD14-CD38+CD27+/−CD19+CD45+ cells (C, D), and DCs/Mfs as live, CD3-CD19-CD27-CD38-CD11c+CD14+ cells (E, F). Cells were stained with mIgG2b antibodies followed by a PE-conjugated secondary antibody. Frequency of positive cells was calculated based on gates set according to the staining of an isotype control antibody (isotype). Upper panels; percentage of pMHC+ cells across individuals. Boxes illustrate minimum to maximum value with the middle line at mean percentage. Dotted lines represent mean background staining of the isotype. For each CeD subject (different shades of blue), alterations in biopsy histology according to modified Marsh scores are indicated. Statistical differences between groups were analyzed using an unpaired two-tailed t-test. *P<0.05; **P<0.01; ***P<0.001; ****P<0.0001; ns, not significant. Lower panels; representative histograms showing pMHC-specific staining within patient groups as indicated.
Fig. 7.
Fig. 7.. Inhibitory capacity of the HLA-DQ2.5:DQ2.5-glia-α2-specific antibody 3.C11.
(A) pMHC-specific antibodies (1 μM) or pan-HLA antibodies (0.1 μM) were added to peptide-loaded Raji B cells prior to incubation with T cells. T-cell activation (CD69 upregulation) was calculated relative to T-cell activation without presence of antibodies. Error bars illustrate mean ± SD of duplicates (n=3). (B and C) Raji B cells were loaded with gluten peptides or combinations of them and co-cultured with a blend of SKW3 380 and 364 T-cells (B, n=2), or K562-CIITA cells were loaded with stimulatory peptides or combinations of them and co-cultured with a blend of the SKW3 364 and R12C9 T-cells (C, n=3). In both panels, SKW3 364 T cells were labelled with CFSE to guide T-cell separation in flow analysis. Presence or absence of antibodies is indicated. Signals were normalized to antigen-specific activation in absence of antibodies and the heatmap represents means of duplicates. (D) The primary T-cell clone (TCC) specific for HLA-DQ2.5:DQ2.5-glia-α2, TCC820.250, was co-cultured with peptide-loaded Raji B cells in presence of antibodies as annotated. T-cell proliferation was assessed in a 3H-thymidine incorporation assay. Error bars represent mean ± SD of triplicates (n=2). (E) HLA-DQ2.5:DQ2.5-glia-α2-specific TCCs (TCC820.250 and TCC436.5.3) were co-cultured with 33-mer-loaded Raji B cells in presence of titrated amounts of antibodies as annotated. Pan-HLA-DQ antibody (SPV-L3), pan-HLA-DR antibody (L243 or B8.11), pan-HLA-DP antibody (B7/21), and an isotype were included as controls. Error bars represent mean ± SD of triplicates (n=2/3). Statistical differences between groups were analyzed using an unpaired two-tailed t-test. *P<0.05; **P<0.01; ***P<0.001; ****P<0.0001; ns, not significant.
Fig. 8.
Fig. 8.. Inhibition of T-cell proliferation by 3.C11 in HLA-DQ2.5 humanized mice.
The ability of mAb 3.C11 to block in vivo T-cell activation was evaluated by measuring the percentage of proliferating T-cells in an adoptive transfer model. (A) Schematic overview of the adoptive transfer model. HLA-DQ2.5:DQ2.5-glia-α2-specific T cells isolated from TCR tg mice were labeled with Cell Trace Violet (CTV) prior to transfer into HLA-DQ2.5 KI mice. The following day, mice first received an i.p. dose of mAb or PBS alone, before intragastric gavage of 100 μg deamidated gluten peptide after 30 min. Mesenteric lymph nodes (MLN), Peyer’s patches (PP), spleen and inguinal lymph nodes (ILN) were harvested 48 h after peptide administration and analyzed for T-cell proliferation. (B) Representative histograms showing T-cell proliferation by measuring dilution of fluorescent dye. 5 mice per group received i.p. injection of antibody (either mIgG2b 3.C11, mIgG2b isotype control or mIgG2a SPV-L3) or PBS in two independent experiments, with the exception of the 3.C11 group containing 4 mice due to a technical issue. One mouse received neither i.p. injection nor oral peptide (denoted baseline). Percentage proliferating cells are indicated in each panel. (C) Percentage of proliferating T-cells in the MLN, PP, spleen and ILN in mice receiving i.p. administration of antibody or PBS, or the untreated baseline mouse. Each data point represents an individual mouse. Boxes illustrate minimum to maximum value with the middle line at mean. Statistical differences between two groups were analyzed using an unpaired two-tailed t-test. *P<0.05; **P<0.01; ***P<0.001; ****P<0.0001; ns, not significant.

References

    1. Krogsgaard M, Wucherpfennig KW, Cannella B, Hansen BE, a Svejgaard, Pyrdol J, Ditzel H, Raine C, Engberg J, Fugger L, Visualization of myelin basic protein (MBP) T cell epitopes in multiple sclerosis lesions using a monoclonal antibody specific for the human histocompatibility leukocyte antigen (HLA)-DR2-MBP 85–99 complex., J. Exp. Med. 191, 1395–1412 (2000). - PMC - PubMed
    1. Weidanz JA, Piazza P, Hickman-Miller H, Woodburn D, Nguyen T, Wahl A, Neethling F, Chiriva-Internati M, Rinaldo CR, Hildebrand WH, Development and implementation of a direct detection, quantitation and validation system for class I MHC self-peptide epitopes, J. Immunol. Methods 318, 47–58 (2007). - PubMed
    1. Dahan R, a Gebe J, Preisinger A, a James E, Tendler M, Nepom GT, Reiter Y, Antigen-specific immunomodulation for type 1 diabetes by novel recombinant antibodies directed against diabetes-associates auto-reactive T cell epitope., J. Autoimmun. 47, 83–93 (2013). - PubMed
    1. Høydahl LS, Frick R, Sandlie I, Løset GÅ, Targeting the MHC Ligandome by Use of TCR-Like Antibodies, Antibodies 8, 32 (2019). - PMC - PubMed
    1. Løset GÅ, Berntzen G, Frigstad T, Pollmann S, Gunnarsen KS, Sandlie I, Phage Display Engineered T Cell Receptors as Tools for the Study of Tumor Peptide-MHC Interactions, Front. Oncol. 4, 1–7 (2015). - PMC - PubMed

Publication types