. 2021 Aug 20;12(1):5066.
doi: 10.1038/s41467-021-25325-9.

MiR-205-driven downregulation of cholesterol biosynthesis through SQLE-inhibition identifies therapeutic vulnerability in aggressive prostate cancer

Affiliations

MiR-205-driven downregulation of cholesterol biosynthesis through SQLE-inhibition identifies therapeutic vulnerability in aggressive prostate cancer

C Kalogirou et al. Nat Commun. .

Abstract

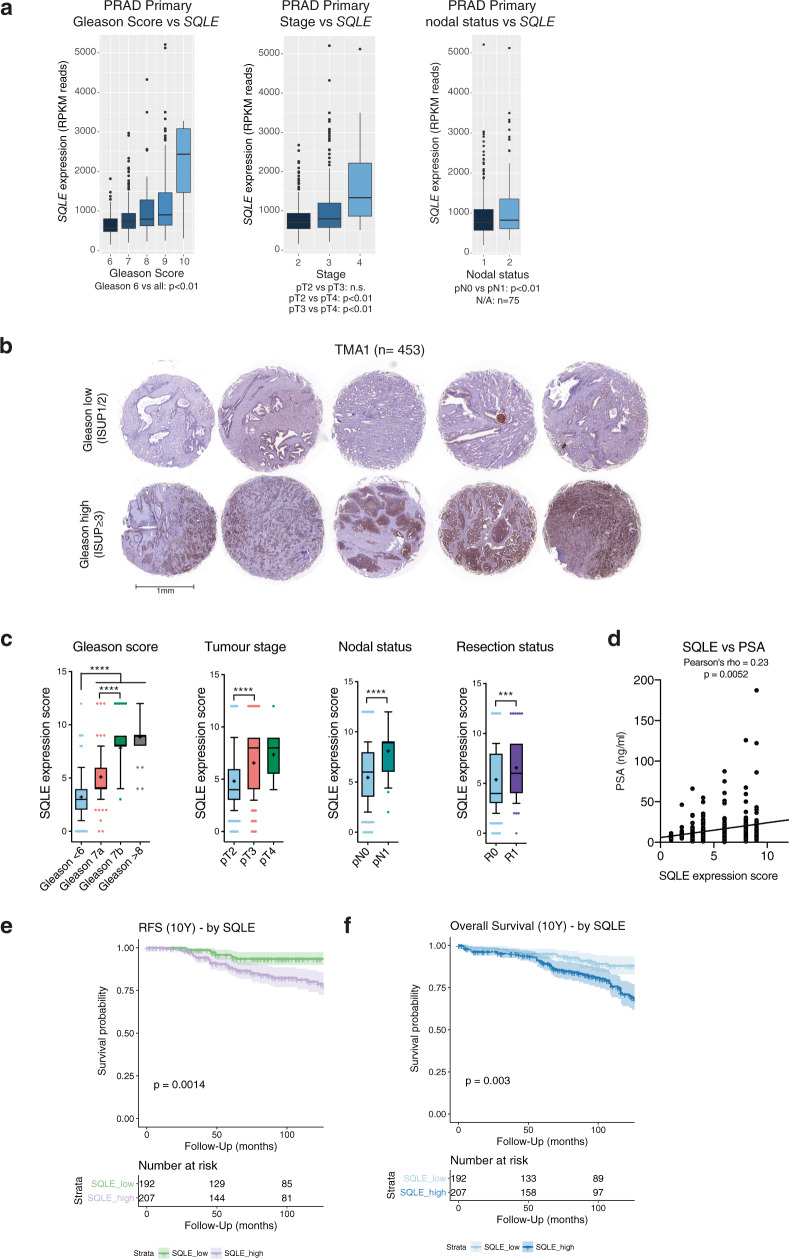
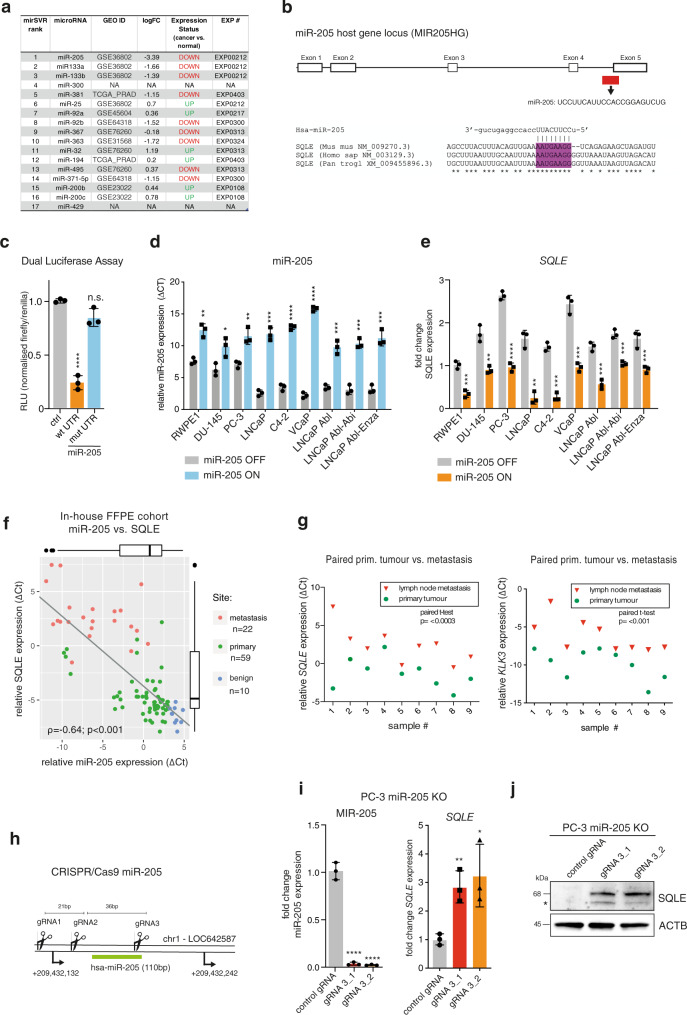
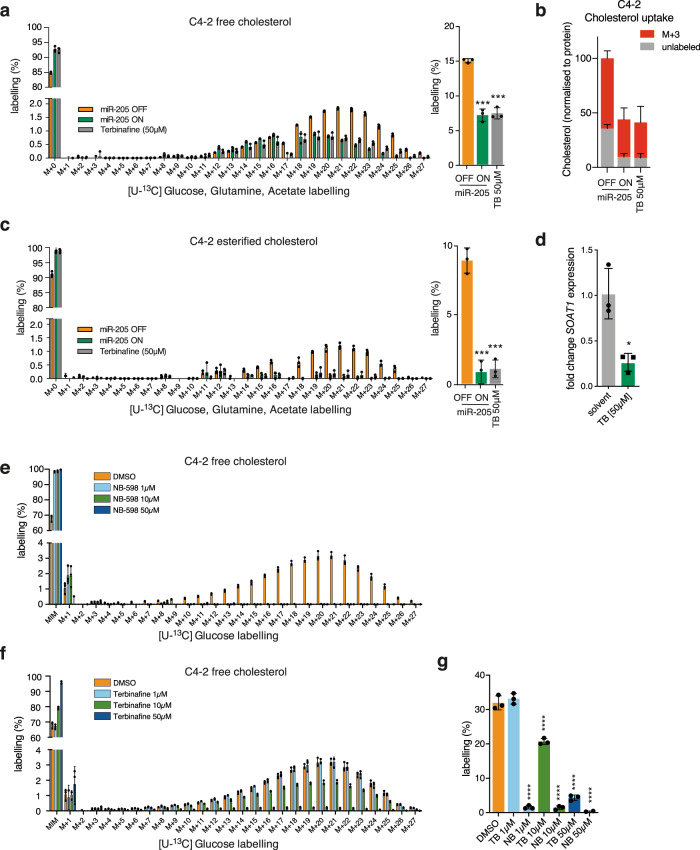
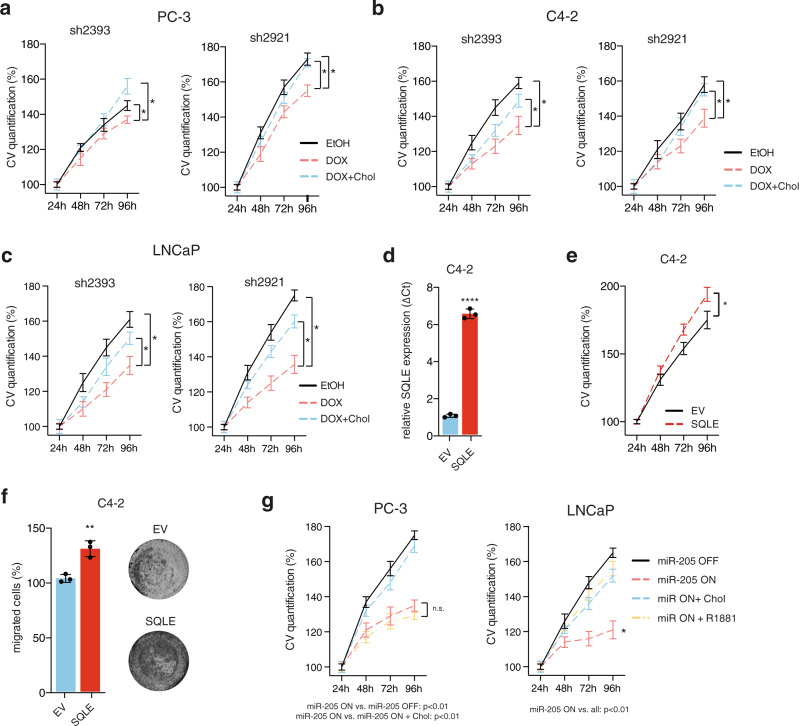
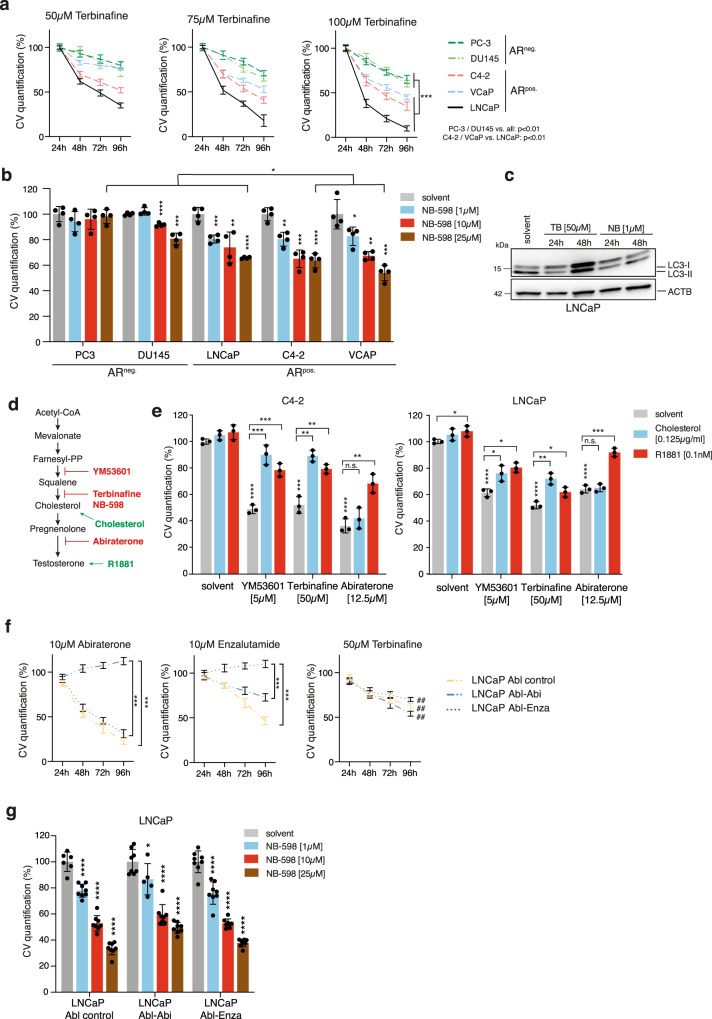
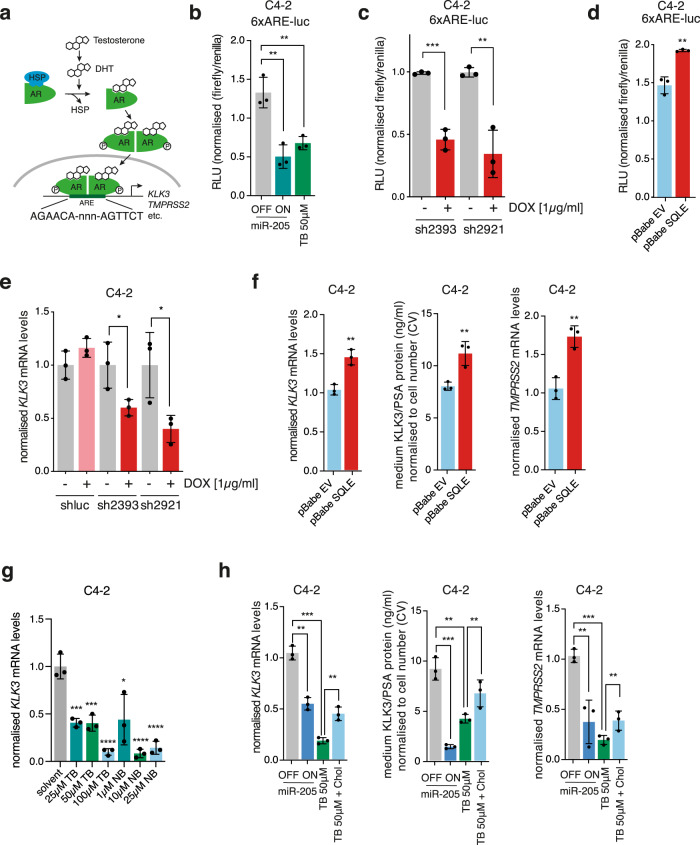
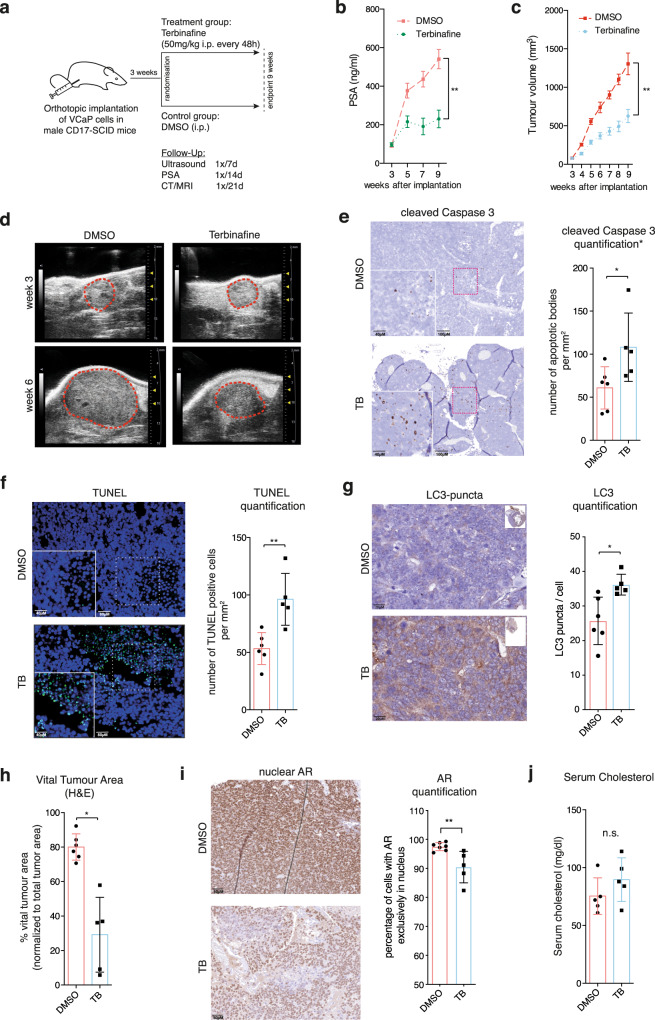
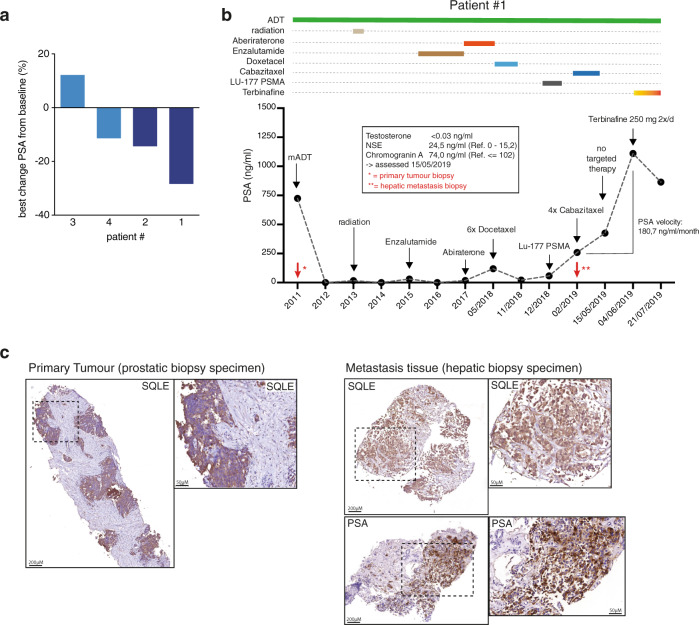
Prostate cancer (PCa) shows strong dependence on the androgen receptor (AR) pathway. Here, we show that squalene epoxidase (SQLE), an enzyme of the cholesterol biosynthesis pathway, is overexpressed in advanced PCa and its expression correlates with poor survival. SQLE expression is controlled by micro-RNA 205 (miR-205), which is significantly downregulated in advanced PCa. Restoration of miR-205 expression or competitive inhibition of SQLE led to inhibition of de novo cholesterol biosynthesis. Furthermore, SQLE was essential for proliferation of AR-positive PCa cell lines, including abiraterone or enzalutamide resistant derivatives, and blocked transactivation of the AR pathway. Inhibition of SQLE with the FDA approved antifungal drug terbinafine also efficiently blocked orthotopic tumour growth in mice. Finally, terbinafine reduced levels of prostate specific antigen (PSA) in three out of four late-stage PCa patients. These results highlight SQLE as a therapeutic target for the treatment of advanced PCa.


Conflict of interest statement

The authors declare no competing interests.

Figures

Fig. 1
Fig. 1. SQLE expression is correlated with metastasis formation and lethal disease in prostate cancer.
aSQLE expression in relation to Gleason score (left), pathological tumour stage (pT, middle), and nodal status (pN, right) in the TCGA prostate adenocarcinoma (PRAD) dataset (PanCancer Atlas, N = 494) as assessed by RNASeq2 on reads per kilo base per million mapped reads (RPKM). Data are presented as box and whiskers plots (box 25–75th percentile, whiskers 1.5 × interquartile range, line at median, outliers plotted individually). Differences between Gleason scores and pathological tumour stages were calculated with standard forward ANOVA. Differences between nodal statuses were calculated with unpaired two-tailed Student’s t-test. b SQLE expression in representative tissue cores from the PCa cohort of tumour microarray 1 (TMA1) (N = 453). Tumour tissue samples displaying low Gleason score (ISUP1/2, top) were compared to samples displaying high Gleason score (ISUP ≥ 3, bottom). c Box-and-whiskers plots (box 25–75th percentile, whiskers 10–90th percentile, line at median, + at mean) of SQLE histoscores (SQLE expression score) in tumour tissue samples compared by Gleason score, tumour stage, nodal status and resection status from the patient cohort represented in TMA1 (N = 453). (***p ≤ 0.0001, ****p ≤ 0.0001, two-sided Mann–Whitney test). d Pearson correlation (one-sided) of SQLE expression score with preoperative prostate specific antigen (PSA) levels in patients from the same cohort as in (c). e, f Ten-year Kaplan–Meier plot of recurrence-free (RFS) (e) and overall survival (OS) (f) in the PCa cohort of TMA1 (N = 453) dichotomised into high (“SQLE_high”) and low (“SQLE_low”) based on median SQLE expression score. Survival differences were calculated with the log-rank test.
Fig. 2
Fig. 2. miR-205 negatively regulates SQLE in PCa.
a In silico assessment of microRNAs predicted to regulate SQLE (http://www.microrna.org). MicroRNAs are ranked by mirSVR score and their expression in PCa is shown as log2FC (dbDEMC 2.0). b Diagram showing the location of miR-205 within its host gene (MIR205HG) and the alignment to the 3′UTR of the SQLE gene from human, mouse, and chimpanzee. c A pMIR-REPORT plasmid containing a wild-type or mutated 3′-UTR of the SQLE mRNA was cotransfected with precursor miR-205 in LNCaP cells. Firefly luciferase activity, in relative light units (RLU), was analysed 48 h after transfection and normalised to renilla luciferase (pRL-TK). Reporter activities of cells cotransfected with miR-precursor negative control were used as control. Data are presented as mean +/− SD of three independent experiments (*p < 0.05, unpaired two-tailed Student’s t-test). d, e A panel of PCa cell lines was transduced with a doxycycline-inducible vector expressing miR-205 and treated with 1 µg/mL of doxycycline (miR-205 ON) or vehicle control (miR-205 OFF) for 48 h. Induction of miR-205 (d) and SQLE expression (e) were analysed by qRT-PCR. Data are presented as mean +/− SD of six independent biological replicates in three independent experiments (*p < 0.05, **p < 0.01, ***p < 0.001, ****p < 0.0001, unpaired two-tailed Student’s t-test). f Spearman rank correlation of relative miR-205 and SQLE expression determined by qRT-PCR in benign prostate tissues (N = 10, blue), primary prostate cancer tissues (N = 59, green), and lymph-node metastases (N = 22, red). RNA was extracted from formalin-fixed paraffin-embedded (FFPE) tissues from an in-house collection. g Comparison of SQLE (left) and KLK3 (right) expression in nine paired samples of primary tumour tissue and lymph-node metastases from the same cohort as in (f). Statistical differences were calculated with standard forward ANOVA. h CRISPR/Cas9 knockout strategy for miR-205. The location of the three guide RNAs is displayed on the miR-205 locus on chromosome 1. The mature miR-205 sequence is marked in green. i Expression of miR-205 and SQLE in pools of PC-3 cells after deletion of miR-205 using two combinations of gRNAs. Cells expressing Cas9 and a nontargeting guide RNA were used as controls. Data are presented as mean +/− SD of three independent experiments (*p < 0.05, unpaired two-tailed Student’s t-test). j WB showing expression of SQLE protein in parallel samples to (i). Actin B (ACTB) is shown as loading control. A representative image of two independent experiments is shown.
Fig. 3
Fig. 3. SQLE regulation by miR-205 controls cholesterol biosynthesis in PCa cells.
a C4-2 cells expressing doxycycline-inducible miR-205 were treated with 1 µg/mL of doxycycline for 72 h (miR-205 ON) or solvent (miR-205 OFF), or with 50 µM of terbinafine (TB) for 48 h, and labelled with [U13C]-glucose, [U13C]-glutamine and [U13C]-acetate. Cells were extracted and analysed by LC–MS. Graphs show relative peak intensities of individual isotopologues (left graph) and overall labelled fractions (right graph) for free cholesterol. Data are presented as mean +/− SD of three independent biological replicates (*p < 0.05, unpaired two-tailed Student’s t-test). b C4-2 cells were treated as in (a) and labelled with cholesterol-2,3,4-13C3 for 48 h. Cells were extracted and analysed by LC–MS. Graphs show the relative peak area normalised to protein for free cholesterol. The M + 3 fraction represents cholesterol-2,3,4-13C3 taken up from the medium. Data are presented as mean +/− SD of three independent biological replicates. c Relative peak intensities of individual isotopologues (left graph) and overall labelled fractions (right graph) for esterified cholesterol in the same experimental conditions as in (a). d Expression of SOAT1 mRNA in C4-2 cells treated with 50 µM of terbinafine for 48 h. Data show mean +/− SD of three independent biological replicates (**p ≤ 0.01, unpaired two-tailed Student’s t-test). eg C4-2 cells were treated with increasing amounts of NB-598 (e) or terbinafine (f) for 72 h and cultured in [U13C]-glucose containing media for the last 48 h. Metabolites were extracted and analysed by LC–MS. Graphs show relative peak intensities of individual isotopologues (e and f) and overall labelled fractions (g) for free cholesterol. Data are presented as mean +/− SD of three independent biological replicates (****p < 0.0001, unpaired two-tailed Student’s t-test).
Fig. 4
Fig. 4. SQLE supports proliferation in PCa cells.
ac Cell viability assays measured by crystal violet (CV) staining of PC-3 (a), C4-2 (b), and LNCaP (c) cells expressing two independent shRNAs targeting SQLE (sh2393 or sh2921) and treated with 1 µg/mL doxycycline (DOX) or solvent (EtOH). Cell counts were normalised to cell number at 24 h. Rescue experiments were performed by addition of 0.125 µg/mL cell-permeable cholesterol (DOX + Chol). Data are presented as mean +/− SD of three independent samples (*p < 0.05, unpaired two-tailed Student’s t-test on the final time points). d Constitutive overexpression of SQLE in C4-2 cells using a retroviral vector (pBabe) as determined by qRT-PCR. Empty vector cells (EV) were used as control. Data are presented as mean +/− SD of three independent samples (****p < 0.0001, unpaired two-tailed Student’s t-test). e Cell viability assays measured by crystal violet staining of C4-2 cells overexpressing SQLE (SQLE) or empty vector (EV) at the indicated time points. Cell count was normalised to initial cell number at 24 h. Data are presented as mean +/− SD of three independent samples (*p < 0.05, unpaired two-tailed Student’s t-test on the final time points). f Transwell migration assay of SQLE overexpressing (SQLE) and empty vector (EV) C4-2 cells. Data are presented as mean +/− SD of three independent experiments (**p < 0.01, unpaired two-tailed Student’s t-test). g Cell viability assays measured by crystal violet staining of PC-3 and LNCaP cells expressing doxycycline-inducible miR-205 treated with 1 µg/mL doxycycline (miR-205 ON) or ethanol (MIR-205 OFF) for the indicated times. Rescue experiments were performed by addition of 0.125 µg/mL cell-permeable cholesterol (miR ON + Chol) or 1 nM R1881 (miR ON + R1881). Cell counts were normalised to cell number at 24 h. Data are presented as mean +/− SD of three independent samples (*p < 0.05, unpaired two-tailed Student’s t-test on the final time point; n.s. = not significant).
Fig. 5
Fig. 5. Inhibition of SQLE targets AR-positive PCa cells and overcomes resistance to second-generation AR inhibitors.
a Cell viability assays measured by crystal violet (CV) staining of a panel of androgen-receptor (AR)-positive (ARpos.) and AR-negative (ARneg.) PCa cell lines after treatment with increasing doses of terbinafine for the indicated times. Data are presented as mean +/− SD of three independent samples. Cell count was normalised to initial cell number at 24 h. Differences between the curves were calculated using unpaired two-tailed Student’s t-test for the indicated time points. b Cell viability assays measured by crystal violet staining of the same cell line panel as in (a) after treatment with increasing doses of NB-598 for 96 h. Data are presented as mean +/− SD of three independent samples (*p < 0.05, **p < 0.01, ***p < 0.001, ****p < 0.0001, unpaired two-tailed Student’s t-test). c LNCaP cells were treated with 50 µM terbinafine (TB), 1 µM NB-598 (NB), or solvent (DMSO) for 24 or 48 h. LC3 was detected by WB. Actin B is shown as loading control. A representative image of two independent experiments is shown. d Diagram of the cholesterol pathway showing inhibitors and rescue compounds used in (e). e Cell viability assays measured by crystal violet staining in C4-2 and LNCaP cells after 72 h of treatment with the indicated drugs (5 µM YM53601, 50 µM terbinafine or 12.5 µM abiraterone acetate). Rescue experiments were carried out by addition of 0.125 µg/mL cell-permeable cholesterol or 0.1 nM R1881. Data are presented as mean +/− SD of three independent experiments (*p < 0.05, unpaired two-tailed Student’s t-test). f Cell viability assays measured by crystal violet staining in a panel of LNCaP derived cell lines resistant toward abiraterone (LNCaP Abl-Abi), enzalutamide (LNCaP Abl-Enza), and the parental line (LNCaP Abl control) after treatment with 10 µM abiraterone (left graph), 10 µM enzalutamide (middle graph), or 50 µM terbinafine (right graph) for the indicated times. Cell count was normalised to initial cell number at 24 h. Data are presented as mean +/− SD of three independent replicates (***p < 0.001, unpaired two-tailed Student’s t-test between Abl-Abi or Abl-Enza and control and on the final time point, ##p < 0.01, unpaired two-tailed Student’s t-test of cell number at 96 h compared with 24 h). g Cell viability assays measured by crystal violet staining in the same cell lines used in (f) after treatment with increasing doses of NB-598 for 96 h. Data are presented as mean +/− SD of three independent replicates (*p < 0.05, **p < 0.01, ***p < 0.001, ****p < 0.0001, unpaired two-tailed Student’s t-test).
Fig. 6
Fig. 6. miR205 and SQLE control AR transactivation in PCa cells.
a Diagram outlining the mechanism of AR transactivation. In the presence of dihydrotestosterone (DHT), AR dimerises and translocates to the nucleus, where it binds to the androgen-response elements (ARE) in its target genes. b Activity of the 6xARE-luc reporter in C4-2 cells expressing doxycycline-inducible miR-205 and treated with 1 µg/mL doxycycline (miR-205 ON) or ethanol (miR-205 OFF), or with 50 µM terbinafine for 48 h. Relative light units (RLU) are presented as mean +/− SD of three independent biological replicates (**p < 0.01, ***p < 0.001, unpaired two-tailed Student’s t-test). c Activity of the 6xARE-luc reporter in C4-2 cells expressing doxycycline-inducible shRNA targeting SQLE (sh2392 or sh2921) and treated with 1 µg/mL doxycycline (DOX) or ethanol for 48 h. Data are presented as mean +/− SD of three independent biological replicates (**p < 0.01, ***p < 0.001, unpaired two-tailed Student’s t-test). d Activity of the 6xARE-luc reporter in SQLE-overexpressing (SQLE) and empty vector (EV) C4-2 cells. Data are presented as mean +/− SD of three independent biological replicates (**p < 0.01, unpaired two-tailed Student’s t-test). e RNA from C4-2 cells treated as in (c) was analysed for expression of KLK3 by qRT-PCR. Data are presented as mean +/− SD of three independent biological replicates (*p < 0.05, unpaired two-tailed Student’s t-test). f Expression of KLK3 (left graph), levels of PSA in medium supernatants (middle graph), and expression of TMPRSS2 (right graph) in C4-2 cells expressing SQLE or empty vector (EV). Data are presented as mean +/− SD of three independent biological replicates (**p < 0.01, unpaired two-tailed Student’s t-test). g C4-2 cells were treated with the indicated doses of terbinafine (TB) or NB-598 (NB) for 48 h. Expression of KLK3 mRNA was quantified by qRT-PCR. Data are presented as mean +/− SD of three independent biological replicates (*p < 0.05, **p < 0.01, ***p < 0.001, ****p < 0.0001, unpaired two-tailed Student’s t-test). h C4-2 cells expressing doxycycline-inducible miR-205 were treated with 1 µg/mL doxycycline (miR-205 ON) or solvent (miR-205 OFF), or with 50 µM terbinafine (TB 50 µM) for 48 h. Rescue experiments were carried out using 0.125 µg/mL of cell-permeable cholesterol (TB 50 µM + Chol). Expression of KLK3 mRNA (left), levels of PSA in medium supernatants (middle), and expression of TMPRSS2 mRNA were determined. Data are presented as mean +/− SD of three independent biological replicates (*p < 0.05, **p < 0.01, ***p < 0.001, unpaired two-tailed Student’s t-test).
Fig. 7
Fig. 7. SQLE inhibition suppresses tumour growth in an orthotopic mouse model of PCa.
a Study design of the orthotopic xenograft model used. b Time course of serum prostate-specific antigen (PSA) levels in vehicle- (DMSO, red line) or terbinafine (TB, blue line) treated mice at the indicated time points after orthotopic xenografting of VCaP cells. Data are presented as mean +/− SD of DMSO (N = 8) and TB (N = 7) cohorts. (**p < 0.01, unpaired two-tailed Student’s t-test). c Tumour volume in vehicle- (DMSO, red line) or terbinafine- (TB, blue line) treated mice at the indicated time points after orthotopic xenografting. Tumour-volume determination was carried out with high-resolution 3D ultrasonography. Data are presented as mean +/− SD of DMSO (N = 8) and TB (N = 7) cohorts (**p < 0.01, unpaired two-tailed Student’s t-test). d Representative ultrasonography images of vehicle- or terbinafine-treated mice at the indicated time points after orthotopic xenografting. e Left: representative IHC sections stained for the apoptosis marker cleaved Caspase 3 in vehicle- (DMSO) or terbinafine- (TB) treated mice. Right: quantitative analysis of cleaved Caspase 3-positive cells (=apoptotic bodies/mm2) using automated image analysis. Data are presented as mean +/− SD of DMSO (N = 6) and TB (N = 5) cohorts (*p < 0.05, unpaired two-tailed Student’s t-test). f Left: Representative images for TUNEL staining of tumour tissue from vehicle- (DMSO) or terbinafine- (TB) treated mice. Green fluorescence indicates TUNEL-positive, apoptotic cells. Cellular nuclei were counterstained with DAPI. Right: quantitative analysis of TUNEL signal. Data are presented as mean +/− SD of DMSO (n = 6) and TB (n = 5) cohorts. (**p < 0.01, unpaired two-tailed Student’s t-test). g Left: Representative images for LC3 puncta staining of tumour tissue from vehicle- (DMSO) or terbinafine- (TB) treated mice. Right: quantitative analysis of LC3 puncta per cell using automated image analysis. Data are presented as mean +/− SD of DMSO (N = 6) and TB (N = 5) cohorts (*p < 0.05, unpaired two-tailed Student’s t-test). h Percent vital tumour area determined in hematoxylin- and eosin- (H&E) stained sections of tumours from vehicle- (DMSO) or terbinafine- (TB) treated mice using automated image analysis. Data are presented as mean +/− SD of DMSO (N = 6) and TB (N = 5) cohorts. (*p < 0.05, unpaired two-tailed Student’s t-test). i Left: Representative images for nuclear androgen receptor (AR) staining of tumour tissue from vehicle (DMSO) or terbinafine (TB) treated mice. Right: quantitative analysis of cells with AR exclusively in the nucleus using automated image analysis. Data are presented as mean +/− SD of DMSO (N = 6) and TB (N = 5) cohorts (**p < 0.01, unpaired two-tailed Student’s t-test). j Serum cholesterol levels determined at the endpoint in vehicle- (DMSO) or terbinafine- (TB) treated mice (n.s. = not significant, unpaired two-tailed Student’s t-test, DMSO n = 6, TB n = 5).
Fig. 8
Fig. 8. SQLE inhibition by standard-dose terbinafine delays biochemical progression in patients with metastatic PCa.
a Waterfall plot showing PSA percent change from baseline for four patients treated with either 500 mg/day (patients #1 and #4) or 250 mg/day (patient #2) for two weeks or 500 mg/day for six weeks (patient #3). b Serum PSA levels of patient #1 over the course of the disease. Respective treatment regimens are indicated above the graph. Inset: additional patient information. Red arrows indicate timepoints of tissue resection. c Representative images of IHC sections of tumour tissue stained for SQLE or PSA. Left: initial prostate biopsy specimen from 2011. Right: liver metastasis biopsy from May 2019.

Comment in

  • Urological Oncology: Prostate Cancer.
    Taneja SS. Taneja SS. J Urol. 2022 May;207(5):1155-1156. doi: 10.1097/JU.0000000000002477. Epub 2022 Feb 16. J Urol. 2022. PMID: 35168364 No abstract available.

References

    1. Sboner A, et al. Molecular sampling of prostate cancer: a dilemma for predicting disease progression. BMC Med. Genomics. 2010;3:8. doi: 10.1186/1755-8794-3-8. - DOI - PMC - PubMed
    1. Feldman BJ, Feldman D. The development of androgen-independent prostate cancer. Nat. Rev. Cancer. 2001;1:34–45. doi: 10.1038/35094009. - DOI - PubMed
    1. Montgomery RB, et al. Maintenance of intratumoral androgens in metastatic prostate cancer: a mechanism for castration-resistant tumor growth. Cancer Res. 2008;68:4447–4454. doi: 10.1158/0008-5472.CAN-08-0249. - DOI - PMC - PubMed
    1. Locke JA, et al. Androgen levels increase by intratumoral de novo steroidogenesis during progression of castration-resistant prostate cancer. Cancer Res. 2008;68:6407–6415. doi: 10.1158/0008-5472.CAN-07-5997. - DOI - PubMed
    1. Cai C, et al. Intratumoral de novo steroid synthesis activates androgen receptor in castration-resistant prostate cancer and is upregulated by treatment with CYP17A1 inhibitors. Cancer Res. 2011;71:6503–6513. doi: 10.1158/0008-5472.CAN-11-0532. - DOI - PMC - PubMed

Publication types

MeSH terms