. 2021 Aug 20;12(1):5056.
doi: 10.1038/s41467-021-25326-8.

Epigenetic control of melanoma cell invasiveness by the stem cell factor SALL4

Affiliations

Epigenetic control of melanoma cell invasiveness by the stem cell factor SALL4

Johanna Diener et al. Nat Commun. .

Abstract

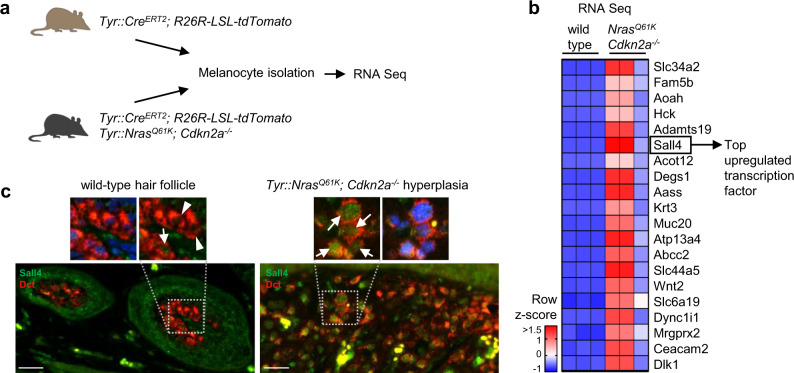
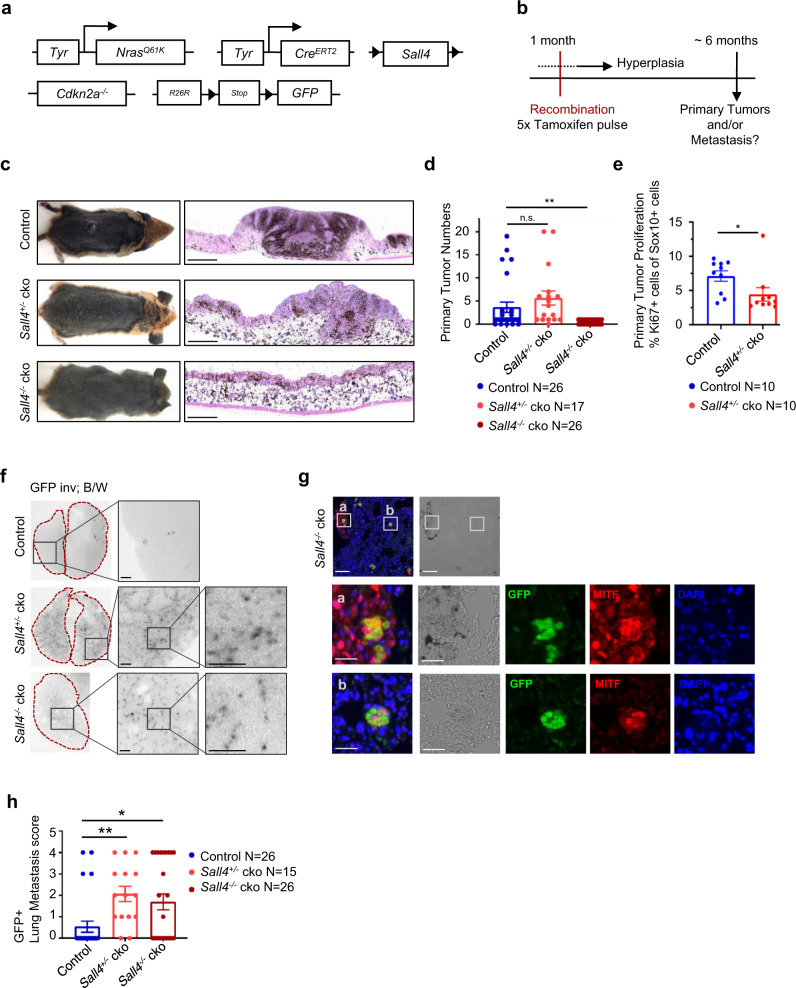
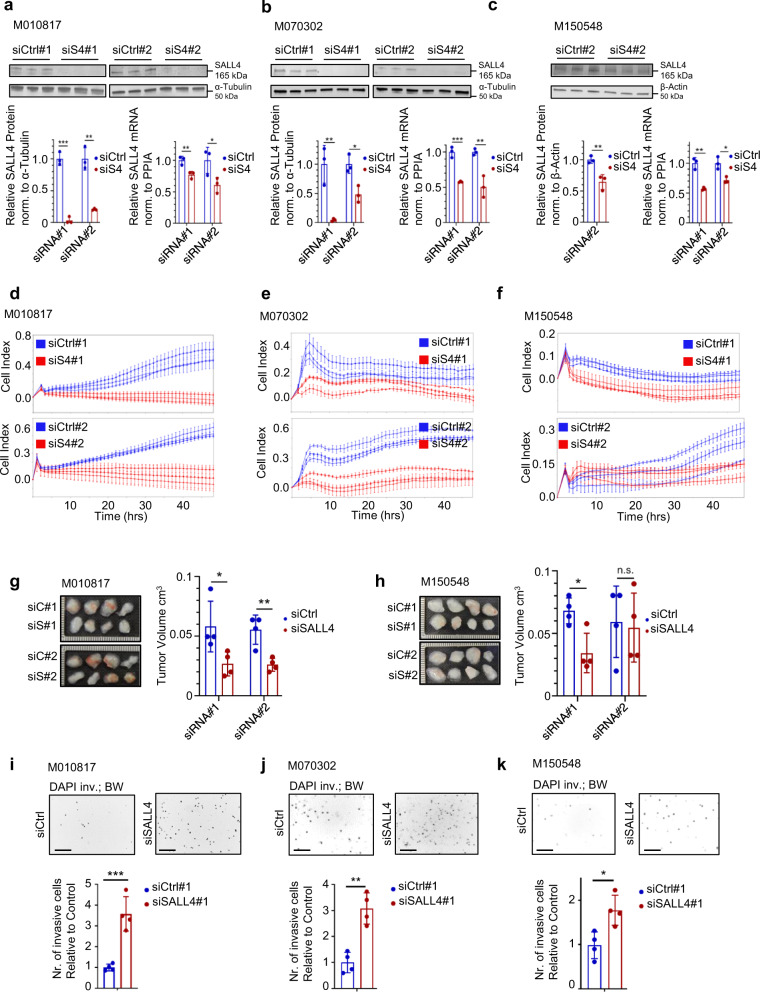
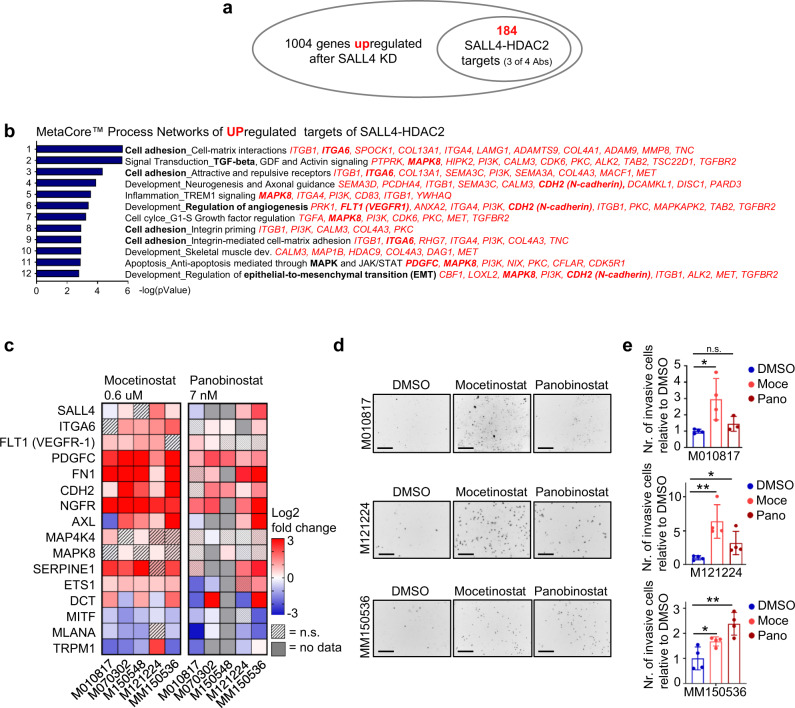
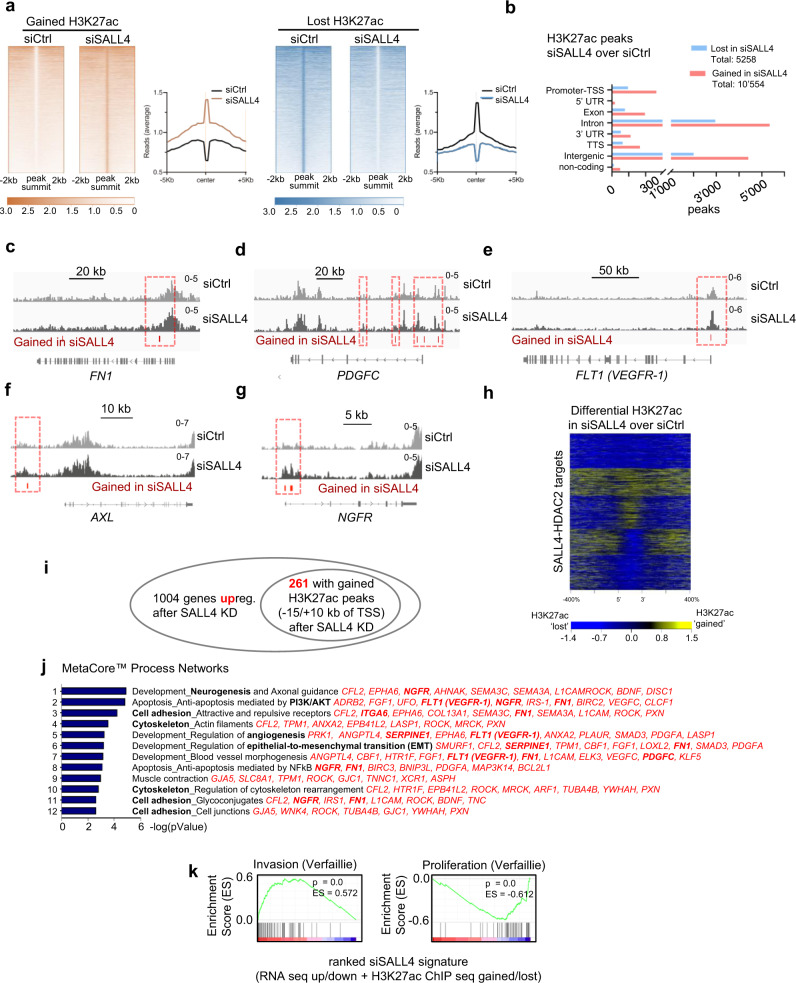
Melanoma cells rely on developmental programs during tumor initiation and progression. Here we show that the embryonic stem cell (ESC) factor Sall4 is re-expressed in the Tyr::NrasQ61K; Cdkn2a-/- melanoma model and that its expression is necessary for primary melanoma formation. Surprisingly, while Sall4 loss prevents tumor formation, it promotes micrometastases to distant organs in this melanoma-prone mouse model. Transcriptional profiling and in vitro assays using human melanoma cells demonstrate that SALL4 loss induces a phenotype switch and the acquisition of an invasive phenotype. We show that SALL4 negatively regulates invasiveness through interaction with the histone deacetylase (HDAC) 2 and direct co-binding to a set of invasiveness genes. Consequently, SALL4 knock down, as well as HDAC inhibition, promote the expression of an invasive signature, while inhibition of histone acetylation partially reverts the invasiveness program induced by SALL4 loss. Thus, SALL4 appears to regulate phenotype switching in melanoma through an HDAC2-mediated mechanism.


Conflict of interest statement

The authors declare no competing interests.

Figures

Fig. 1
Fig. 1. Sall4 is upregulated in hyperplastic melanocytes.
a Experimental scheme of isolated melanocytes for RNA sequencing either from Tyr::CreERT2; R26R-LSL-tdTomato wild-type mice or Tyr::CreERT2; R26R-LSL-tdTomato; Tyr::NrasQ61K; Cdkn2a−/− mice with hyperplastic, melanoma-prone skin. At the age of 4 months, the mice were injected on 5 consecutive days with 80 µg g−1 body weight tamoxifen to induce tdTomato expression in melanocytes. The hair growth cycle in wild-type animals was synchronized by dorsal hair plucking. Melanocytes were isolated from mouse back skin of wild-type and melanoma model mice (3–6 mice per sample) and FACS sorted for cKit (staining) and tdTomato (endogenous). b Row z-score heatmap of normalized counts from RNA sequencing as illustrated in a. Visualized are the top 20 most upregulated genes comparing hyperplastic (Tyr::NrasQ61K; Cdkn2a−/−) to wild-type melanocytes. Genes are ordered top to bottom with genes with highest LogFC values on top. Cutoffs were set at p values < 0.05 and FDR < 0.05. Sall4 (LogFC value = 9.59) represents the only and hence highest upregulated transcription factor within those top 20 upregulated genes. The complete list of all differentially expressed genes can be found under Supplementary Data 1. c Immunohistochemical staining of wild-type melanocytes in murine hair follicles (left panel) and melanoma-prone melanocytes in hyperplastic Tyr::NrasQ61K; Cdkn2a−/− mouse skin (right panel). Arrowheads point towards wild-type melanocytes with undetectable Sall4 expression; arrows point towards hyperplastic and rare wild-type melanocytes with detectable Sall4 protein. Experiment has been repeated independently three times with similar results. Scale bars 25 µm.
Fig. 2
Fig. 2. Sall4 is essential for primary tumor formation, but its depletion leads to increased micrometastasis.
a Genetics scheme of the Tyr::NrasQ61K; Cdkn2a−/− transgenic mouse model spontaneously developing melanoma, which was crossed with inducible Tyr:CreERT2; Sall4lox/lox; R26R-LSL-GFP mice, allowing ablation of Sall4 from the melanocytic lineage upon tamoxifen administration. b Experimental scheme depicting how at 1 month of age the experimental mice from a undergo Cre-mediated recombination due to 5 consecutive i.p. tamoxifen injections. Hyperplasia gradually develops from birth of the pups. Primary tumors and metastasis were assessed at around 6 months of age. c Photographs of control and heterozygous (Sall4lox/wt; termed Sall4+/− cko) and homozygous (Sall4lox/lox; termed Sall4−/− cko) Sall4 cko animals (left panel). Hematoxylin and eosin staining of back skin from respective control, Sall4+/− cko or Sall4−/− cko animals (right panel), which has been repeated in independent experiments with similar results 7 times. Scale bars 500 µm. d Quantification of primary tumor numbers of control (Sall4+/+ and non-tamoxifen-injected animals), Sall4+/− cko and Sall4−/− cko animals. e Quantification of proliferation rate, assessed by immunohistochemistry (see Supplementary Fig. 3c), in primary tumors of control and Sall4+/− cko animals. f Binocular images of mouse lungs. The endogenous fluorescent GFP signal was imaged under a fluorescent binocular and for visualization inverted and set to black/white (B/W). Dark spots therefore represent inverted GFP+ spots set to B/W. Scale bars 500 µm. g Immunohistochemical stainings of mouse lung sections to verify melanoma identity of GFP+ spots by means of MITF expression. Scale bars top panel 100 µm, second and third panel 25 µm. h Quantification of GFP+ lung metastases of tamoxifen-injected control (Sall4+/+), Sall4+/− cko, and Sall4−/− cko animals. Metastasis score = 0 indicates <5 GFP+ lesions, 1 >5 lesions, 2 >20 lesions, 3 >50 lesions, 4 >100 lesions. In d, e, h, error bars represent mean ± SEM with N indicated in the respective figures. Two-sided t-tests between groups were performed for significance with p values ≥0.05 = n.s.; <0.05 = *; <0.01 = **, with Sall4−/− cko in d P = 0.0049; Sall4+/− cko in e P = 0.0456; Sall4+/− cko in h P = 0.0011; Sall4−/− cko in h P = 0.0129. Source data for d, e, h are provided as a Source Data file.
Fig. 3
Fig. 3. SALL4 knockdown leads to reduced proliferation and increased invasion.
ac SALL4 expression after 48 h knockdown with two different siRNAs assessed by western blot (top panel and bottom panel left (quantification)) and qRT-PCR (bottom panel right) on the same samples. Experiments performed in human melanoma cells with different mutational backgrounds: M010817 (NRASQ61K), M070302 (unknown mutational status), M150548 (BRAFV600E). siS4: siSALL4. df xCELLigence real-time analysis of cell proliferation (Cell Index) of M010817, M070302, and M150548 cells after 48 h siRNA-mediated SALL4 knockdown as in ac. Three samples per experimental group were analyzed, each consisting of four technical replicas (proliferation wells analyzed by xCELLigence). gh In vivo xenografts after SALL4 knockdown: 24 h after siRNA treatment in vitro, cells were grafted subcutaneously onto nude mice and let grown for 6 days, when images were taken and tumor sizes of M010817 and M150548-derived grafts were quantified. Scale units = 1 mm. ik Corning Transwell® invasion assay: siControl or siSALL4-treated cells (48 h) were seeded onto the porous, matrigel-covered membrane of an invasion chamber insert and let to migrate from FCS-free (top chamber) to FCS high (lower chamber) medium. Numbers of invaded cells on the bottom side of the invasion membrane were analyzed after 24 h. Invaded cells were stained with DAPI, imaged and set to black and white (top panels) for quantification (bottom panels). Scale bars 200 µm. Error bars represent mean ± SD and for significance, two-sided t-tests were performed with N = 3 (af) and N = 4 (gk) and p values ≥0.05 = n.s.; <0.05 = *; <0.01 = ** and <0.001 = *** with siRNA#1 in a (lower left panel) P = 0.0001; siRNA#2 in a (lower left panel) P = 0.0015; siRNA#1 in a (lower right panel) P = 0.0099; siRNA#2 in a (lower right panel) P = 0.0476; siRNA#1 in b (lower left panel) P = 0.0070; siRNA#2 in b (lower left panel) P = 0.0133; siRNA#1 in b (lower right panel) P = 0.0006; siRNA#2 in b (lower right panel) P = 0.0058; siRNA#2 in c (lower left panel) P = 0.0094; siRNA#1 in c (lower right panel) P = 0.0016; siRNA#2 in c (lower right panel) P = 0.0129; siRNA#1 in g P = 0.0372; siRNA#2 in g P = 0.0047; siRNA#1 in h P = 0.0117; P in i = 0.0009; P in j = 0.0012; P in k = 0.0129. Source data for all panels are provided as a Source Data file.
Fig. 4
Fig. 4. RNA sequencing of SALL4 knockdown reveals an invasiveness gene expression signature.
a RNA seq row z-score heatmap of differentially expressed (DE) genes after 48 h SALL4 knockdown in the human cell line M010817. Cutoffs were set at Log2 ratio ≥ 0.27 or ≤−0.27, p value < 0.05 and FDR < 0.05 and resulted in 1004 genes significantly upregulated and 1140 genes significantly downregulated. b Top 12 MetaCoreTM process networks of upregulated genes. Top ten most upregulated genes per process are listed and genes validated in additional cell lines are highlighted in bold. c Top 12 MetaCoreTM process networks of downregulated genes. Top ten most downregulated genes per process are listed and genes validated in additional cell lines are highlighted in bold. d Gene Set Enrichment Analysis (GSEA) of DE genes after SALL4 knockdown (log2 ratio-ranked) as in a with published genesets characterizing invasive versus proliferative melanoma cells. e Log2 expression ratio heatmap of qRT-PCR-based gene expression analysis of specific genes of interest (normalized to PPIA and set relative to siCtrl-treated cells) in human melanoma cell lines (M010817: NRASQ61K; M070302: unknown mutational status; M150548: BRAFV600E; M121224: NRASQ61K and BRAFV600E; MM150536: BRAFV600E) after 48 h treatment with two different siRNAs targeting SALL4. Two-sided t-tests were performed with N = 3 and p values ≥ 0.05 = n.s. Source data for e are provided as a Source Data file.
Fig. 5
Fig. 5. SALL4 and HDAC2 interact and have a set of common target genes in melanoma cells.
a Western blot for SALL4 and HDAC2 after Co-Immunoprecipitation (Co-IP) with a SALL4 antibody in the human melanoma cells M010817. Experiment has been repeated independently with similar results two times. b CUT&RUN (C&R) in M010817 cells with two antibodies against SALL4 (SALL4_Ab#1 (S_Ab#1) and SALL4_Ab#2 (S_Ab#2)) and two antibodies against HDAC2 (HDAC2_Ab#1 (H_Ab#1) and HDAC2_Ab#2 (H_Ab#2)) and Ctrl (anti-FLAG) visualized as read density heatmaps of the centered peaks (within 10 kb) for all loci showing peaks with at least 3 of the 4 (2x SALL4, 2x HDAC2) antibodies. c C&R peak numbers called with SEACR for single antibodies, shared between antibodies and shared between at least 3 of the 4 SALL4-HDAC2 antibodies. In total 3319 loci contained peaks for at least 3 of 4 antibodies tested and were found in total 2301 different genes. Those peaks were used for further analyses correlating the direct targets with either expression (Fig. 6a, b) or acetylation status (Fig. 7h). d Annotation of C&R peaks to genetic regions. Green: the 5019 SALL4_Ab#1 and SALL4_Ab#2 shared peaks; yellow: the 1925 HDAC2_Ab#1 and HDAC2_Ab#2 shared peaks; grey: the 3319 peaks shared between at least 3 of the 4 SALL4_Ab#1, SALL4_Ab#2, HDAC2_Ab#1, and HDAC2_Ab#2 antibodies. TTS: transcription termination site, TSS: transcription start site, UTR: untranslated region. ei Specific gene tracks visualized with IGV. Green: SALL4_Ab#1 and SALL4_Ab#2; yellow; HDAC2_Ab#1, and HDAC2_Ab#2. Red dashed lines highlight significantly called peaks (with at least 3 of 4 antibodies). j Selected de novo DNA binding motifs of SALL4-HDAC2 (at least 3 of 4 antibodies) shared peaks analyzed by HOMER. Source data for a and d are provided as a Source Data file.
Fig. 6
Fig. 6. SALL4-HDAC2 targets that are upregulated after SALL4 depletion or HDAC inhibition enrich in invasion-related processes.
a Significantly upregulated genes after SALL4 knockdown (Fig. 4a, b) were overlaid with the C&R data of direct SALL4-HDAC2 targets (Fig. 5b, c), which resulted in 184 direct SALL4-HDAC2 targets significantly upregulated after SALL4 knockdown. b MetaCore™ Process Network enrichment of the 184 direct targets from a. The top 12 most significant processes are given with the specific genes of each process listed in red. Genes that were validated for DE  in other cell lines are highlighted in bold. c Log2 fold change heatmap of qRT-PCR-based gene expression (normalized to PPIA and set relative to vehicle (DMSO)-treated samples) after 48 h cell treatment with the HDAC inhibitors Mocetinostat (0.6 µM) and Panobinostat (7 nM). t-tests were performed for significance between HDACi and vehicle-treated groups with N = 3 and p values ≥ 0.05 = not significant (n.s.). d Images of DAPI-stained nuclei in invasion assays as in Fig. 3 i–k. Cells were seeded into the invasion chamber, which was supplemented with vehicle or 600 nM Mocetinostat or 7 nM Panobinostat in both the starvation as well as the FCS high medium. After 24 h, the invaded cells were analyzed by counting DAPI-stained nuclei of invaded cells at the bottom of the membrane (inverted and set to black and white (B/W)). Scale bars 200 µm. e Quantification of invaded cells in d set relative to control cells. Moce: mocetinostat, Pano: panobinostat. Error bars represent mean ± SD in e. For significance, two-sided t-tests were performed with N = 3 (c) and N = 4 (e) and p values ≥0.05 = n.s.; <0.05 = *; <0.01 = **; and <0.001 = *** with Moce in e (top panel) P = 0.0218; Moce in e (middle panel) P = 0.0051; Pano in e (middle panel) P = 0.0463; Moce in e (lower panel) P = 0.0332; Pano in e (lower panel) P = 0.0051. Source data for c and e are provided as a Source Data file.
Fig. 7
Fig. 7. SALL4 can regulate invasiveness genes through an epigenetic mechanism.
a Read density heatmap of gained and lost H3K27ac ChIP sequencing peaks (±2 kb) upon SALL4 knockdown (left panels) and average read distribution of gained and lost H3K27ac peaks within ±5 kb from peak center (right panels). b Distribution of the gained and lost H3K27ac peaks in different genetic regions. TTS: transcription termination site, TSS: transcription start site, UTR: untranslated region. cg Representative tracks of invasiveness genes with significantly gained (red bars; highlighted by red, dashed lines) H3K27ac peaks in siSALL4 over siCtrl (no significantly lost H3K27ac peaks were detected for the visualized gene tracks). h Read density heatmap of differential H3K27ac ChIP-seq peaks (within 10 kb) in siSALL4 over siCtrl at direct target genes of SALL4-HDAC2 (CUT&RUN peaks with at least 3 of 4 SALL4/HDAC2 antibodies). i Significantly upregulated genes after SALL4 knockdown (Fig. 4a, b) were overlaid with those genes that have significantly gained H3K27ac marks −15/+10 kb of TSS (a, ocher panel). This resulted in 261 genes with activating chromatin marks that were at the same time upregulated after SALL4 knockdown. j MetaCore™ Process Network enrichment of the 261 genes from i. The top 12 most significant processes are indicated with the specific genes of each process listed in red. k Gene Set Enrichment Analysis (GSEA) of the combined 261 upregulated (i) and 137 downregulated genes (Supplementary Fig. 17a) with differential acetylation after SALL4 knockdown (ranked according to log2 expression ratio of RNA seq results) with the previously published melanoma programs of Verfaillie and colleagues (2015). Source data for b are provided as a Source Data file.

References

    1. Hanahan D, Weinberg RA. The hallmarks of cancer. Cell. 2000;100:57–70. doi: 10.1016/S0092-8674(00)81683-9. - DOI - PubMed
    1. Nebbioso A, Tambaro FP, Dell’Aversana C, Altucci L. Cancer epigenetics: moving forward. PLoS Genet. 2018;14:e1007362. doi: 10.1371/journal.pgen.1007362. - DOI - PMC - PubMed
    1. Suvà ML, Riggi N, Bernstein BE. Epigenetic reprogramming in cancer. Science. 2013;339:1567–1570. doi: 10.1126/science.1230184. - DOI - PMC - PubMed
    1. Bernhardt M, et al. Melanoma-derived iPCCs show differential tumorigenicity and therapy response. Stem Cell Rep. 2017;8:1379–1391. doi: 10.1016/j.stemcr.2017.03.007. - DOI - PMC - PubMed
    1. Boumahdi S, et al. SOX2 controls tumour initiation and cancer stem-cell functions in squamous-cell carcinoma. Nature. 2014;511:246–250. doi: 10.1038/nature13305. - DOI - PubMed

Publication types

MeSH terms