. 2021 Aug 20;12(1):5068.
doi: 10.1038/s41467-021-25390-0.

O-GlcNAcylated p53 in the liver modulates hepatic glucose production

Affiliations

O-GlcNAcylated p53 in the liver modulates hepatic glucose production

Maria J Gonzalez-Rellan et al. Nat Commun. .

Abstract

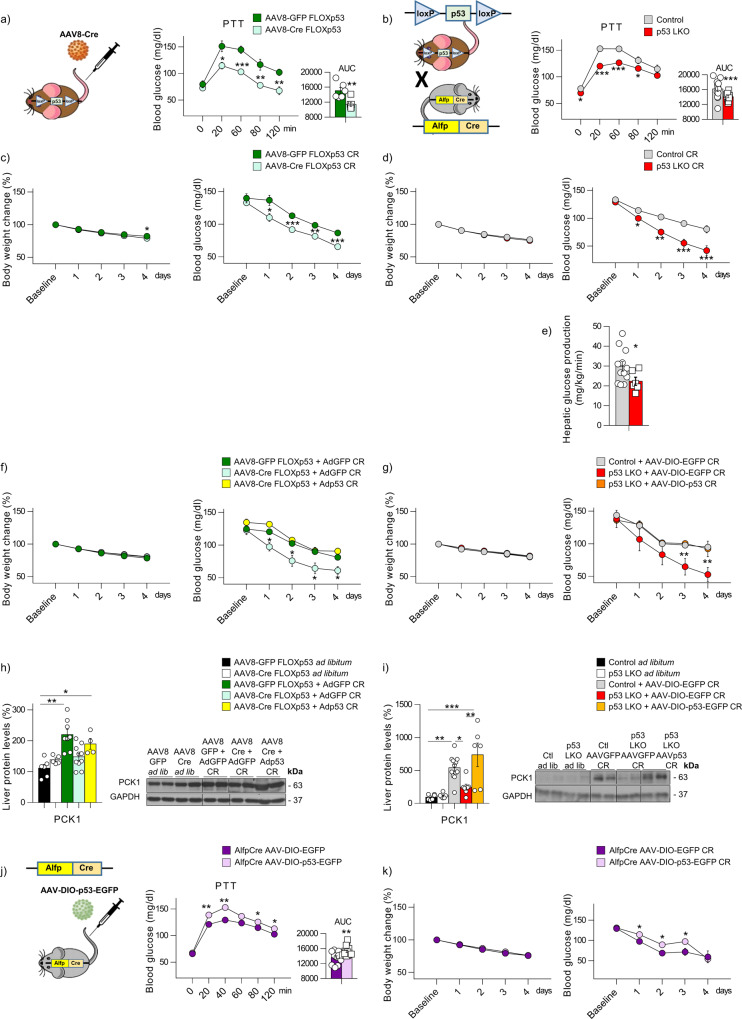
p53 regulates several signaling pathways to maintain the metabolic homeostasis of cells and modulates the cellular response to stress. Deficiency or excess of nutrients causes cellular metabolic stress, and we hypothesized that p53 could be linked to glucose maintenance. We show here that upon starvation hepatic p53 is stabilized by O-GlcNAcylation and plays an essential role in the physiological regulation of glucose homeostasis. More specifically, p53 binds to PCK1 promoter and regulates its transcriptional activation, thereby controlling hepatic glucose production. Mice lacking p53 in the liver show a reduced gluconeogenic response during calorie restriction. Glucagon, adrenaline and glucocorticoids augment protein levels of p53, and administration of these hormones to p53 deficient human hepatocytes and to liver-specific p53 deficient mice fails to increase glucose levels. Moreover, insulin decreases p53 levels, and over-expression of p53 impairs insulin sensitivity. Finally, protein levels of p53, as well as genes responsible of O-GlcNAcylation are elevated in the liver of type 2 diabetic patients and positively correlate with glucose and HOMA-IR. Overall these results indicate that the O-GlcNAcylation of p53 plays an unsuspected key role regulating in vivo glucose homeostasis.


Conflict of interest statement

The authors declare the following competing interests: O.M. and G.B. are employees of ATLAS Molecular Pharma.

Figures

Fig. 1
Fig. 1. p53 is stabilized in the liver upon starvation by O-GlcNAcylation.
a p53 protein levels in the liver of mice fed ad libitum (n = 8), 24-h-fast (n = 7) or 24-h-refed (RF) (n = 8). b p53 protein and mRNA levels in the liver of mice fed ad libitum (n = 4 and 5), and mice fasted for 6 h (n = 4 and 6), 12 h (n = 4), or 24 h (n = 4). c body weight, blood glucose, p53 protein, and mRNA levels in the liver of mice fed ad libitum (n = 8), fasted for 24 h (n = 8), and fed with sugar (n = 8). d p53 and OGT protein levels in THLE-2 cells maintained in complete medium (CM) (n = 4 and 6) or starved 6 h in KHH medium without (n = 4) or with glucose 1 mM (n = 3 and 5) or 10 mM (n = 3 and 6). e OGT protein levels in the liver of mice fed ad libitum (n = 4), and mice fasted for 6 h (n = 4), 12 h (n = 5), 16 h (n = 6), and 24 h (n = 6). O-GlcNAcylated p53 in: f liver of fasted mice (n = 4); g complete medium (CM) (n = 3) and starved cells for 6 h (n = 4). h) p53 protein levels in THLE-2 cells in the absence (n = 6) or presence of PUGNAc 5 (n = 5), 25 (n = 5), and 75 µM (n = 5). i p53 protein levels in THLE-2 cells in the absence or presence of OSMI-1 (10, 40, and 100 µM) (n = 3). Expression of GAPDH (western blot) and HPRT (qRT-PCR) served as a loading control, and control values were normalized to 100%. Dividing lines indicate splicings within the same gel. Data were presented as mean ± standard error mean (SEM). * denotes P < 0.05, ** denotes P < 0.01, and *** denotes P < 0.001, determined by two-tailed Student’s t-test (b, e, f, and g) or one-way ANOVA followed by Bonferroni post hoc testing (a, c, d, h, and i). “n” denotes independent animals or cell culture wells. Source data are provided as a Source Data file.
Fig. 2
Fig. 2. p53 binds to PCK1 and regulates its transcriptional activity.
a Protein levels of p53, pPDH, PC, PCK1, and G6Pase (n = 6) and b PCK1 activity (n = 6) in THLE-2 cells in complete medium (CM) or KHH for 6 h. c PCK1 activity after the overexpression of p53 (n = 6). d Glucose levels after the overexpression of p53 and silencing PCK (n = 6). e Glucose levels after the silencing of p53 and overexpression of PCK1 (n = 6). f Protein levels of p53, pPDH, PC, PCK1, and G6Pase (n = 6) and g Oxaloacetate levels in Hep3B cells in complete medium or KHH for 6 h (n = 6). h mRNA (n = 7 and 9) and i Protein levels (n = 5) of PCK1 after the rescue of p53 in Hep3B cells. j PCK1 levels in the liver of mice fed ad libitum (n = 5), mice fasted for 6 (n = 5), 12 (n = 5), or 24-h, and mice 24-h-refed (n = 5). k Putative motifs for p53 found in the PCK1 promoter. l p53 binding sites (black spots) in the PCK1 proximal promoter (−1330 bp). Luciferase activity in Hep3B cells transfected as described in the panel (n = 4). m Diagram of the −490/+1 PCK1 gene promoter showing the location of primers used in the ChIP assay. Black spots show the location of the p53 response elements in the PCK1 promoter. Soluble chromatin prepared from AML12 cells transfected with control plasmid or plasmid encoding p53 was immunoprecipitated with an anti-p53 antibody or IgG. An immunoprecipitated proximal sequence of PCK1 was amplified and n quantified using three (1, 2, and 3) different pairs of primers. Images are representative of three independent experiments. o PCK1 levels in THLE-2 cells and p Hep3B cells transfected as indicated in panels and treated with PUGNAc 6 h (n = 6). q ChIP assay in WT mice fed ad libitum (n = 4) or subjected to 60% calorie restriction (CR) (n = 5). Diagram of the PCK1 gene promoter showing the location of the amplified region and quantification. Expression of GAPDH (western blot) and HPRT (qRT-PCR) served as a loading control, and control values were normalized to 100%. Dividing lines indicate splicings within the same gel. Data were presented as mean ± standard error mean (SEM). * denotes P < 0.05, ** denotes P < 0.01, and *** denotes P < 0.001, determined by two-tailed Student’s t-test (a, c, f, g, h, i, j, l, n, and q) or one-way ANOVA followed by Bonferroni post hoc testing (b, d, e, o, and p). “n” denotes independent animals or cell culture wells. Source data are provided as a Source Data file.
Fig. 3
Fig. 3. O-GlcNAcylation of p53 regulates PCK1 protein levels.
a p53 protein levels in Hep3B cells transfected with empty plasmid (p0), or a plasmid encoding p53-S149A mutant (2-4-8 µg) (n = 4). b PCK1 protein levels (n = 4) and c PCK1 activity (n = 6) in Hep3B cells transfected with empty plasmid, a plasmid encoding p53-WT (pp53) or a plasmid encoding p53-S149A (pS149A). d p53 and PCK1 protein levels in Hep3B transfected with empty plasmid or a plasmid encoding p53-S149A maintained in complete medium (CM) or KHH medium for 6 h (n = 6). e p53 and PCK1 protein levels in Hep3B transfected with empty plasmid or a plasmid encoding p53-S149A and treated with vehicle or PUGNAc 75 µM (n = 6). f p53 and PCK1 protein levels (p0 n = 5 and pS149A n = 4) and g PCK1 activity (n = 5) in THLE-2 cells transfected with empty plasmid or a plasmid encoding p53-S149A. h Metabolomic flux in Hep3B cells transfected with empty plasmid, a plasmid encoding p53-WT or a plasmid encoding p53-S149A (n = 3). i Schematic representation of the animal model and procedure: inhibition of OGT with a lentivirus encoding shOGT and overexpression of p53 with an adenovirus encoding p53, in the liver of WT mice finally placed on fasting for 24 h. j Blood glucose levels (n = 10) and k protein levels of OGT, p53, and PCK1 in the liver of each of the groups described above (n = 5 and 8). l Immunoprecipitated p53 and O-GlcNAc/p53 ratio (n = 4). Expression of GAPDH served as a loading control, and control values were normalized to 100%. Dividing lines indicate splicings within the same gel. Data were presented as mean ± standard error mean (SEM). * denotes P < 0.05, ** denotes P < 0.01, and *** denotes P < 0.001, determined by two-tailed Student’s t-test (f) or one-way ANOVA followed by Bonferroni post hoc testing (a, b, c, d, e, h, j, k, and l). “n” denotes independent animals or cell culture wells. Source data are provided as a Source Data file.
Fig. 4
Fig. 4. Mice lacking p53 in the liver do not maintain glucose levels during caloric restriction.
a Pyruvate tolerance test (PTT) in p53floxed mice injected with either AAV8-GFP (control group; n = 6) or AAV8-Cre (n = 7). b PTT in control mice (n = 13) and p53 LKO mice (n = 12). Body weight and blood glucose levels in: c p53floxed mice injected with either AAV8-GFP (n = 10) or AAV8-Cre (n = 14) and d p53 LKO mice fed ad libitum (n = 12) or subjected to 60% calorie restriction (CR) for 4 days (n = 17). e Hepatic glucose production in both p53 LKO (n = 6) mice and their control littermates (n = 12) on the fourth day of calorie restriction. Body weight and blood glucose levels after the rescue of hepatic p53 in: f p53 floxed mice injected with either AAV8-GFP or AAV8-Cre (n = 6 and 7 per group) and g p53 LKO mice, subjected to 60% calorie restriction for 4 days (n = 10, 5, and 7 per group). h, i Hepatic PCK1 protein levels in each of the groups described above. j PTT in mice over-expressing GFP (n = 12) or p53 in the liver (n = 15 per group). k Body weight and blood glucose levels in mice over-expressing p53 in the liver after 60% calorie restriction for 4 days. The area under the curve (AUC) is provided. Expression of GAPDH served as a loading control, and control values were normalized to 100%. Dividing lines indicate splicings within the same gel. Data were presented as mean ± standard error mean (SEM). * denotes P < 0.05, ** denotes P < 0.01, and *** denotes P < 0.001, determined by two-tailed Student’s t-test (a, b, c, d, e, j, and k) or one-way ANOVA followed by Bonferroni post hoc testing (f, g, h, and i). “n” denotes independent animals. Source data are provided as a Source Data file.
Fig. 5
Fig. 5. Hepatic p53 mediates the gluconeogenic action of glucagon.
p53 levels in a THLE-2 cells treated with glucagon (n = 5); b THLE-2 cells treated with glucagon and OSMI-1 (n = 6). c Protein levels of p53, CREB, pCREB, and PCK1 (n = 4) and d PCK1 activity (n = 6) in THLE-2 cells treated with empty-siRNA or siRNA-p53, and then kept in KHH or KHH + glucagon. e Protein levels of p53, CREB, and pCREB in THLE-2 cells treated with forskolin 2 µM (n = 6). f Protein levels of CREB, pCREB, and PCK1 in THLE-2 cells treated with empty-siRNA or siRNA-p53, and then challenged with forskolin (n = 6). g Glucose levels in THLE-2 cells treated with empty-siRNA or siRNA-p53 incubated with or without forskolin (n = 5). h PCK1 levels in Hep3B starved cells in the presence or absence of glucagon (n = 6). i Protein levels of CREB, pCREB, and PCK1 in Hep3B cells treated with forskolin (n = 6). j Protein levels of PCK1 and k glucose levels in Hep3B cells transfected with empty plasmid or plasmid encoding p53 and then treated with forskolin (n = 6). l Blood glucose levels in p53 floxed mice injected with AAV8 expressing either GFP (n = 6 and 7) or Cre (n = 7 and 9) and then treated with saline or glucagon (200 µg kg−1). m Blood glucose levels in p53 LKO mice and their control littermates treated with saline or glucagon (n = 6). n O-GlcNAcylation of p53 in WT mice treated with saline or glucagon (200 µg kg−1) (n = 4). o Schematic representation of the role of p53 in glucagon-induced gluconeogenesis. Expression of GAPDH served as a loading control, and control values were normalized to 100%. Data were presented as mean ± standard error mean (SEM). * denotes P < 0.05, ** denotes P < 0.01, and *** denotes P < 0.001, determined by two-tailed Student’s t-test (e, g, i, k, and n) or one-way ANOVA followed by Bonferroni post hoc testing (a, b, c, d, f, j, l, and m). “n” denotes independent animals or cell culture wells. Source data are provided as a Source Data file.
Fig. 6
Fig. 6. Hepatic p53 mediates the gluconeogenic action of adrenaline and cortisol.
a p53 levels in THLE-2 cells in the presence or absence of adrenaline (n = 5). b p53 levels in THLE-2 cells kept in complete medium (CM) or KHH + adrenaline in the presence or absence of OSMI-1 (n = 6). c Protein levels of p53 and PCK1 and d PCK1 activity in THLE-2 cells transfected with empty-siRNA or siRNA-p53 and then treated with KHH alone (n = 5) or KHH + adrenaline (n = 7). e PCK1 levels in Hep3B cells maintained in CM or KHH in the presence or absence of adrenaline (n = 5). f Blood glucose levels in p53 floxed mice injected with AAV8 expressing either GFP or Cre and then treated with saline or adrenaline (n = 6); * depicts differences compared to AAV8-GFP + saline, # depicts differences between AAV8-GFP and AAV8-Cre mice treated with adrenaline. g Blood glucose levels in p53 LKO mice and their control littermates treated with saline or adrenaline (n = 6). * depicts differences compared to control + saline, and # depicts differences between control and LKO mice treated with adrenaline. h p53 levels in THLE-2 cells incubated with different cortisol concentrations (n = 5). i p53 levels in THLE-2 cells kept in CM or KHH + hydrocortisone in the presence or absence of OSMI-1 (n = 3). j Protein levels (n = 6) of PCK1 and p53 and k PCK1 activity (n = 5) in THLE-2 cells transfected with empty-siRNA or siRNA-p53, and then treated with hydrocortisone. l PCK1 levels in starved Hep3B cells with different cortisol concentrations (n = 5). m Blood glucose levels in p53 floxed mice injected with AAV8 expressing either GFP or Cre and then treated with saline or hydrocortisone (n = 7 and 10). n Blood glucose levels in p53 LKO mice and their control littermates treated with saline or hydrocortisone (n = 7 and 12). Expression of GAPDH served as a loading control, and control values were normalized to 100%. Dividing lines indicate splicings within the same gel. Data were presented as mean ± standard error mean (SEM). * or # denotes P < 0.05, ** denotes P < 0.01, and *** denotes P < 0.001, determined in all cases by one-way ANOVA followed by Bonferroni post hoc testing. “n” denotes independent animals or cell culture wells. Source data are provided as a Source Data file.
Fig. 7
Fig. 7. Overexpression of hepatic p53 worsens insulin sensitivity.
a p53 levels in THLE-2 cells maintained in complete medium (CM) (n = 5), KHH (n = 4), or KHH + insulin (n = 4). b Protein levels of p53 and PCK1 in THLE-2 cells maintained in CM, KHH, or KHH + insulin (n = 5). c Protein levels of p53 and PCK1 in THLE-2 cells transfected with empty plasmid or plasmid encoding p53 and then treated with insulin (n = 6). d PCK1 activity (n = 6) and e glucose production (p0 n = 4; p0 + insulin 10 nM n = 5; and pp53 + insulin 10 nM n = 6) in THLE-2 cells transfected with empty plasmid or plasmid encoding p53 cells in the absence or presence of insulin. f Protein levels of p53 and PCK1 in THLE-2 cells are maintained in KHH in the presence or absence of insulin and PUGNAc (n = 6). g Protein levels of pAKT, p53, and PCK1 in THLE-2 cells maintained in CM (n = 3) or KHH in the absence (n = 3) or presence of SC79 (n = 4). h PCK1 levels in THLE-2 cells transfected with empty plasmid or plasmid encoding p53 and then treated with SC79 (n = 6). i Protein levels of p53 and PCK1 in mice injected with empty adenovirus or p53 adenovirus (Adp53) (n = 3 and 6 per group). j Protein levels of pAKT, p53, and PCK1 in control mice or mice over-expressing p53 and then treated with saline or insulin into the cava vein (n = 6 and 7). k Blood glucose levels after IP insulin treatment (n = 8 and 10) and l protein levels of PCK1 in Alfp-Cre± mice injected with AAV8-DIO expressing either GFP or p53 and then treated with saline or insulin into the cava vein (n = 4 and 5).* depicts differences between AAV-EGFP + saline and AAV-EGFO + insulin and # depicts differences between AAV-EGFP and AAV-p53 treated with adrenaline. m Schematic representation of the role of p53 in insulin-induced gluconeogenesis suppression. Expression of GAPDH served as a loading control, and control values were normalized to 100%. Dividing lines indicate splicings within the same gel. Data were presented as mean ± standard error mean (SEM). * and # denotes P < 0.05, ** denotes P < 0.01, and *** denotes P < 0.001, determined by two-tailed Student’s t-test (i, j, and l) or one-way ANOVA followed by Bonferroni post hoc testing (a, b, c, d, e, f, g, h, and k). “n” denotes independent animals or cell culture wells. Source data are provided as a Source Data file.
Fig. 8
Fig. 8. Hepatic p53 affects postprandial hyperglycemia and is elevated in models of insulin resistance.
a Hepatic OGT and p53 protein levels in WT mice fed with standard diet or high-fat diet (HFD) 60% for 4 days (n = 7). Hepatic OGT protein levels in (b) control mice and p53 LKO mice fed with HFD 60% for 4 days (n = 6) and c FLOXp53 mice injected with AAV8 expressing either GFP (n = 7) or Cre (n = 5) and fed with HFD 60% for 4 days. Blood glucose levels in Alfp-Cre± mice injected with AAV-DIO expressing either GFP or p53 refed with d chow diet (n = 11 and 12) and e HFD after overnight fasting (n = 11 and 12). Blood glucose levels in FLOXp53 mice injected with AAV8 expressing either GFP or Cre refed with f chow (n = 6 and 8) diet and g HFD after overnight fasting (n = 5 and 6). Blood glucose levels in control and p53 LKO (n = 6) mice refed with h chow (n = 5 and 7) diet and i HFD (n = 7) after overnight fasting. j Hepatic p53 and PCK1 protein levels in WT (n = 4) and db/db mice (n = 9). The area under the curve (AUC) is provided. Expression of GAPDH served as a loading control and control values were normalized to 100%. Dividing lines indicate splicings within the same gel. Data were presented as mean ± standard error mean (SEM). * denotes P < 0.05, ** denotes P < 0.01, and *** denotes P < 0.001, determined by two-tailed Student’s t-test. “n” denotes independent animals. Source data are provided as a Source Data file.
Fig. 9
Fig. 9. p53 protein levels are increased in the liver of patients with T2D.
Obese patients were further subclassified according to their normoglycemia (NG) or type 2 diabetes (T2D) (n = 30 human patients per group). a Hepatic p53 mRNA levels in NG or T2D patients. b Hepatic p53 and PCK1 protein levels in patients with NG and T2D. c Correlation between p53 protein levels and OGTT. d Expression of OGT, OGA, GFAT1, and GFAT2 in patients with NG and T2D. e Correlation between GFAT1 and GFAT2 expression and OGTT. Expression of GAPDH (western blot) and HPRT (qRT-PCR) served as a loading control, and control values were normalized to 100%. Dividing lines indicate splicings within the same gel. Data were presented as mean ± standard error mean (SEM). * denotes P < 0.05, ** denotes P < 0.01, and *** denotes P < 0.05 determined by two-tailed Student’s t-test. Source data are provided as a Source Data file.

References

    1. Efeyan A, Serrano M. p53: guardian of the genome and policeman of the oncogenes. Cell Cycle. 2007;6:1006–1010. doi: 10.4161/cc.6.9.4211. - DOI - PubMed
    1. Berkers CR, et al. Metabolic regulation by p53 family members. Cell Metab. 2013;18:617–633. doi: 10.1016/j.cmet.2013.06.019. - DOI - PMC - PubMed
    1. Goldstein I, Rotter V. Regulation of lipid metabolism by p53 - fighting two villains with one sword. Trends Endocrinol. Metab. 2012;23:567–575. doi: 10.1016/j.tem.2012.06.007. - DOI - PubMed
    1. Kawauchi K, et al. p53 regulates glucose metabolism through an IKK-NF-kappaB pathway and inhibits cell transformation. Nat. Cell Biol. 2008;10:611–618. doi: 10.1038/ncb1724. - DOI - PubMed
    1. Bensaad K, et al. TIGAR, a p53-inducible regulator of glycolysis and apoptosis. Cell. 2006;126:107–120. doi: 10.1016/j.cell.2006.05.036. - DOI - PubMed

Publication types

MeSH terms