. 2021 Oct;22(10):1306-1315.
doi: 10.1038/s41590-021-01021-0. Epub 2021 Aug 20.

mRNA-1273 protects against SARS-CoV-2 beta infection in nonhuman primates

Affiliations

mRNA-1273 protects against SARS-CoV-2 beta infection in nonhuman primates

Kizzmekia S Corbett et al. Nat Immunol. 2021 Oct.

Abstract

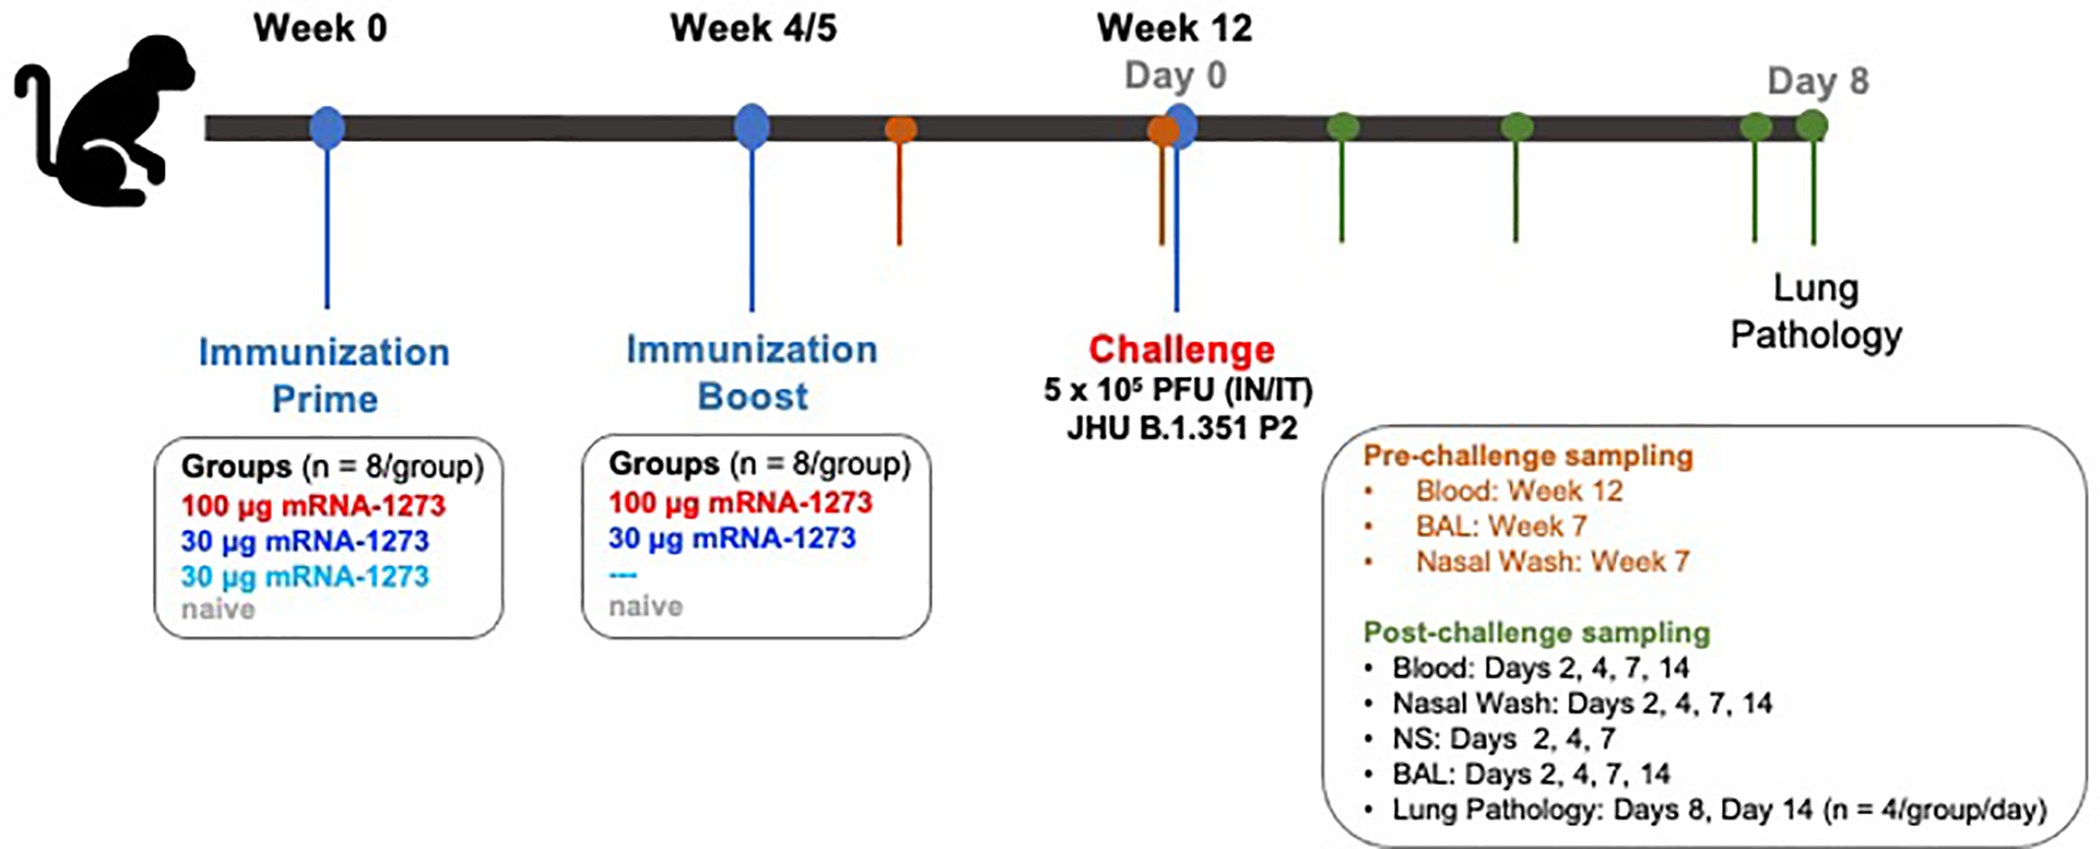
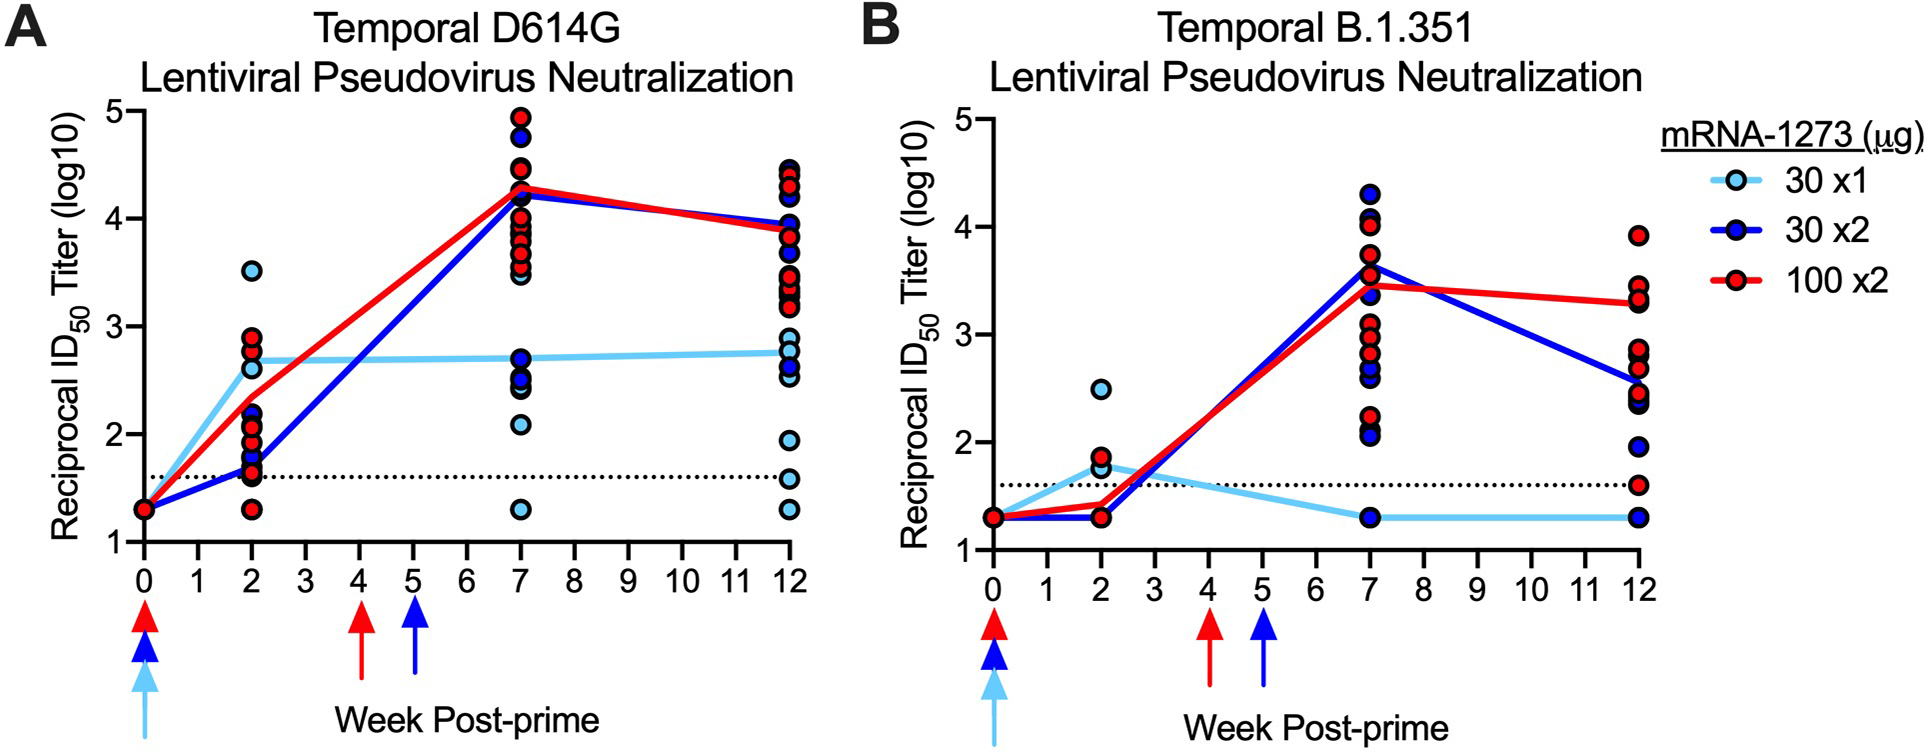
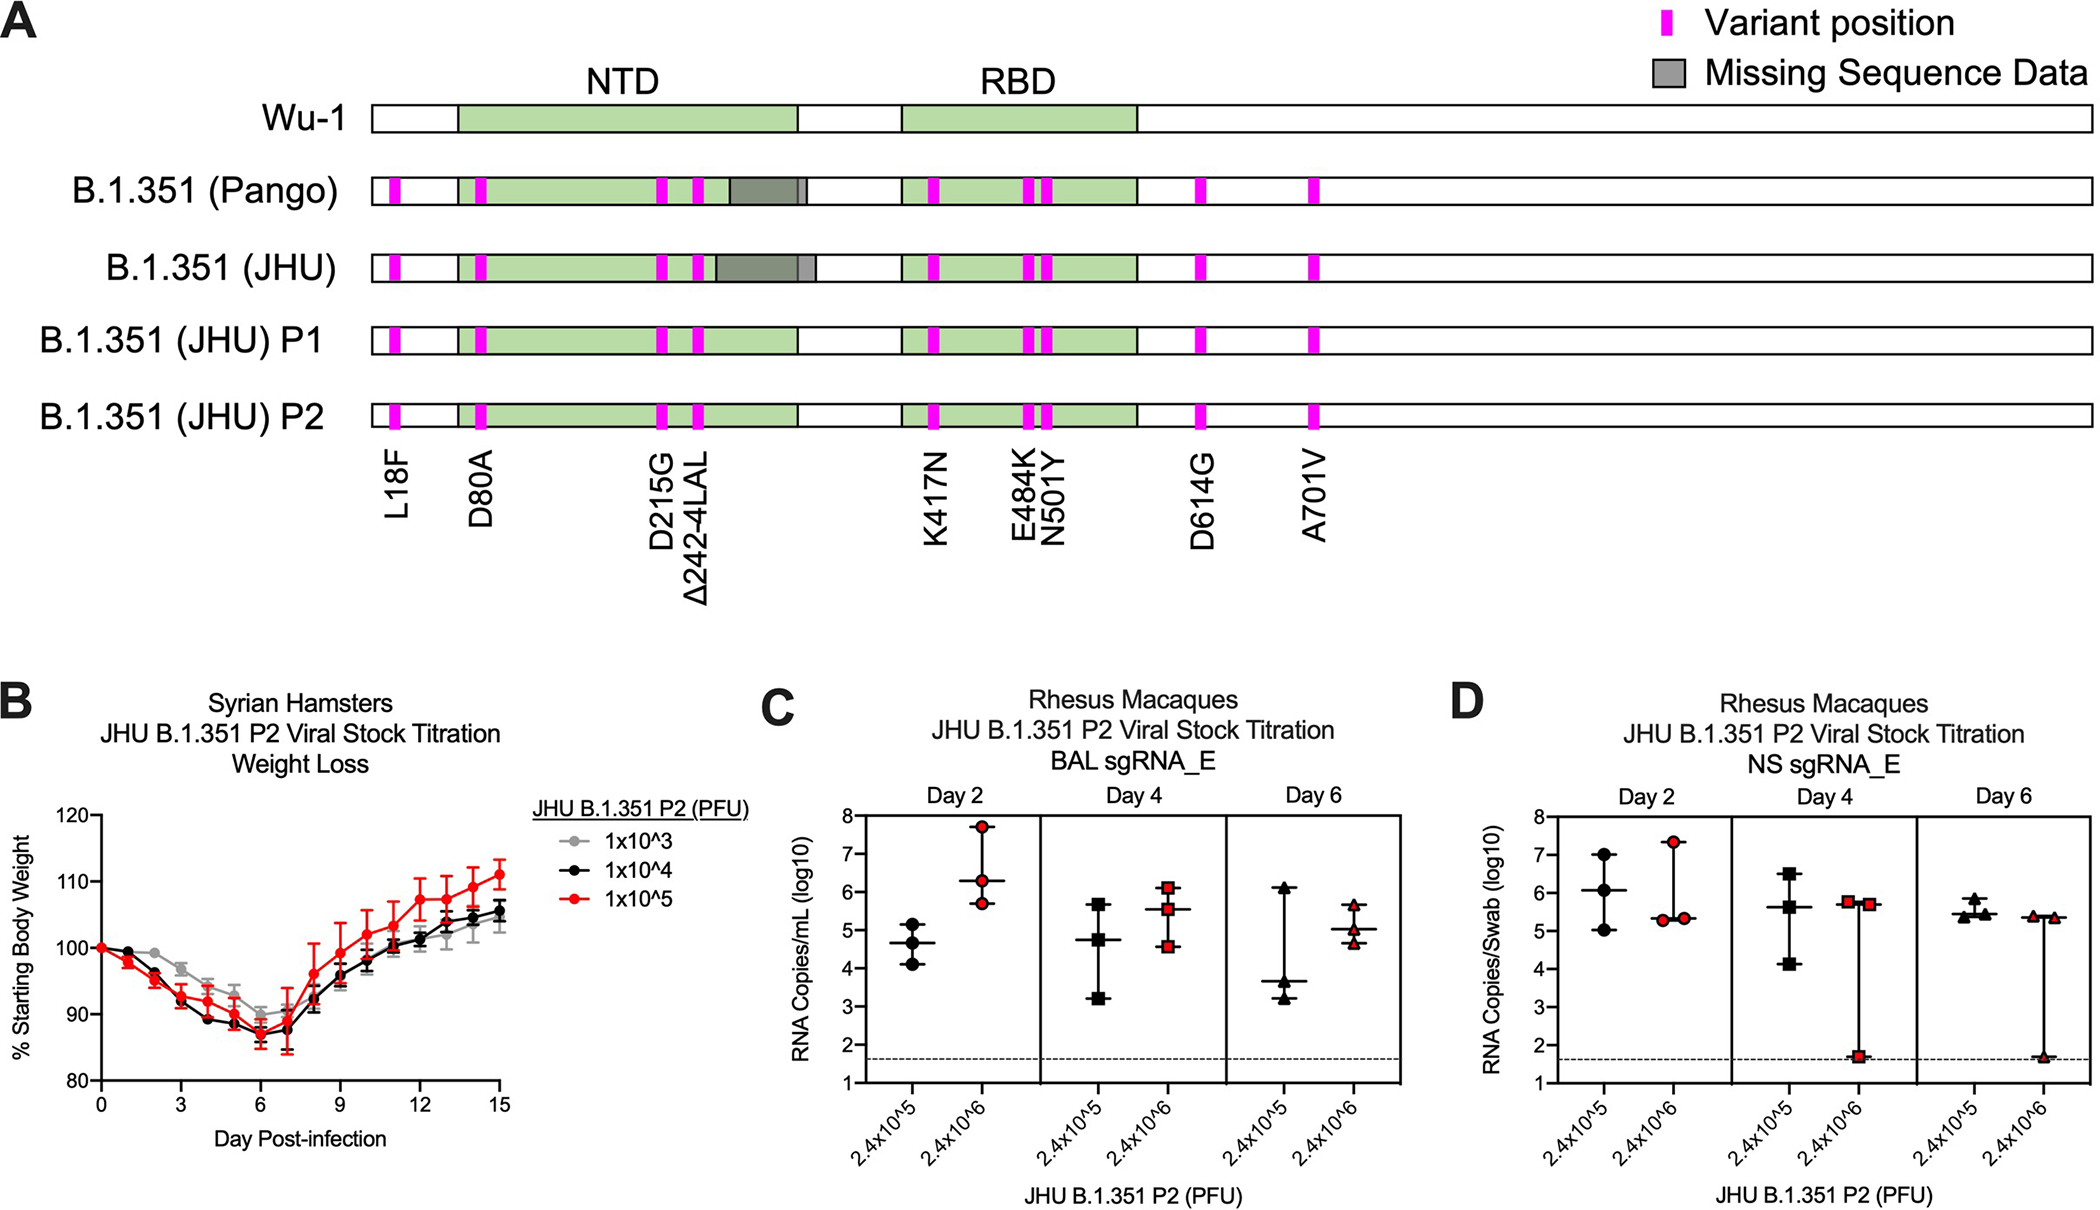
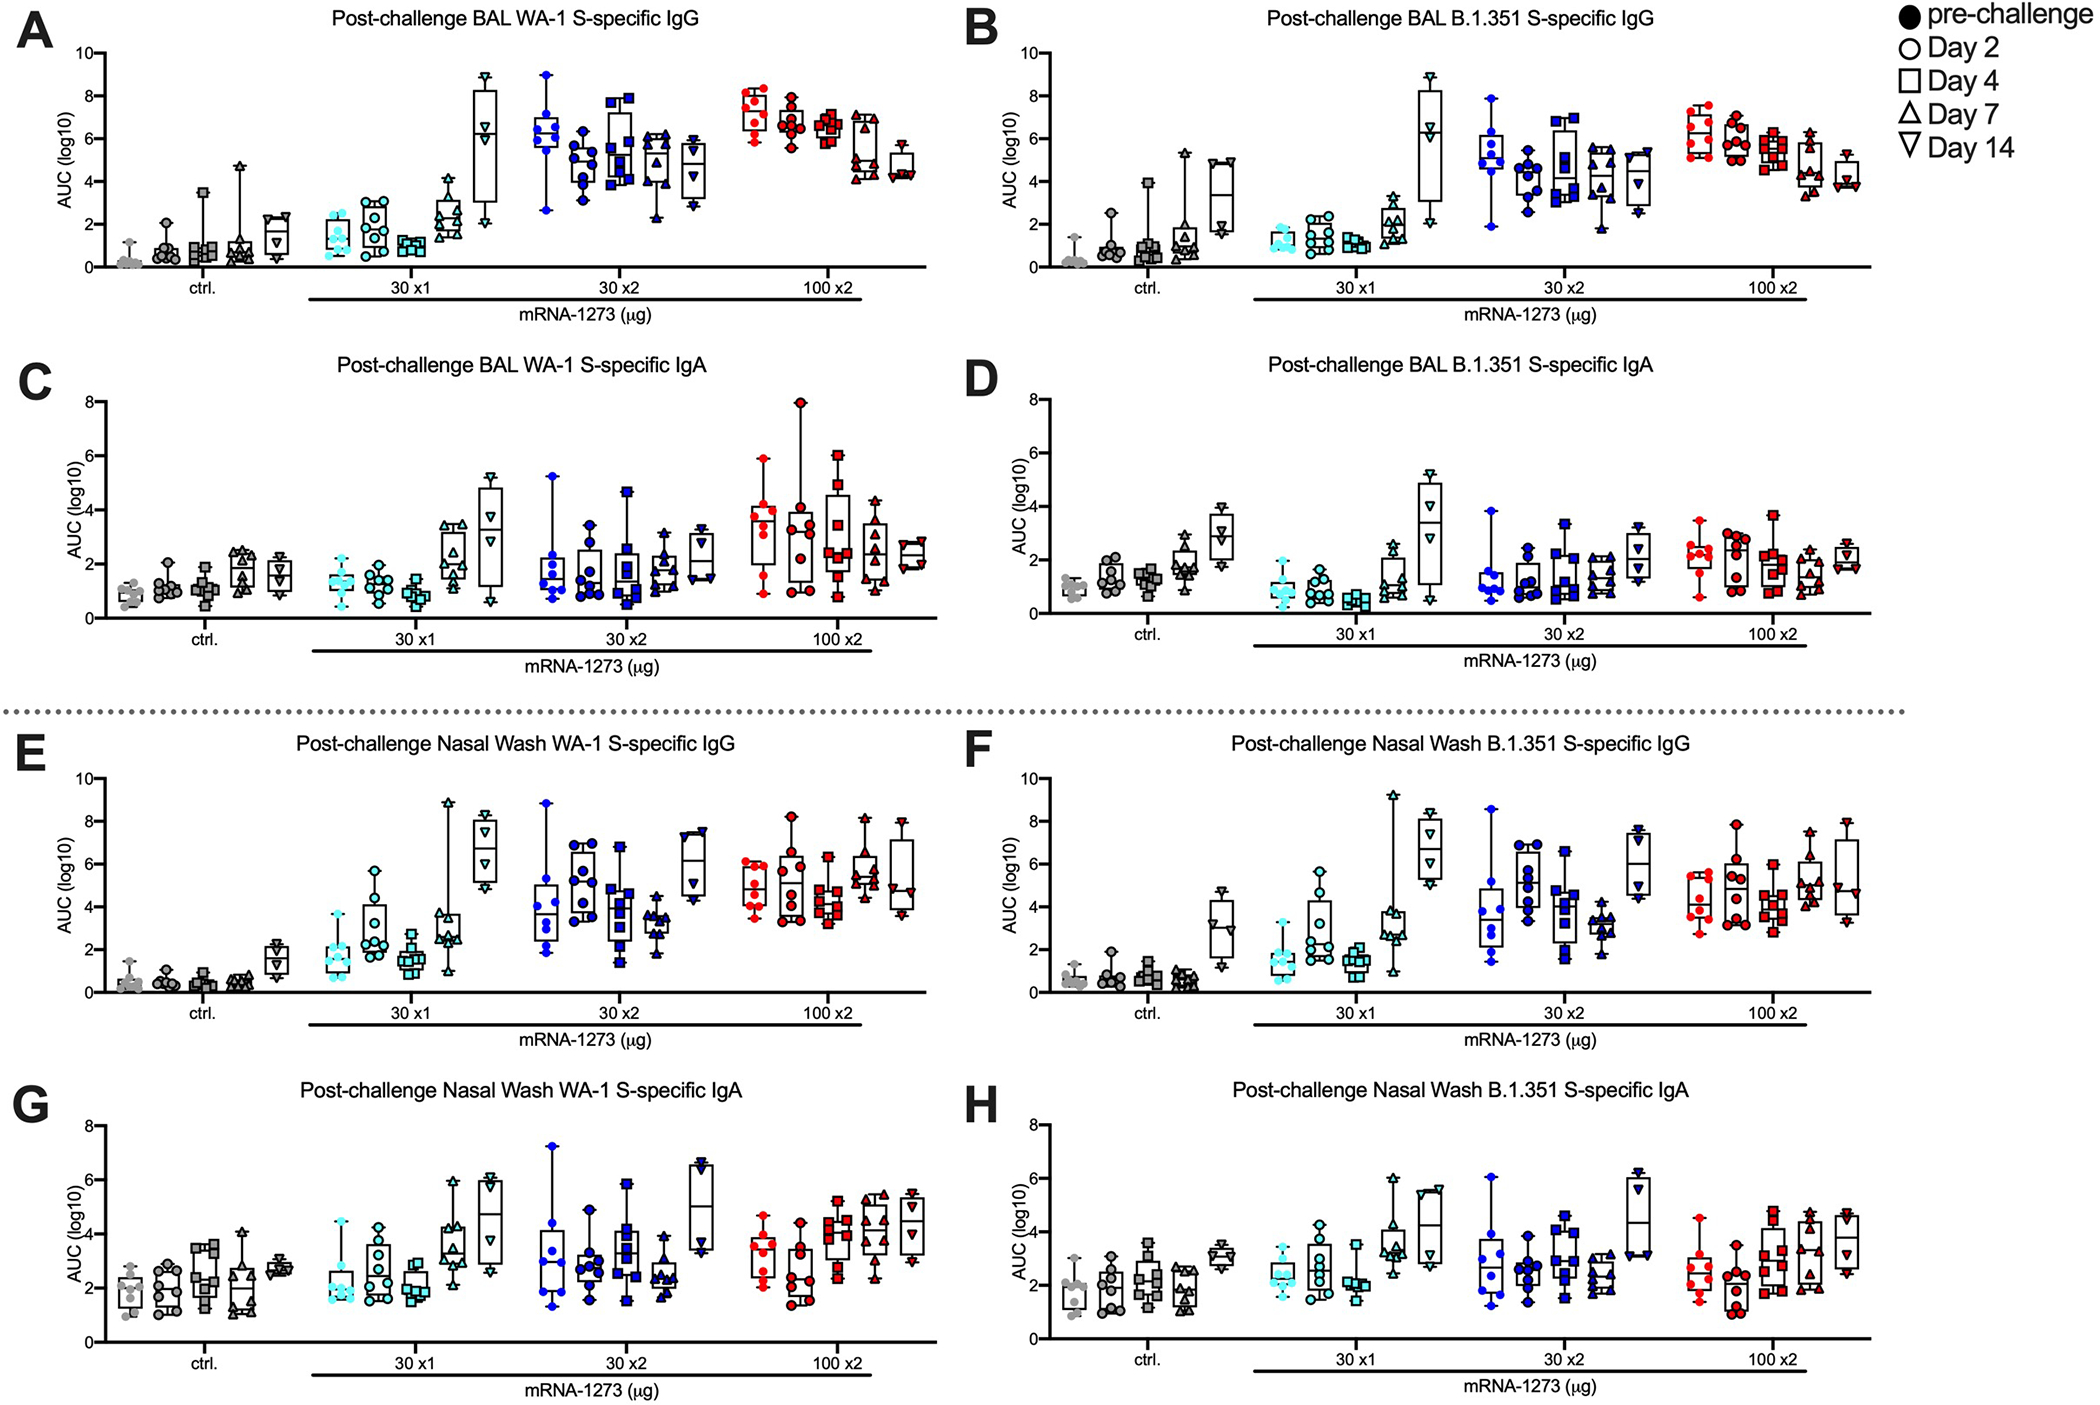
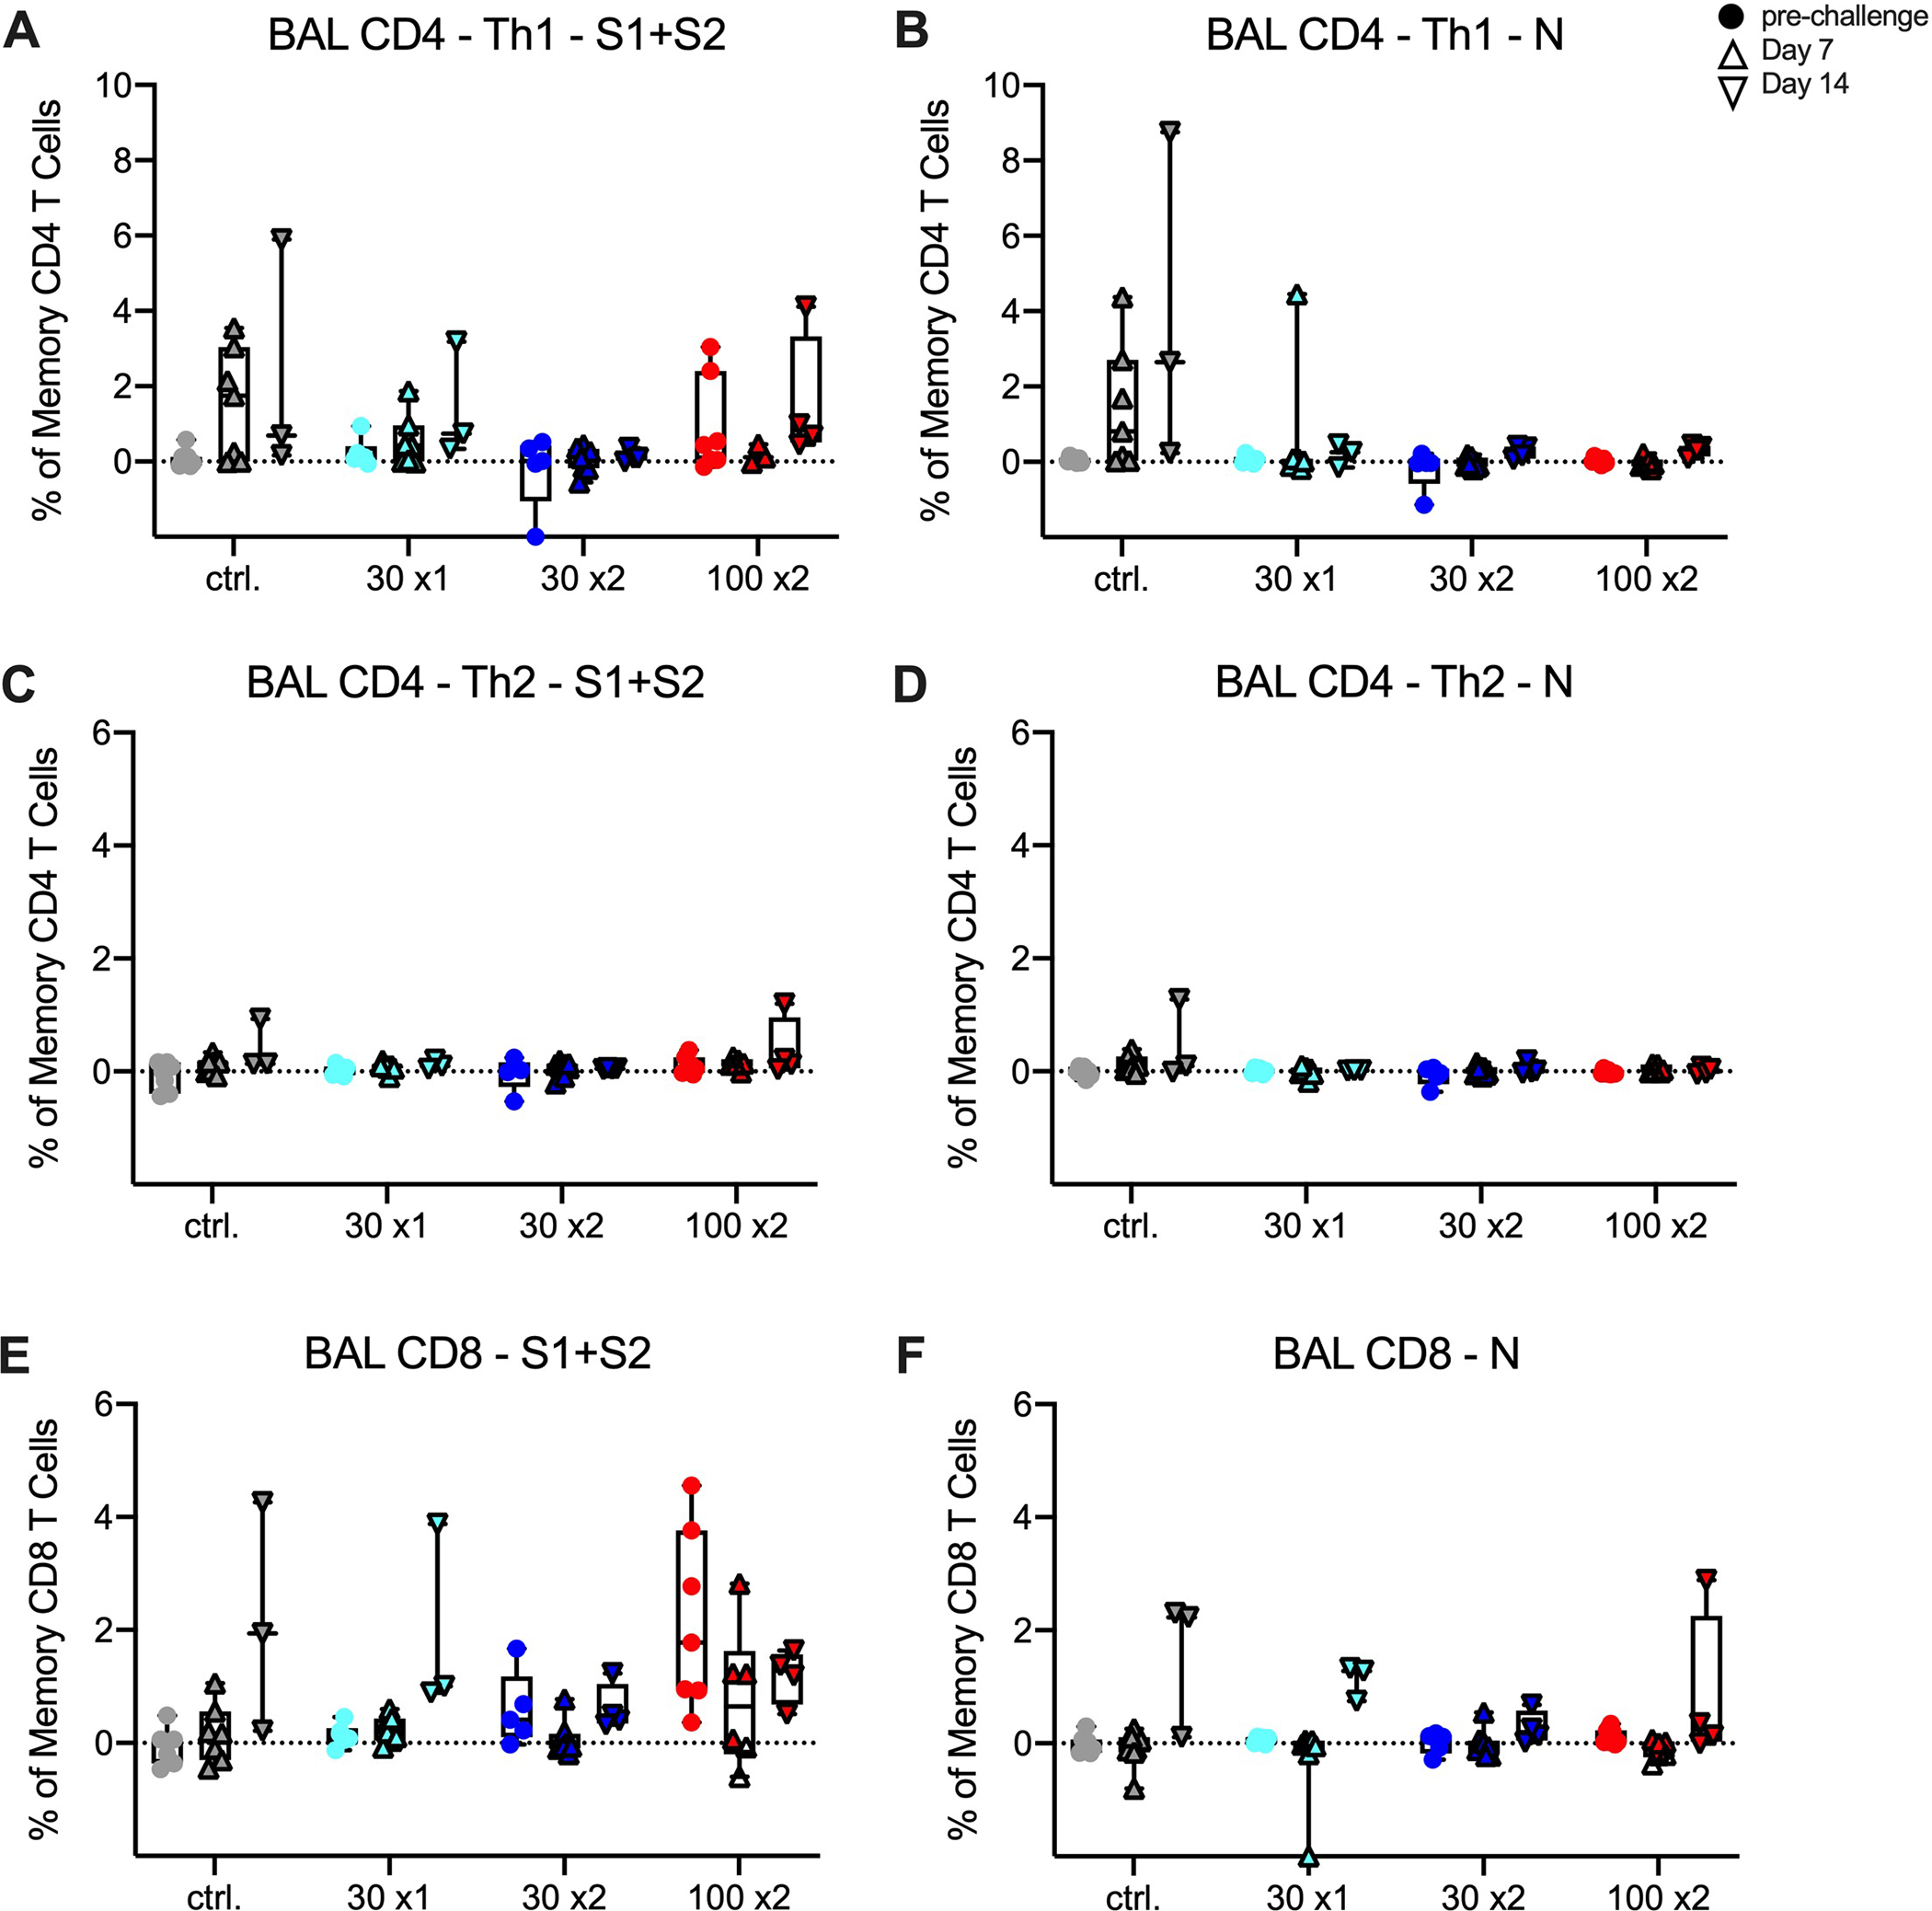
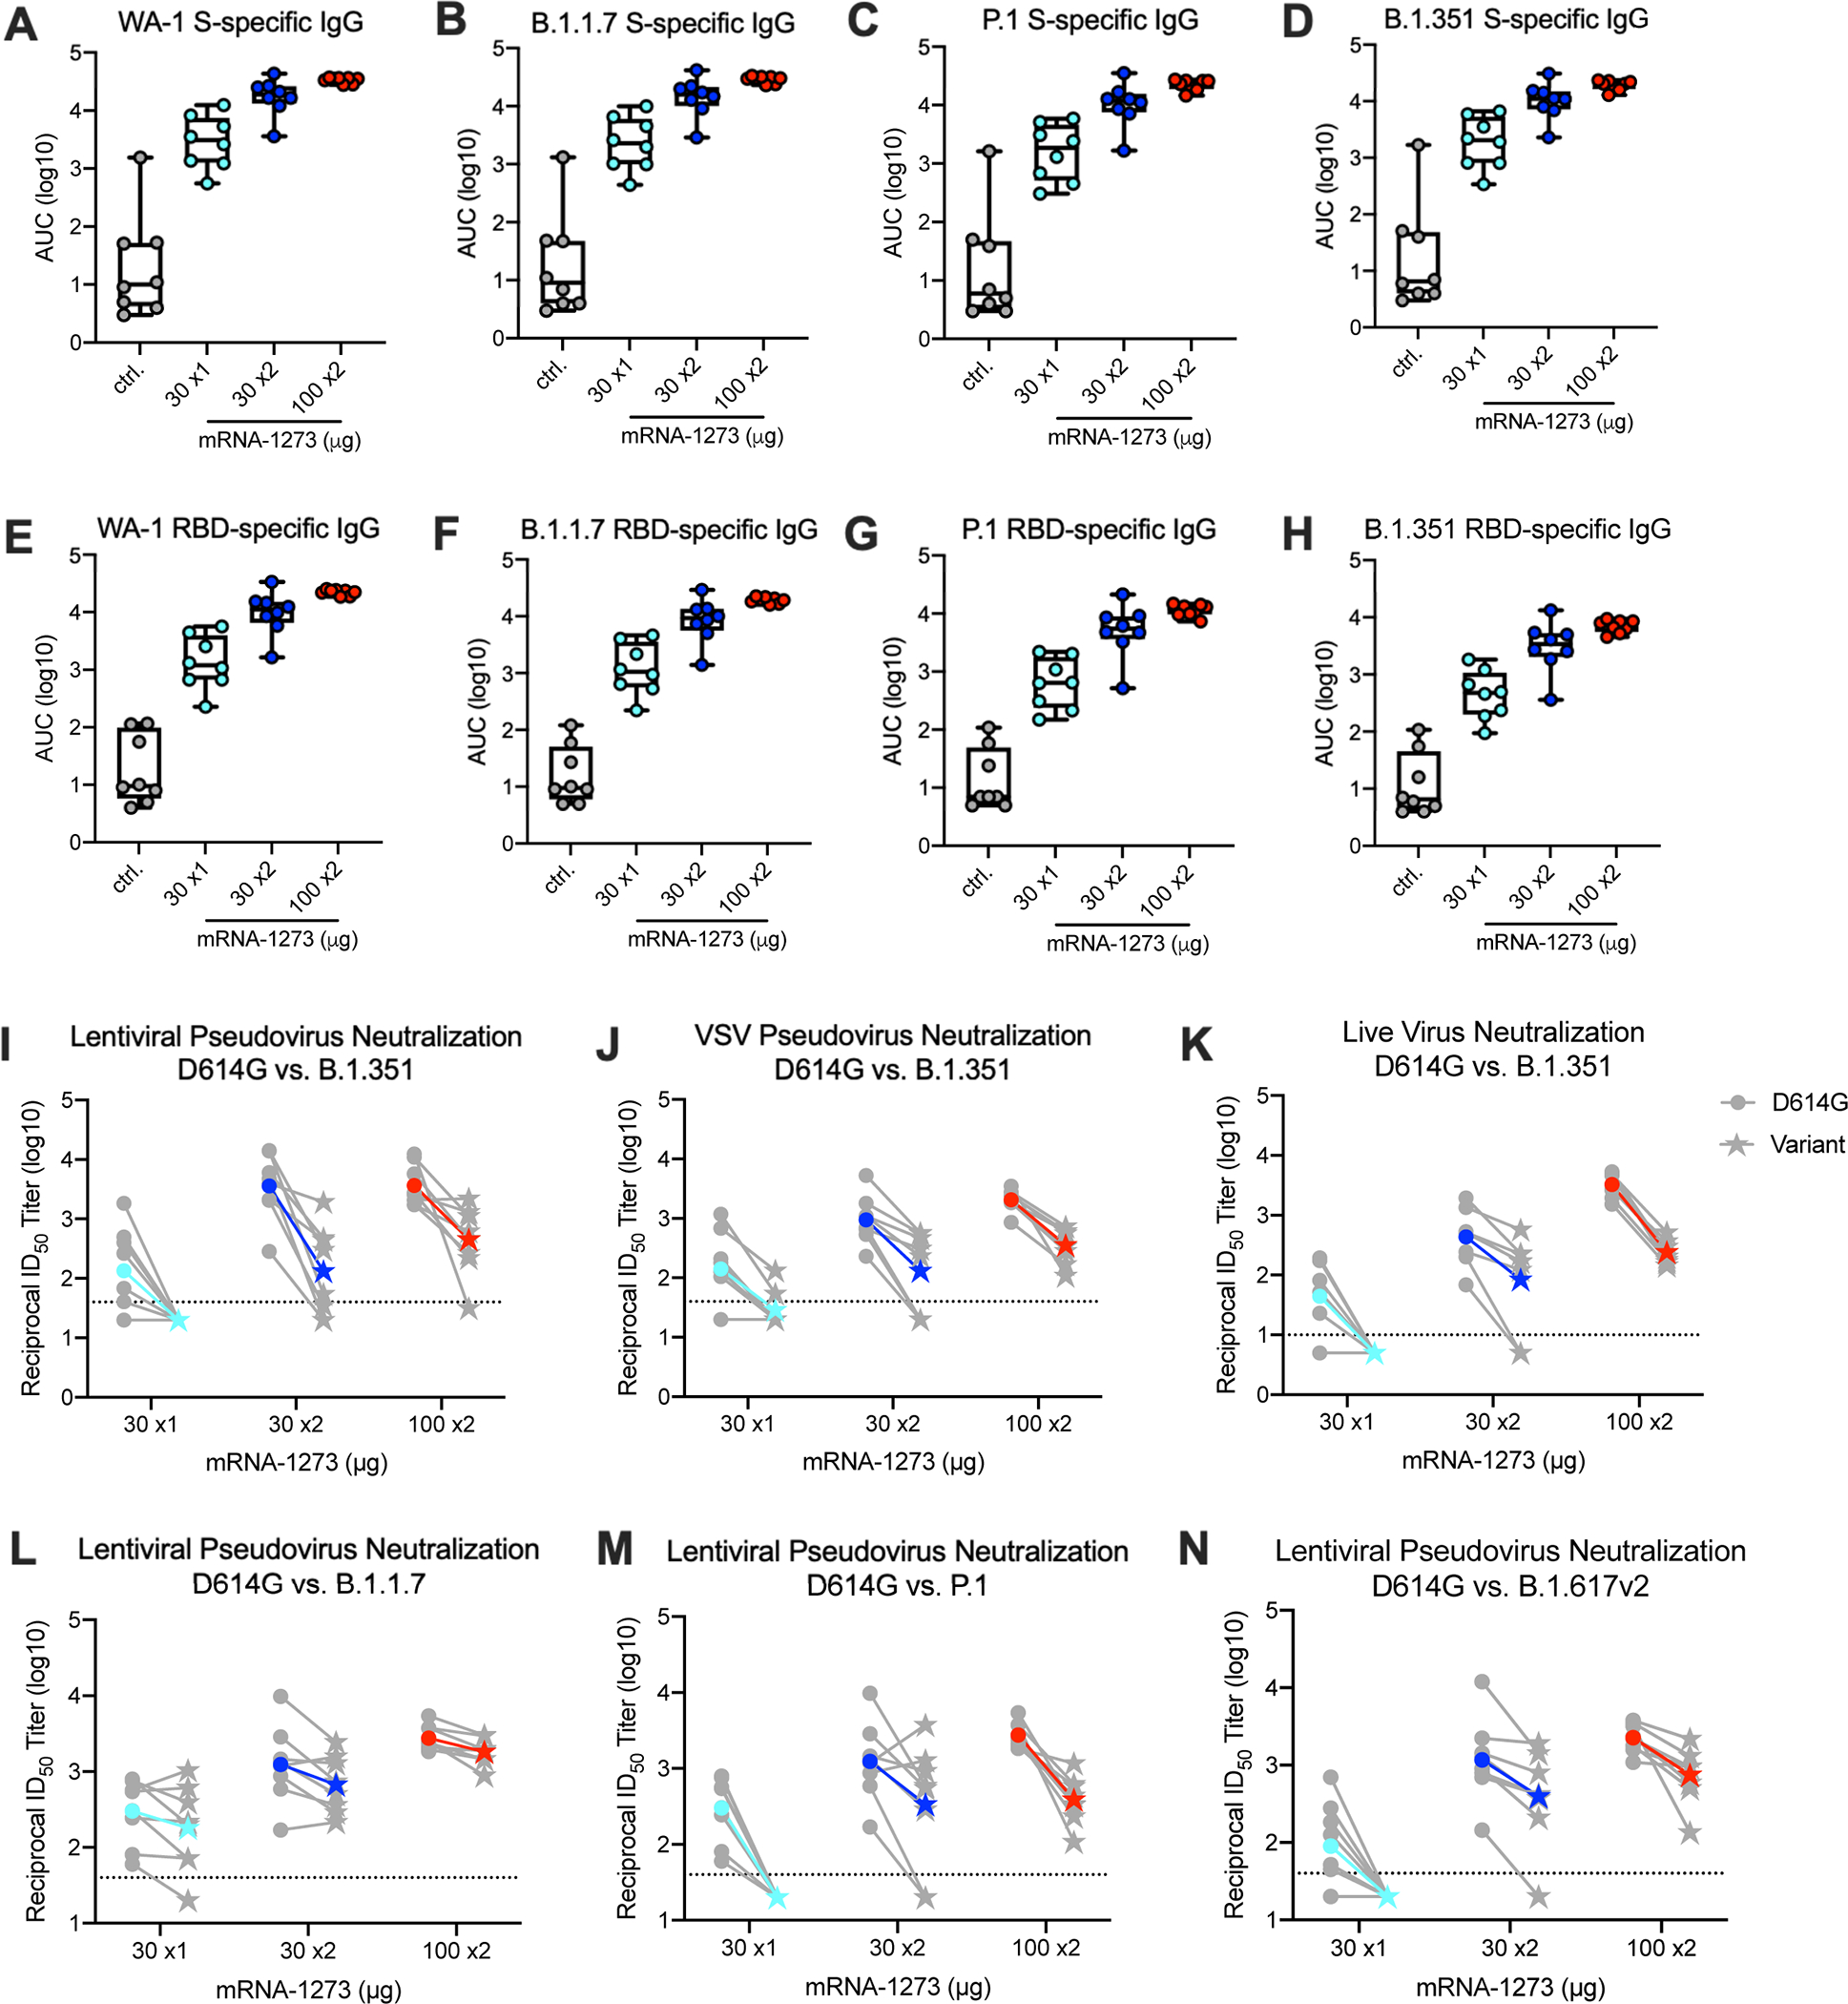
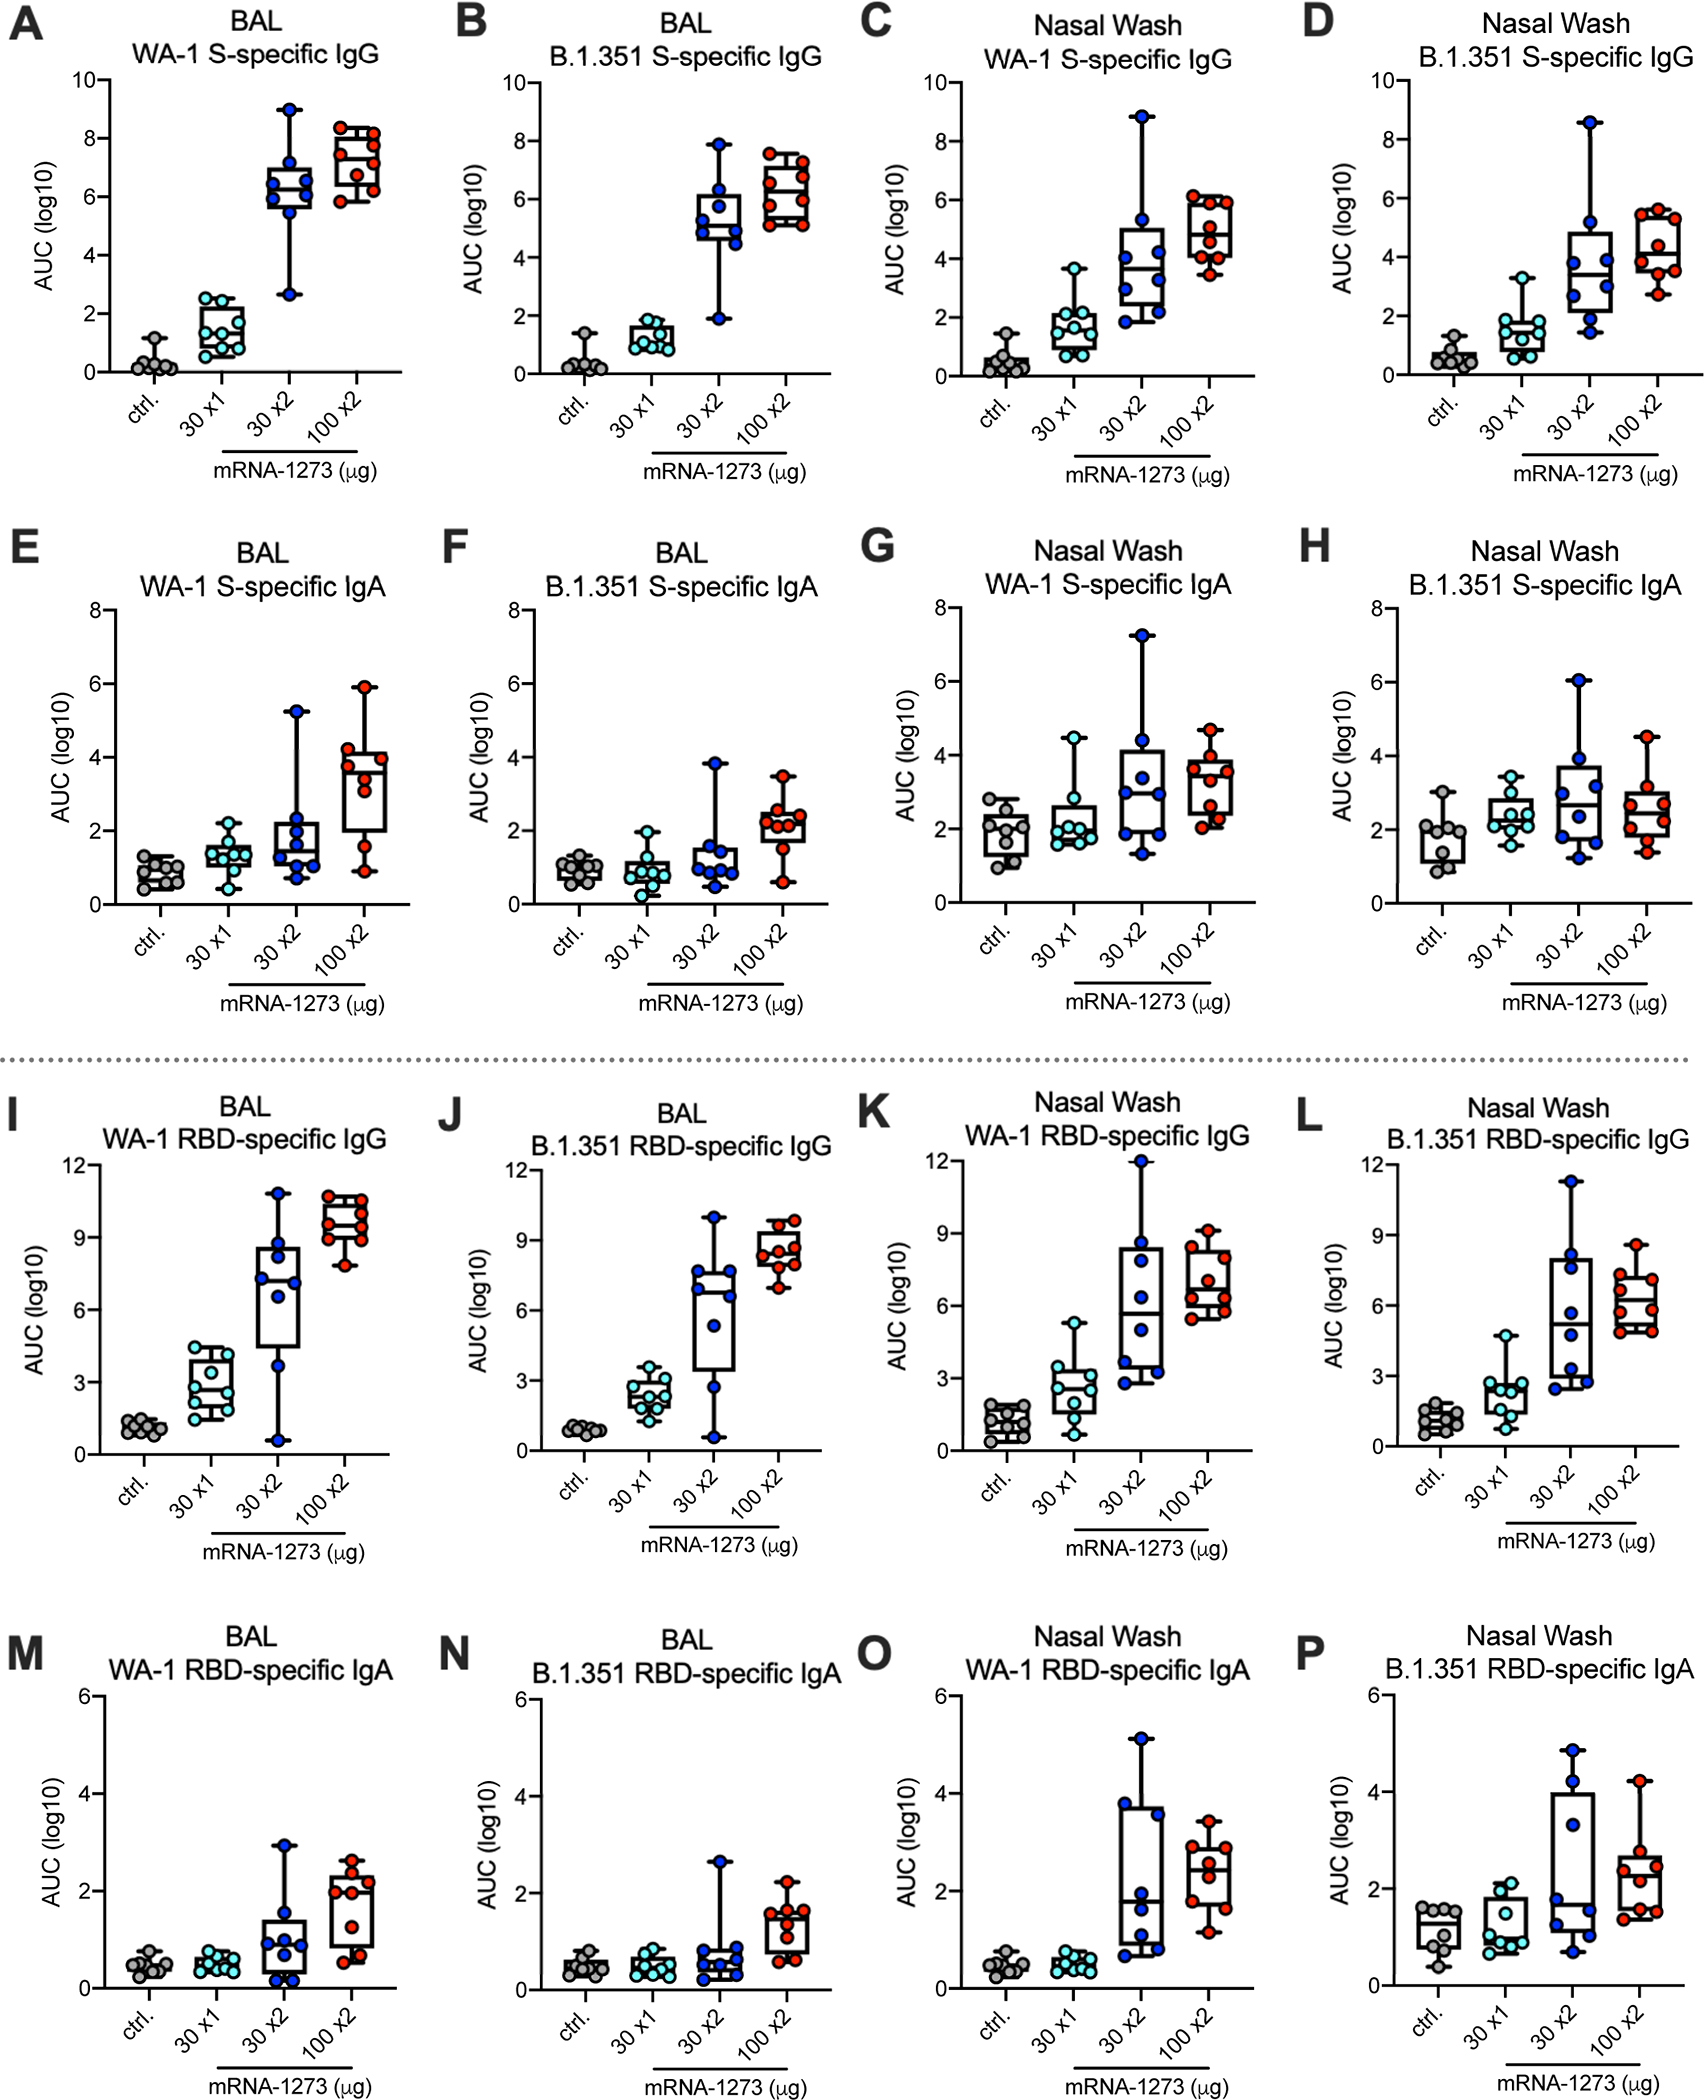
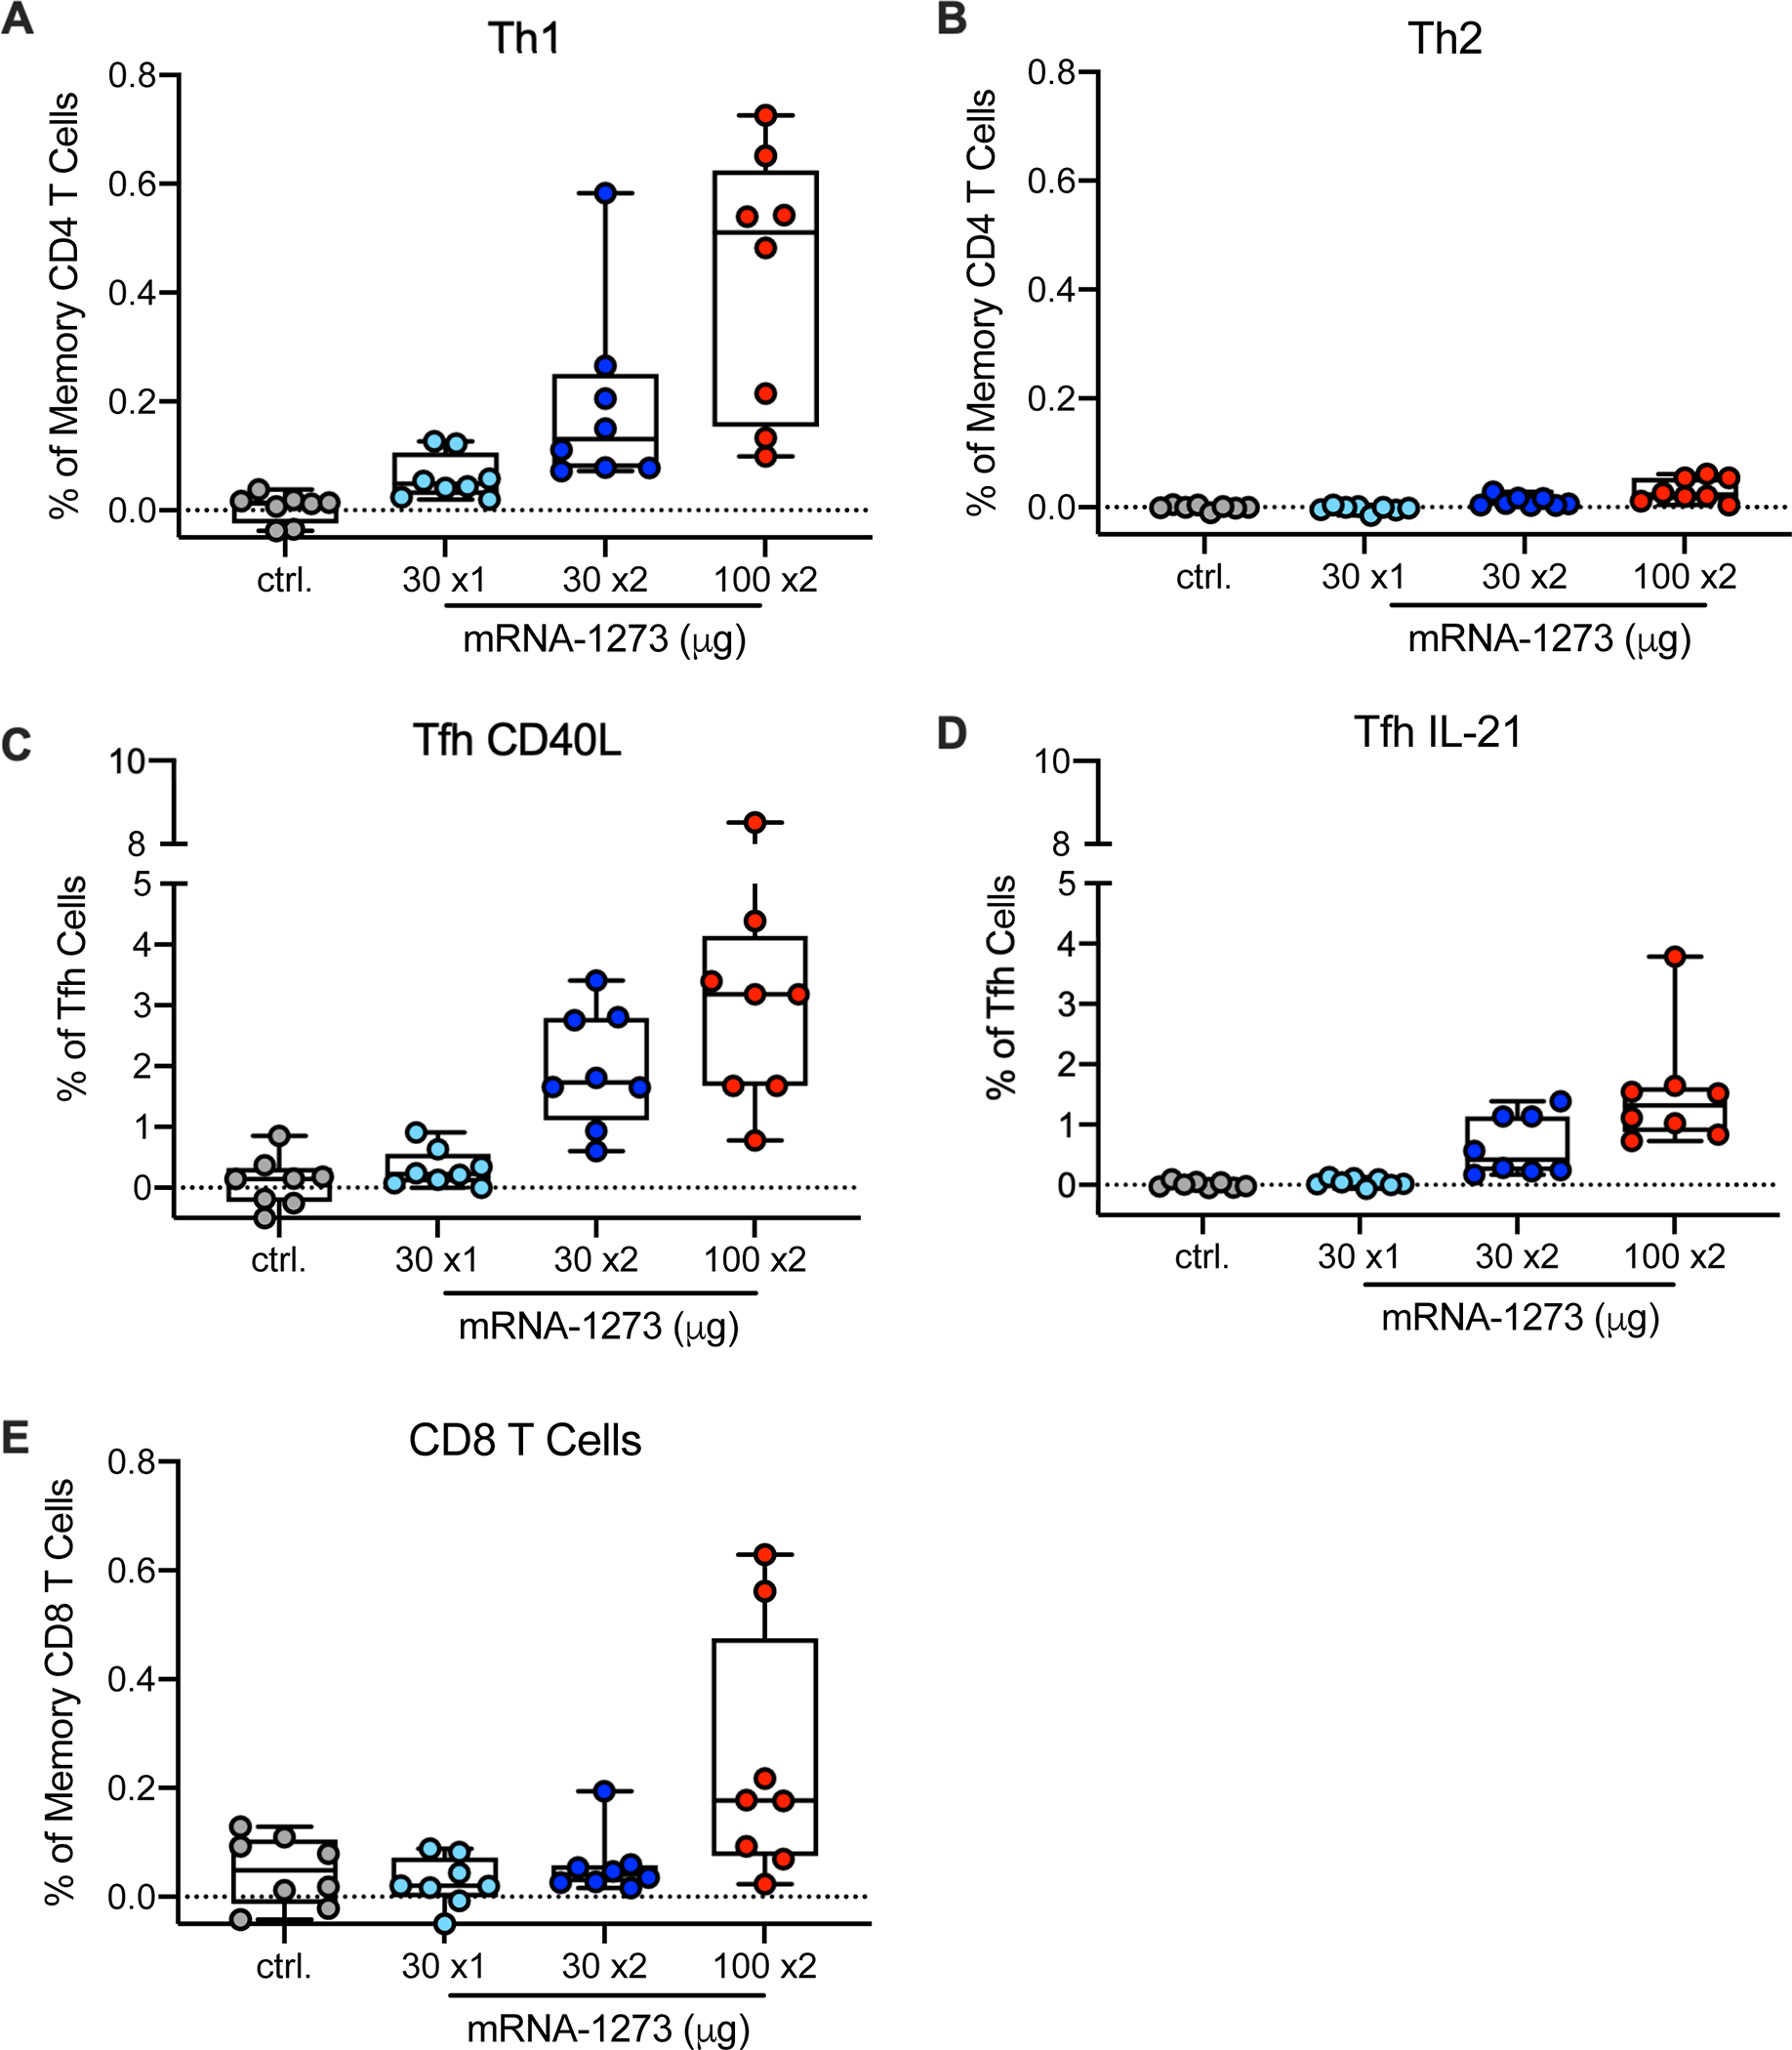
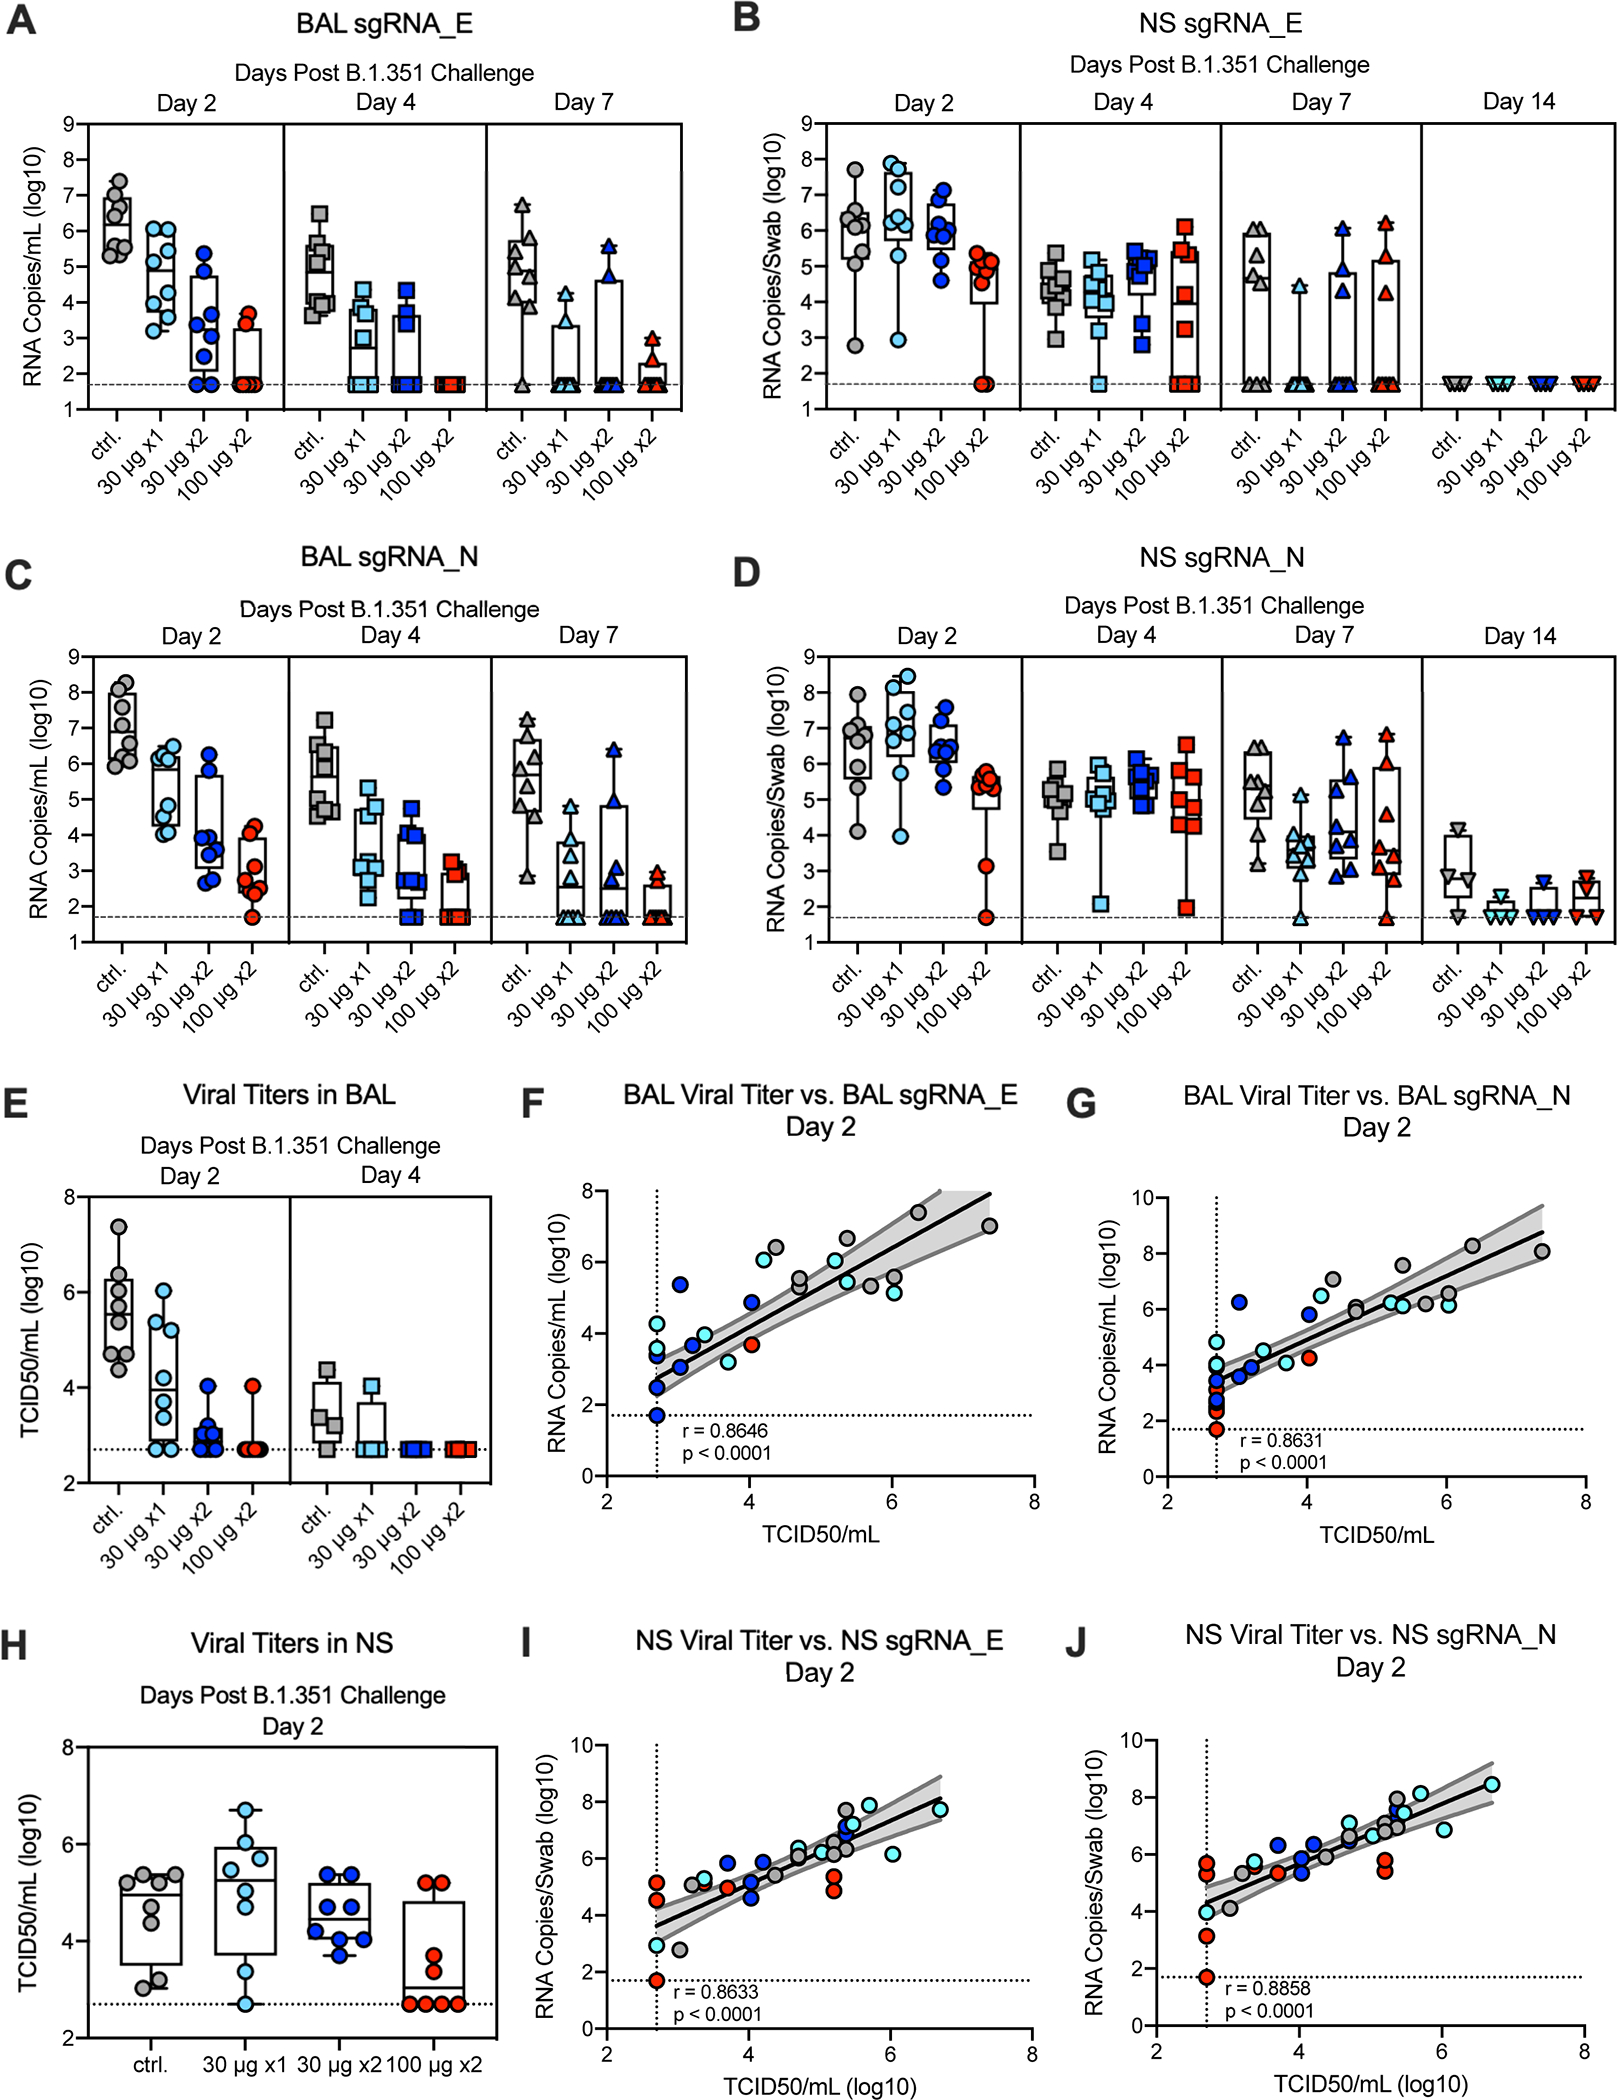
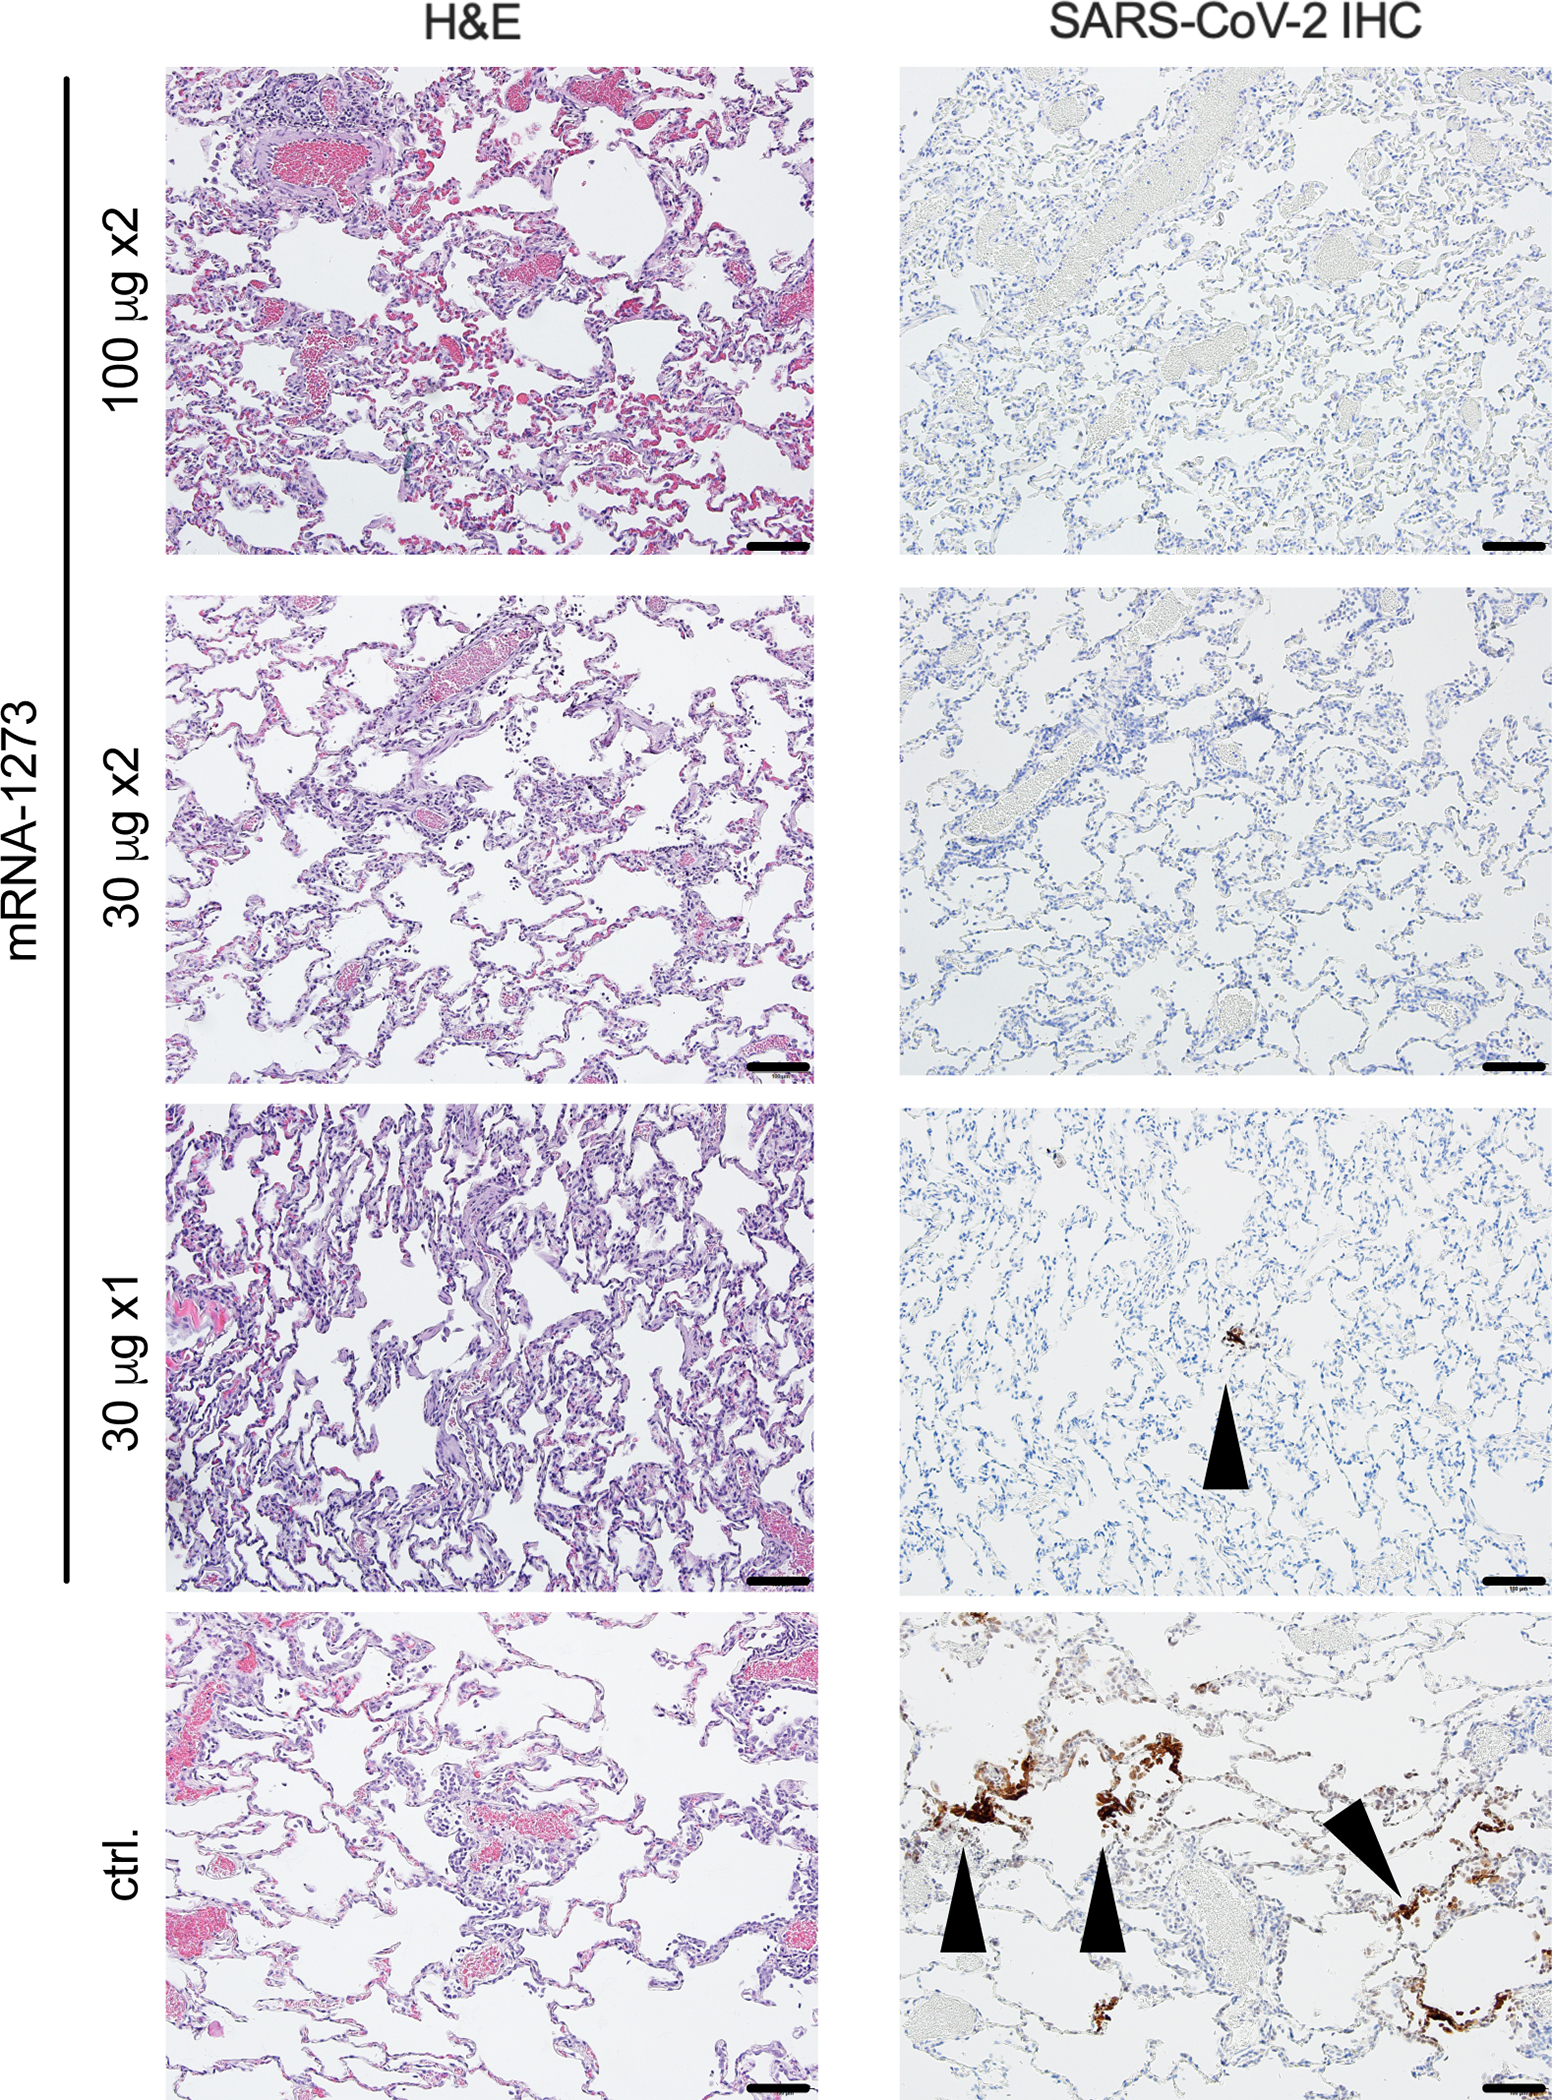
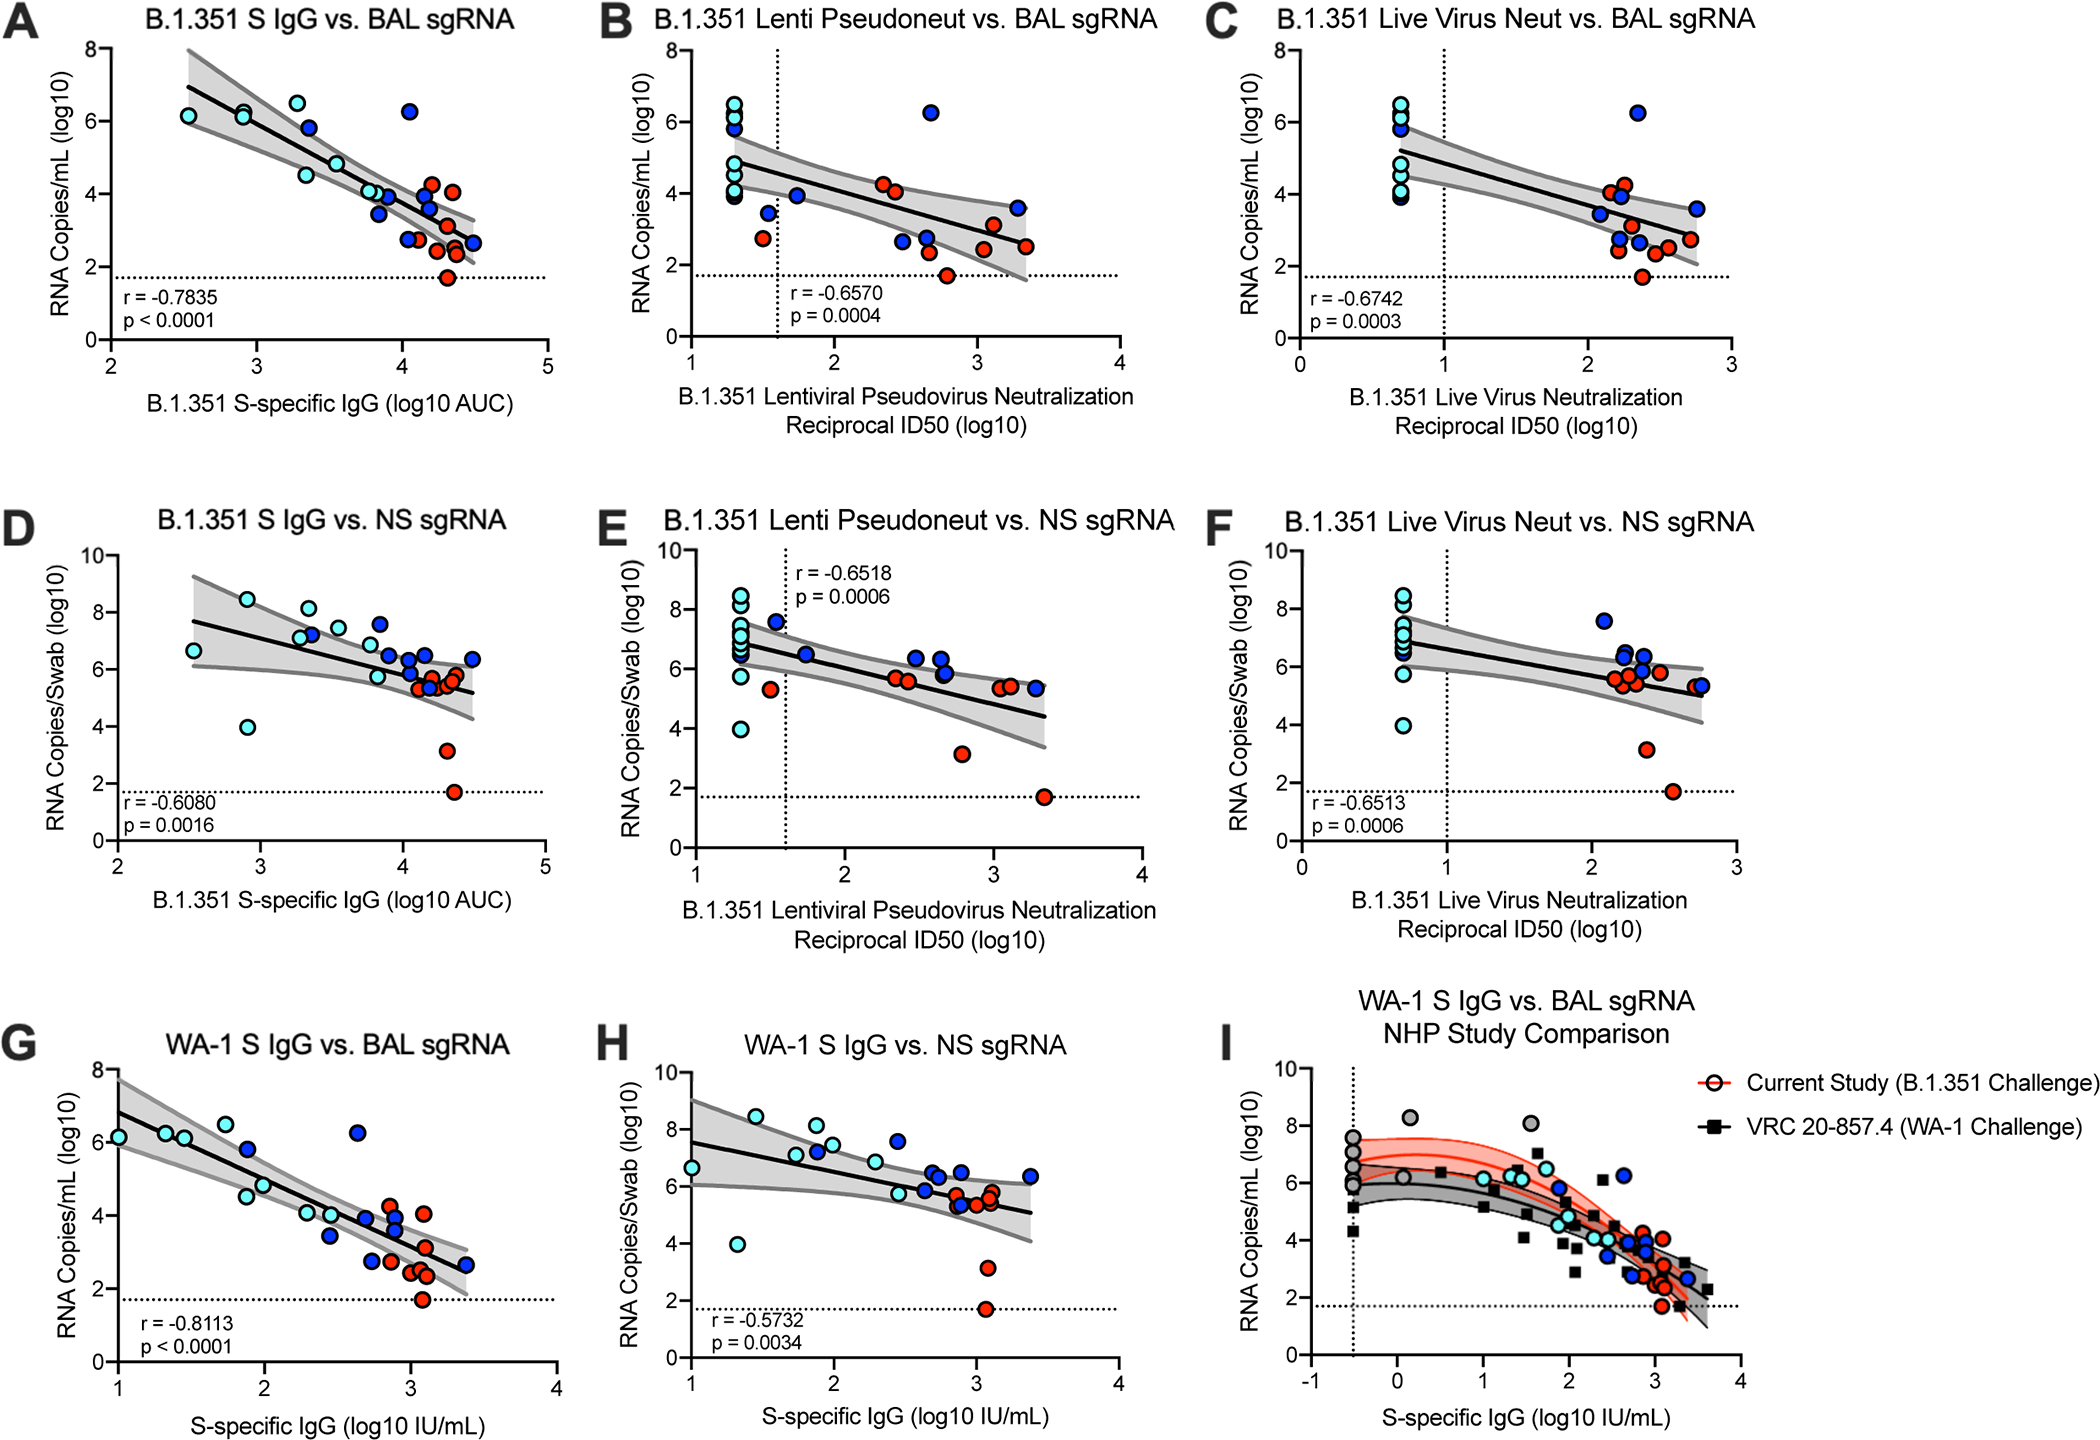
B.1.351 is the severe acute respiratory syndrome coronavirus 2 (SARS-CoV-2) variant most resistant to antibody neutralization. We demonstrate how the dose and number of immunizations influence protection. Nonhuman primates received two doses of 30 or 100 µg of Moderna's mRNA-1273 vaccine, a single immunization of 30 µg, or no vaccine. Two doses of 100 µg of mRNA-1273 induced 50% inhibitory reciprocal serum dilution neutralizing antibody titers against live SARS-CoV-2 p.Asp614Gly and B.1.351 of 3,300 and 240, respectively. Higher neutralizing responses against B.1.617.2 were also observed after two doses compared to a single dose. After challenge with B.1.351, there was ~4- to 5-log10 reduction of viral subgenomic RNA and low to undetectable replication in bronchoalveolar lavages in the two-dose vaccine groups, with a 1-log10 reduction in nasal swabs in the 100-µg group. These data establish that a two-dose regimen of mRNA-1273 will be critical for providing upper and lower airway protection against major variants of concern.


Conflict of interest statement

Competing Interest Declaration

K.S.C. and B.S.G. are inventors on U.S. Patent No. 10,960,070 B2 and International Patent Application No. WO/2018/081318 entitled “Prefusion Coronavirus Spike Proteins and Their Use.” K.S.C. and B.S.G. are inventors on US Patent Application No. 62/972,886 entitled “2019-nCoV Vaccine”. A.C., M.K., S.E., K.W., D.K.E. and A.C. are employees of Moderna. A.V.R., Z.F., B.C., M.P., J.W., B.B., A.C., A.D., L.P., K.S., H.A., S.K., and M.G.L. are employees of Bioqual. No other authors declare any competing interests.

Figures

Extended Data Fig. 1
Extended Data Fig. 1. Study design: Ability of mRNA-1273 to protect NHP against B.1.351 challenge.
Nonhuman primates (NHP), Rhesus macaques (n = 8/group), were immunized with mRNA-1273 on the following schedule: Group 1: 0 and 4 weeks, 100 μg; Group 2: 0 and 5 weeks, 30 μg; Group 3: week 0, 30 μg. Naïve aged-matched NHP were included as controls. At week 12, animals were challenged with a total of 5×10⁵ PFU of SARS-CoV-2 B.1.351. The viral inoculum was administered as 3.75×10⁵ PFU in 3 mL intratracheally (IT) and 1.25×10⁵ PFU in 1 mL intranasally (IN) in a volume of 0.5 mL into each nostril. Sera were collected at weeks 7 and week 12. Bronchoalveolar lavages (BAL) and nasal washes were also collected at week 7. Sera, BAL, and nasal washes were collected post-challenge on days 2, 4, 7, and 14, as indicated. Lung pathology was assessed on day 8 post-challenge in a subset of animals (n = 4/group)
Extended Data Fig. 2
Extended Data Fig. 2. Temporal neutralizing antibody responses following mRNA-1273 immunization.
Rhesus macaques were immunized according to Figure S1. Sera collected at weeks 0, 2, 7, and 12 were assessed for SARS-CoV-2 D614G (A), and B.1.351 (B) lentiviral-based pseudovirus neutralization. Data represents one independent experiment. Circles represent individual NHP and may overlap where values are equal; lines represent geometric mean titers (GMT). Dotted lines indicate neutralization assay limits of detection. Arrows point to immunization weeks.
Extended Data Fig. 3
Extended Data Fig. 3. Correlations of humoral antibody analyses.
Rhesus macaques were immunized according to Figure S1C. Plots show correlations between SARS-CoV-2 WA-1 S-specific IgG, B.1.351 S-specific IgG, WA-1 RBD-specific IgG, B.1.351 RBD-specific IgG, D614G lentiviral-based pseudovirus neutralization, B.1.351 lentiviral-based pseudovirus neutralization, D614G VSV-based pseudovirus neutralization, B.1.351 VSV-based pseudovirus neutralization, D614G focus reduction neutralization, and B.1.351 focus reduction neutralization at week 12. Data represents one independent experiment. Circles represent individual NHP, where colors indicate mRNA-1273 dose as defined in Figure S1. Dotted lines indicate assay limits of detection. Black and gray lines indicate linear regression and 95% confidence interval, respectively. ‘r’ and ‘p’ represent Spearman’s correlation coefficients and corresponding two-sided p-values, respectively.
Extended Data Fig. 4
Extended Data Fig. 4. Characterization of B.1.351 viral isolate.
A SARS-CoV-2 B.1.351 clinical isolate was first passaged (P1) at Johns Hopkins University (JHU) on Vero cells then passaged again (P2) on Vero/TMPRSS2 cells. P1 and P2 underwent shotgun deep sequencing. (A) Alignment of S protein consensus sequence, where pink and gray indicate variant amino acid position and missing sequence data, respectively. (B) Syrian hamsters (n = 10/group) were infected with 1×10³ (gray), 1×10⁴ (black), or 1×10⁵ (red) dilution of JHU B.1.351 P2 and monitored for weight loss for 15 days post-infection. Circles and error bars represent means and SEM, respectively. (C-D) Rhesus macaques (n = 3/group) were infected with 2.4×10⁵ (black) or 2.4×10⁶ (red) PFU of JHU B.1.351 P2 and viral replication was assessed by detection of SARS-CoV-2 E-specific sgRNA in BAL (C) and NS (D) on days 2, 4, and 6 post-infection. Data represents one independent experiment. Boxes and horizontal bars denote the interquartile ranges (IQR) and medians, respectively; whisker end points are equal to the maximum and minimum values. Dotted lines indicate assay limits of detection.
Extended Data Fig. 5
Extended Data Fig. 5. Mucosal antibody responses following SARS-CoV-2 challenge in mRNA-1273-immunized NHP.
Rhesus macaques were immunized and challenged according to Figure S1. BAL (A-D) and nasal washes (E-H) collected at week 7 (filled circles) and days 2 (circles), 4 (squares), 7 (triangles), and 14 (inverted triangles) post-challenge were assessed for SARS-CoV-2 WA-1 (A, C, E, G) and B.1.351 (B, D, F, H) S-specific IgG (A-B, E-F) and IgA (C-D, G-H) by MULTI-ARRAY ELISA. Data represents one independent experiment. Boxes and horizontal bars denote the IQR and medians, respectively; whisker end points are equal to the maximum and minimum values. Symbols represent individual NHP.
Extended Data Fig. 6
Extended Data Fig. 6. T cell responses following SARS-CoV-2 challenge in mRNA-1273-immunized
Rhesus macaques were immunized according to Extended Data Fig. 1. Intracellular cytokine staining was performed on BAL cells at week 27 (filled circles) and days 7 (triangles) and 14 (inverted triangles) post-challenge to assess T cell responses to SARS-CoV-2 S protein peptide pools, S1 and S2 (A, C, E) and N (B, D, F). Responses to S1 and S2 individual peptide pools were summed. Cytokine frequencies were measured from memory T cells as defined by CD45RA and CCR7. (A-B) Th1 responses (IFNg, IL-2, or TNF), (C-D) Th2 responses (IL-4 or IL-13), (E-F) CD8 T cell responses (IFNg, IL-2, or TNF). Data represents one independent experiment. Boxes and horizontal bars denote IQR and medians, respectively; whisker end points are equal to the maximum and minimum values. Circles represent individual NHP. Dotted lines are set to 0%.
Extended Data Fig. 7
Extended Data Fig. 7. Flow cytometry gating tree
T cell populations were selected by subsequent gating: first single cells, followed by live/SSC low cells, then CD3+/FSC low cells, and finally CD4+ and CD8+ T cells. To measure IL-21 production and CD40L expression from Tfh, CD4 T cells were gated first on central memory (CM) T cells (CCR7+CD45RA−) then CXCR5+ CM cells followed by PD-1+ICOS+ cells to identify Tfh. Subsequently, from Tfh, CD69+IL-21+ and CD69+CD154+ cells were gated. Cytokine production from total memory (TotM) CD4 and CD8 T cells was measured by first gating on total memory cells (central memory CCR7+CD45RA− plus effector memory CCR7−CD45RA− plus terminal effector memory CCR7-CD45RA+ T cells) while excluding naïve CCR7+CD45RA+ T cells, then CD69+cytokine+ gates were drawn on total memory T cells.
Fig. 1.
Fig. 1.. Serum antibody responses following mRNA-1273 immunization.
Twenty-four rhesus macaques were immunized with mRNA-1273 (30 μg, one dose – light blue; 30 μg, two doses – dark blue; or 100 μg, two doses – red), according to Extended Data Fig. 1. Eight aged-matched naïve NHP (gray) were used as controls. Sera collected at week 12, immediately before challenge, were assessed for SARS-CoV-2 USA/Washington1 (WA-1) (A, E), B.1.1.7 (B, F), P.1 (C, G), and B.1.351 (D, H) S- (A-D) and RBD-specific (E-D) IgG by MULTI-ARRAY ELISA. Lentiviral-based pseudovirus neutralization (I, L-N) was conducted on SARS-CoV-2 D614G and B.1.351 (I), B.1.1.7 (L), P.1 (M), and B.1.617.2 (N). D614G and B.1.351 VSV-based pseudovirus neutralization (J) and focus reduction live-virus neutralization (K) were also assessed. Data represents one independent experiment. (A-H) Circles represent individual NHP. Boxes and horizontal bars denote the IQR and medians, respectively; whisker end points are equal to the maximum and minimum values. (I-N) Gray lines represent individual NHP, and colored lines represent geometric mean titers (GMT). Dotted lines indicate neutralization assay limits of detection. Symbols represent individual NHP and may overlap for equal values. Data represents one independent experiment.
Fig. 2.
Fig. 2.. Mucosal antibody responses following mRNA-1273 immunization.
Twenty-four rhesus macaques were immunized according to Extended Data Fig. 1, and compared to eight age-matched controls. BAL (A-B, E-F, I-J, M-N) and nasal washes (C-D, G-H, K-L, O-P) collected at week 7 were assessed for SARS-CoV-2 WA-1 (A, C, E, G, I, K, M, O) and B.1.351 (B, D, F, H, J, L, N, P) S- (A-H) and RBD-specific (I-P) IgG (A-D, I-L) and IgA (E-H, M-P) by MULTI-ARRAY ELISA. Data represents one independent experiment. Circles represent individual NHP. Boxes and horizontal bars denote the IQR and medians, respectively; whisker end points are equal to the maximum and minimum values.
Fig. 3.
Fig. 3.. T cell responses following mRNA-1273 immunization.
Twenty-four rhesus macaques were immunized according to Extended Data Fig. 1, and compared to eight age-matched controls. Intracellular staining was performed on PBMCs at week 7 to assess T cell responses to SARS-CoV-2 S protein peptide pools, S1 and S2. Responses to S1 and S2 individual peptide pools were summed. (A) Th1 responses (IFNg, IL-2, or TNF), (B) Th2 responses (IL-4 or IL-13), (C) Tfh CD40L upregulation (peripheral follicular helper T cells (Tfh) were gated on central memory CXCR5+PD-1+ICOS+ CD4 T cells), (D) Tfh IL-21, (E) CD8 T cells. Data represents one independent experiment. Boxes and horizontal bars denote IQR and medians, respectively; whisker end points are equal to the maximum and minimum values. Circles represent individual NHP. Dotted lines are set to 0%.
Fig. 4.
Fig. 4.. Efficacy of mRNA-1273 against upper and lower respiratory B.1.351 viral replication.
Twenty-four rhesus macaques were immunized and challenged as described in Extended Data Fig. 1, and compared to eight age-matched controls. BAL (A, C) and nasal swabs (NS) (B, D) were collected on days 2 (circles), 4 (squares), and 7 (triangles), and 14 (inverted triangles) post-challenge, where applicable, and viral replication was assessed by detection of SARS-CoV-2 E- (A-B) and N-specific (C-D) sgRNA. Viral titers were assessed by TCID50 assay for BAL collected on days 2 and 4 post-challenge (E) and for NS on day 2 (H). Boxes and horizontal bars denote the IQR and medians, respectively; whisker end points are equal to the maximum and minimum values. (F-G, I-J) Plots show correlations between viral titers and sgRNA_E (F, I) and sgRNA_N (G, J) in BAL (F-G) and NS (I-J) 2 days post-challenge. Data represents one independent experiment. Black and gray lines indicate linear regression and 95% confidence interval, respectively. ‘r’ and ‘p’ represent Spearman’s correlation coefficients and corresponding two-sided p-values, respectively; all p-values were <0.0001. Symbols represent individual NHP and may overlap for equal values.
Fig. 5.
Fig. 5.. Post-challenge lung histopathological analysis and viral detection.
Rhesus macaques were immunized and challenged as described in Figure S1. Eight days post-challenge, lung samples (n = 4/group) were evaluated for the presence of inflammation by hematoxylin and eosin (H & E) staining (left) and evidence of virus infection by immunohistochemistry (IHC) for SARS-CoV-2 viral antigen (right). Representative images show the location and distribution of SARS-CoV-2 viral antigen in serial lung tissue sections. Arrows indicate areas positive for viral antigen. Each image is taken at 10x magnification; scale bars represent 100 microns.
Fig. 6.
Fig. 6.. Antibody correlates of protection.
Twenty-four rhesus macaques were immunized and challenged as described in Extended Data Fig. 1, and compared to eight age-matched controls. (A-F) Plots show correlations and the corresponding two-sided p-values between week 12 SARS-CoV-2 B.1.351 S-specific IgG (A, D), lentiviral-based pseudovirus neutralization (B, E), and focus reduction live-virus neutralization (C, F) with N-specific sgRNA in BAL (A-C) and NS (D-F) at day 2 post-challenge. (G-H) Plots show correlations and the corresponding two-sided p-values between week 12 SARS-CoV-2 WA-1 S-specific IgG, converted to IU/mL, with N-specific sgRNA in BAL (G) and NS (H) at day 2 post-challenge. Circles represent individual NHP, where colors indicate mRNA-1273 dose. Dotted lines indicate assay limits of detection. (I) The relationship between pre-challenge WA-1 S-specific IgG and day 2 BAL sgRNA_N, with data from the current study using a B.1.351 challenge (filled circles, red curve fit) superimposed on data from our previous study with a WA-1 challenge (black squares, black curve fit); lines indicate quadratic curve fit and 95% confidence intervals. Data represents one independent experiment. Symbols represent individual NHP and may overlap for equal values.

Comment in

  • Beta testing the monkey model.
    Moore JP, Gounder CR. Moore JP, et al. Nat Immunol. 2021 Oct;22(10):1201-1203. doi: 10.1038/s41590-021-01033-w. Nat Immunol. 2021. PMID: 34531563 No abstract available.

References

    1. Supasa P et al.Reduced neutralization of SARS-CoV-2 B.1.1.7 variant by convalescent and vaccine sera. Cell 184, 2201–2211.e2207 (2021). - PMC - PubMed
    1. Chen RE et al.Resistance of SARS-CoV-2 variants to neutralization by monoclonal and serum-derived polyclonal antibodies. Nat Med 27, 717–726 (2021). - PMC - PubMed
    1. Edara VV et al.Infection- and vaccine-induced antibody binding and neutralization of the B.1.351 SARS-CoV-2 variant. Cell Host & Microbe 29, 516–521.e513 (2021). - PMC - PubMed
    1. Li Q et al.The Impact of Mutations in SARS-CoV-2 Spike on Viral Infectivity and Antigenicity. Cell 182, 1284–1294 e1289 (2020). - PMC - PubMed
    1. Tegally H et al.Detection of a SARS-CoV-2 variant of concern in South Africa. Nature, doi:10.1038/s41586-021-03402-9 (2021). - DOI - PubMed

References (Methods)

    1. Pallesen J et al.Immunogenicity and structures of a rationally designed prefusion MERS-CoV spike antigen. Proceedings of the National Academy of Sciences 114, E7348–E7357 (2017). - PMC - PubMed
    1. Wrapp D et al.Cryo-EM structure of the 2019-nCoV spike in the prefusion conformation. Science 367, 1260–1263 (2020). - PMC - PubMed
    1. Hassett KJ et al.Optimization of Lipid Nanoparticles for Intramuscular Administration of mRNA Vaccines. Molecular Therapy - Nucleic Acids 15, 1–11 (2019). - PMC - PubMed
    1. Jackson LA et al.An mRNA Vaccine against SARS-CoV-2 - Preliminary Report. N Engl J Med 383, 1920–1931 (2020). - PMC - PubMed
    1. Whitt MA Generation of VSV pseudotypes using recombinant ΔG-VSV for studies on virus entry, identification of entry inhibitors, and immune responses to vaccines. J Virol Methods 169, 365–374 (2010). - PMC - PubMed

Publication types

MeSH terms