. 2021 Aug;3(8):1058-1070.
doi: 10.1038/s42255-021-00438-z. Epub 2021 Aug 20.

Exercise hormone irisin is a critical regulator of cognitive function

Affiliations

Exercise hormone irisin is a critical regulator of cognitive function

Mohammad R Islam et al. Nat Metab. 2021 Aug.

Erratum in

  • Author Correction: Exercise hormone irisin is a critical regulator of cognitive function.
    Islam MR, Valaris S, Young MF, Haley EB, Luo R, Bond SF, Mazuera S, Kitchen RR, Caldarone BJ, Bettio LEB, Christie BR, Schmider AB, Soberman RJ, Besnard A, Jedrychowski MP, Kim H, Tu H, Kim E, Choi SH, Tanzi RE, Spiegelman BM, Wrann CD. Islam MR, et al. Nat Metab. 2021 Oct;3(10):1432. doi: 10.1038/s42255-021-00476-7. Nat Metab. 2021. PMID: 34621079 No abstract available.

Abstract

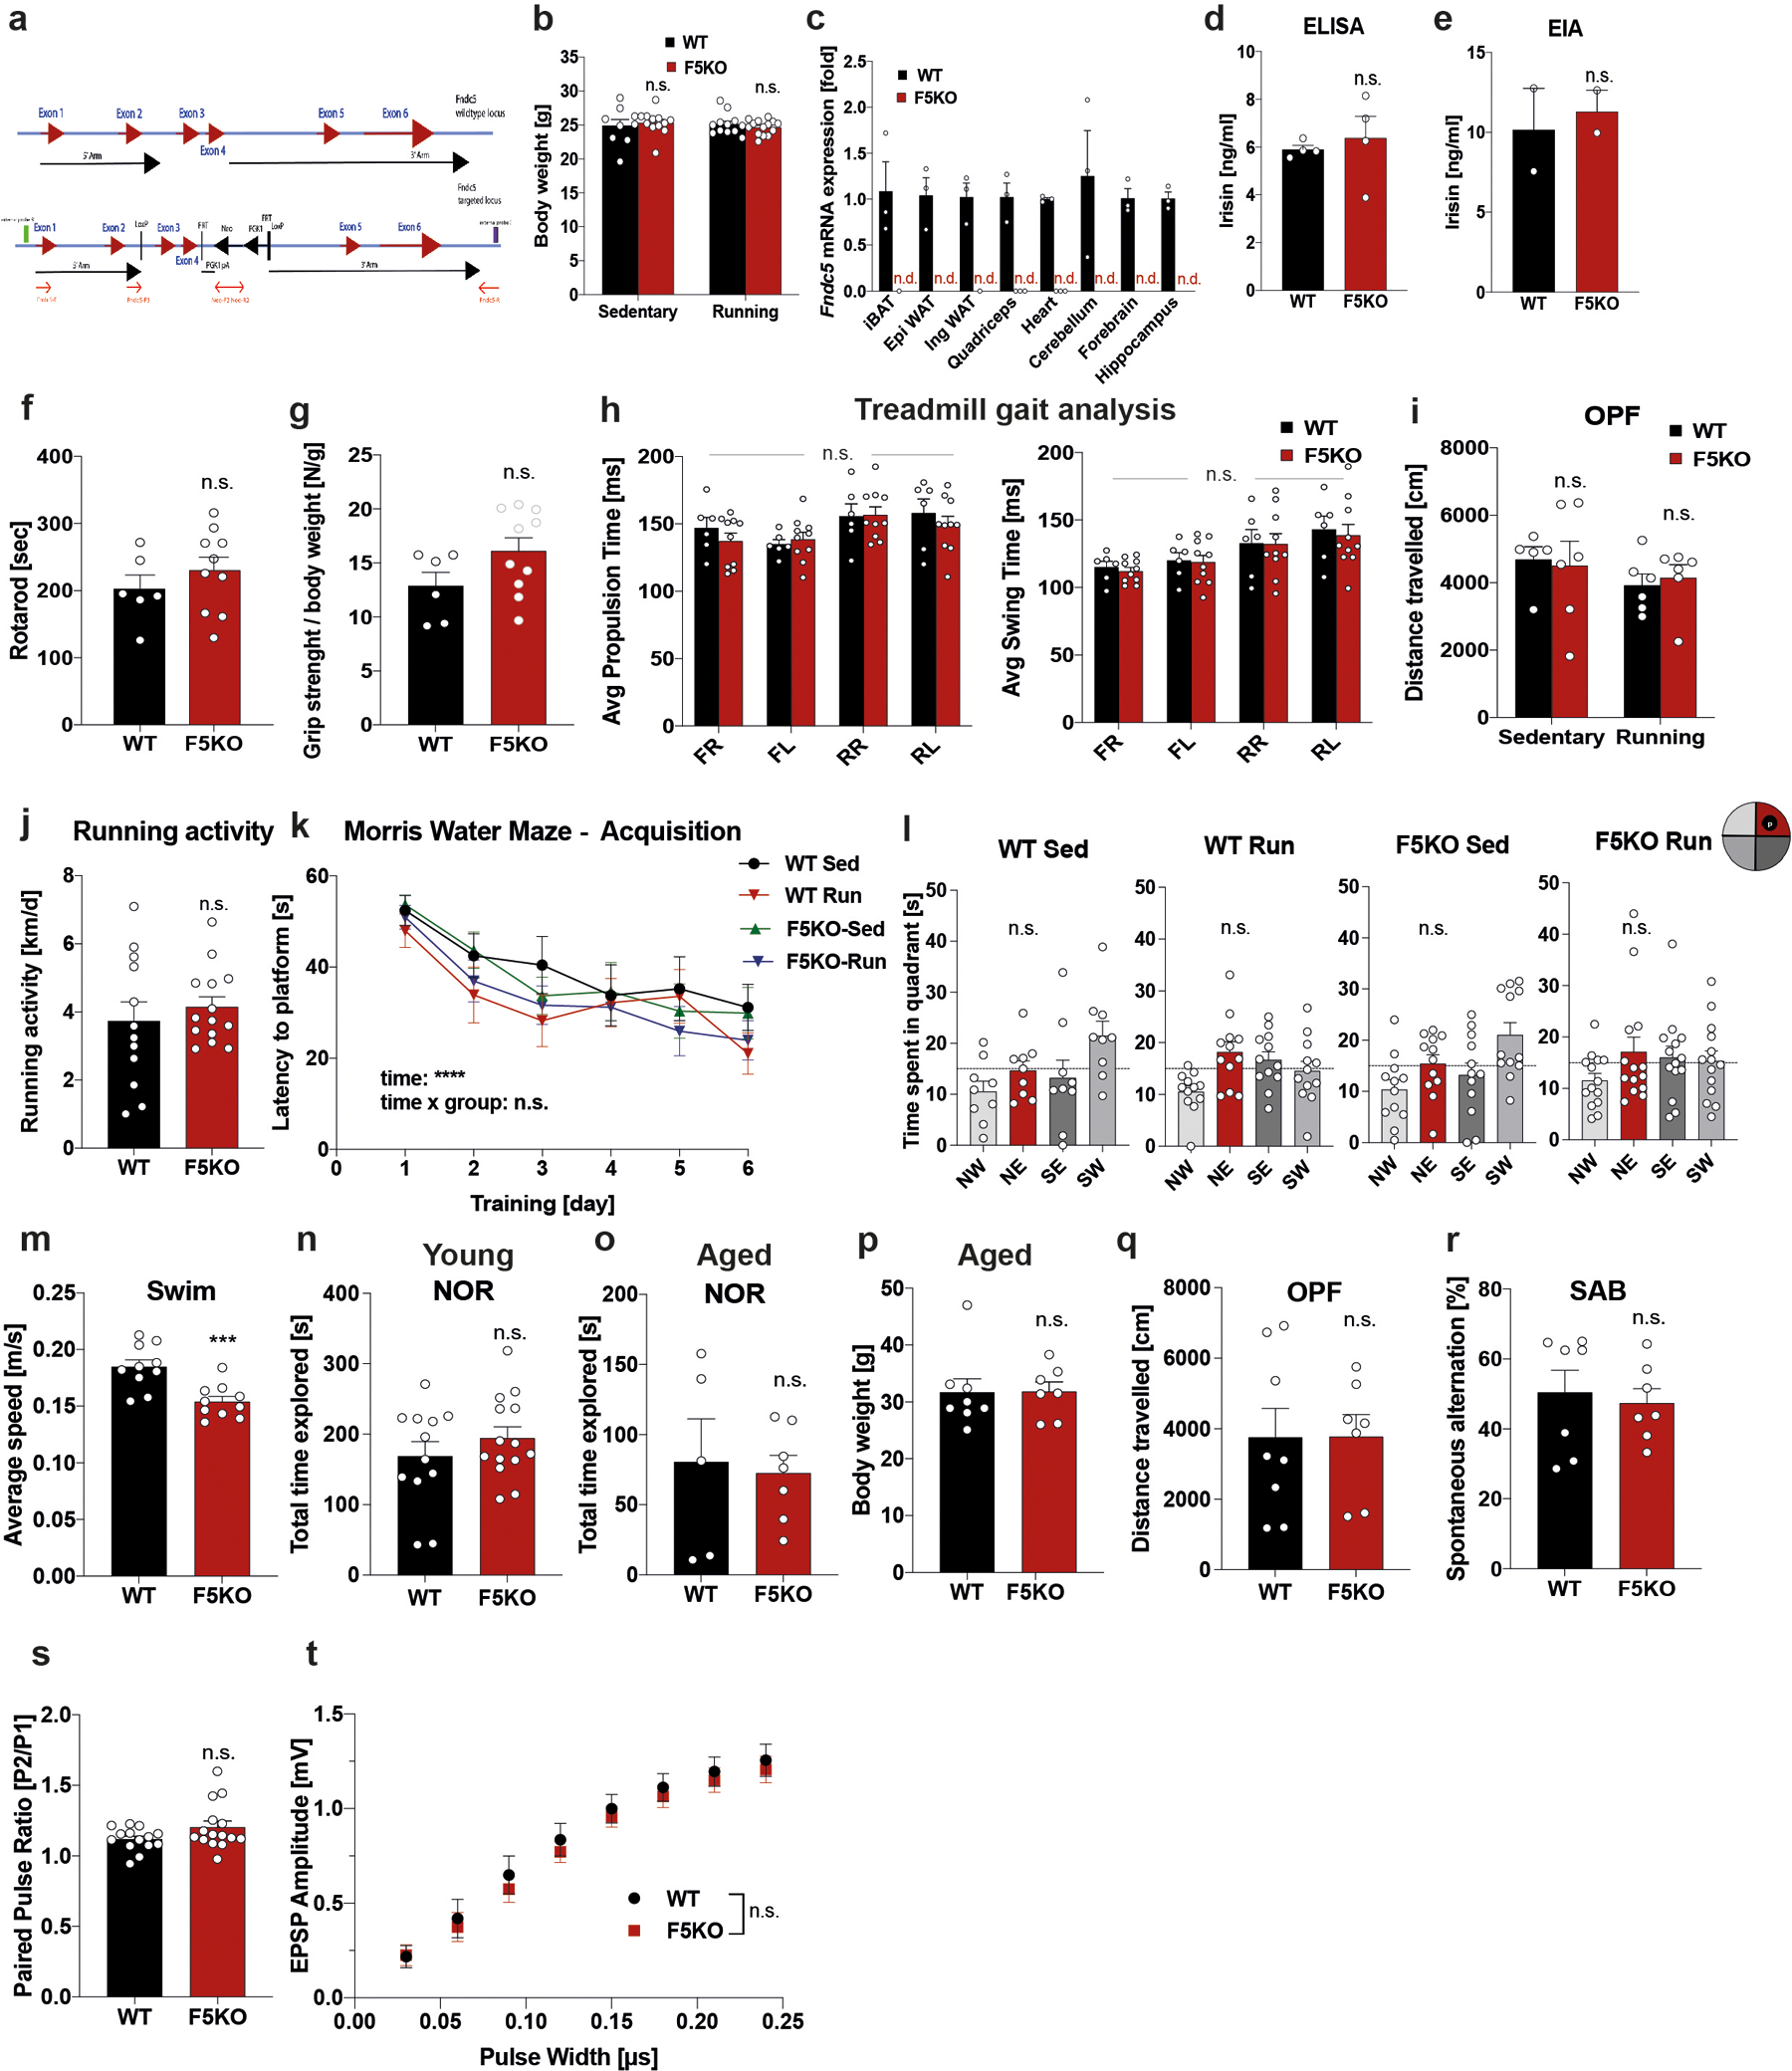
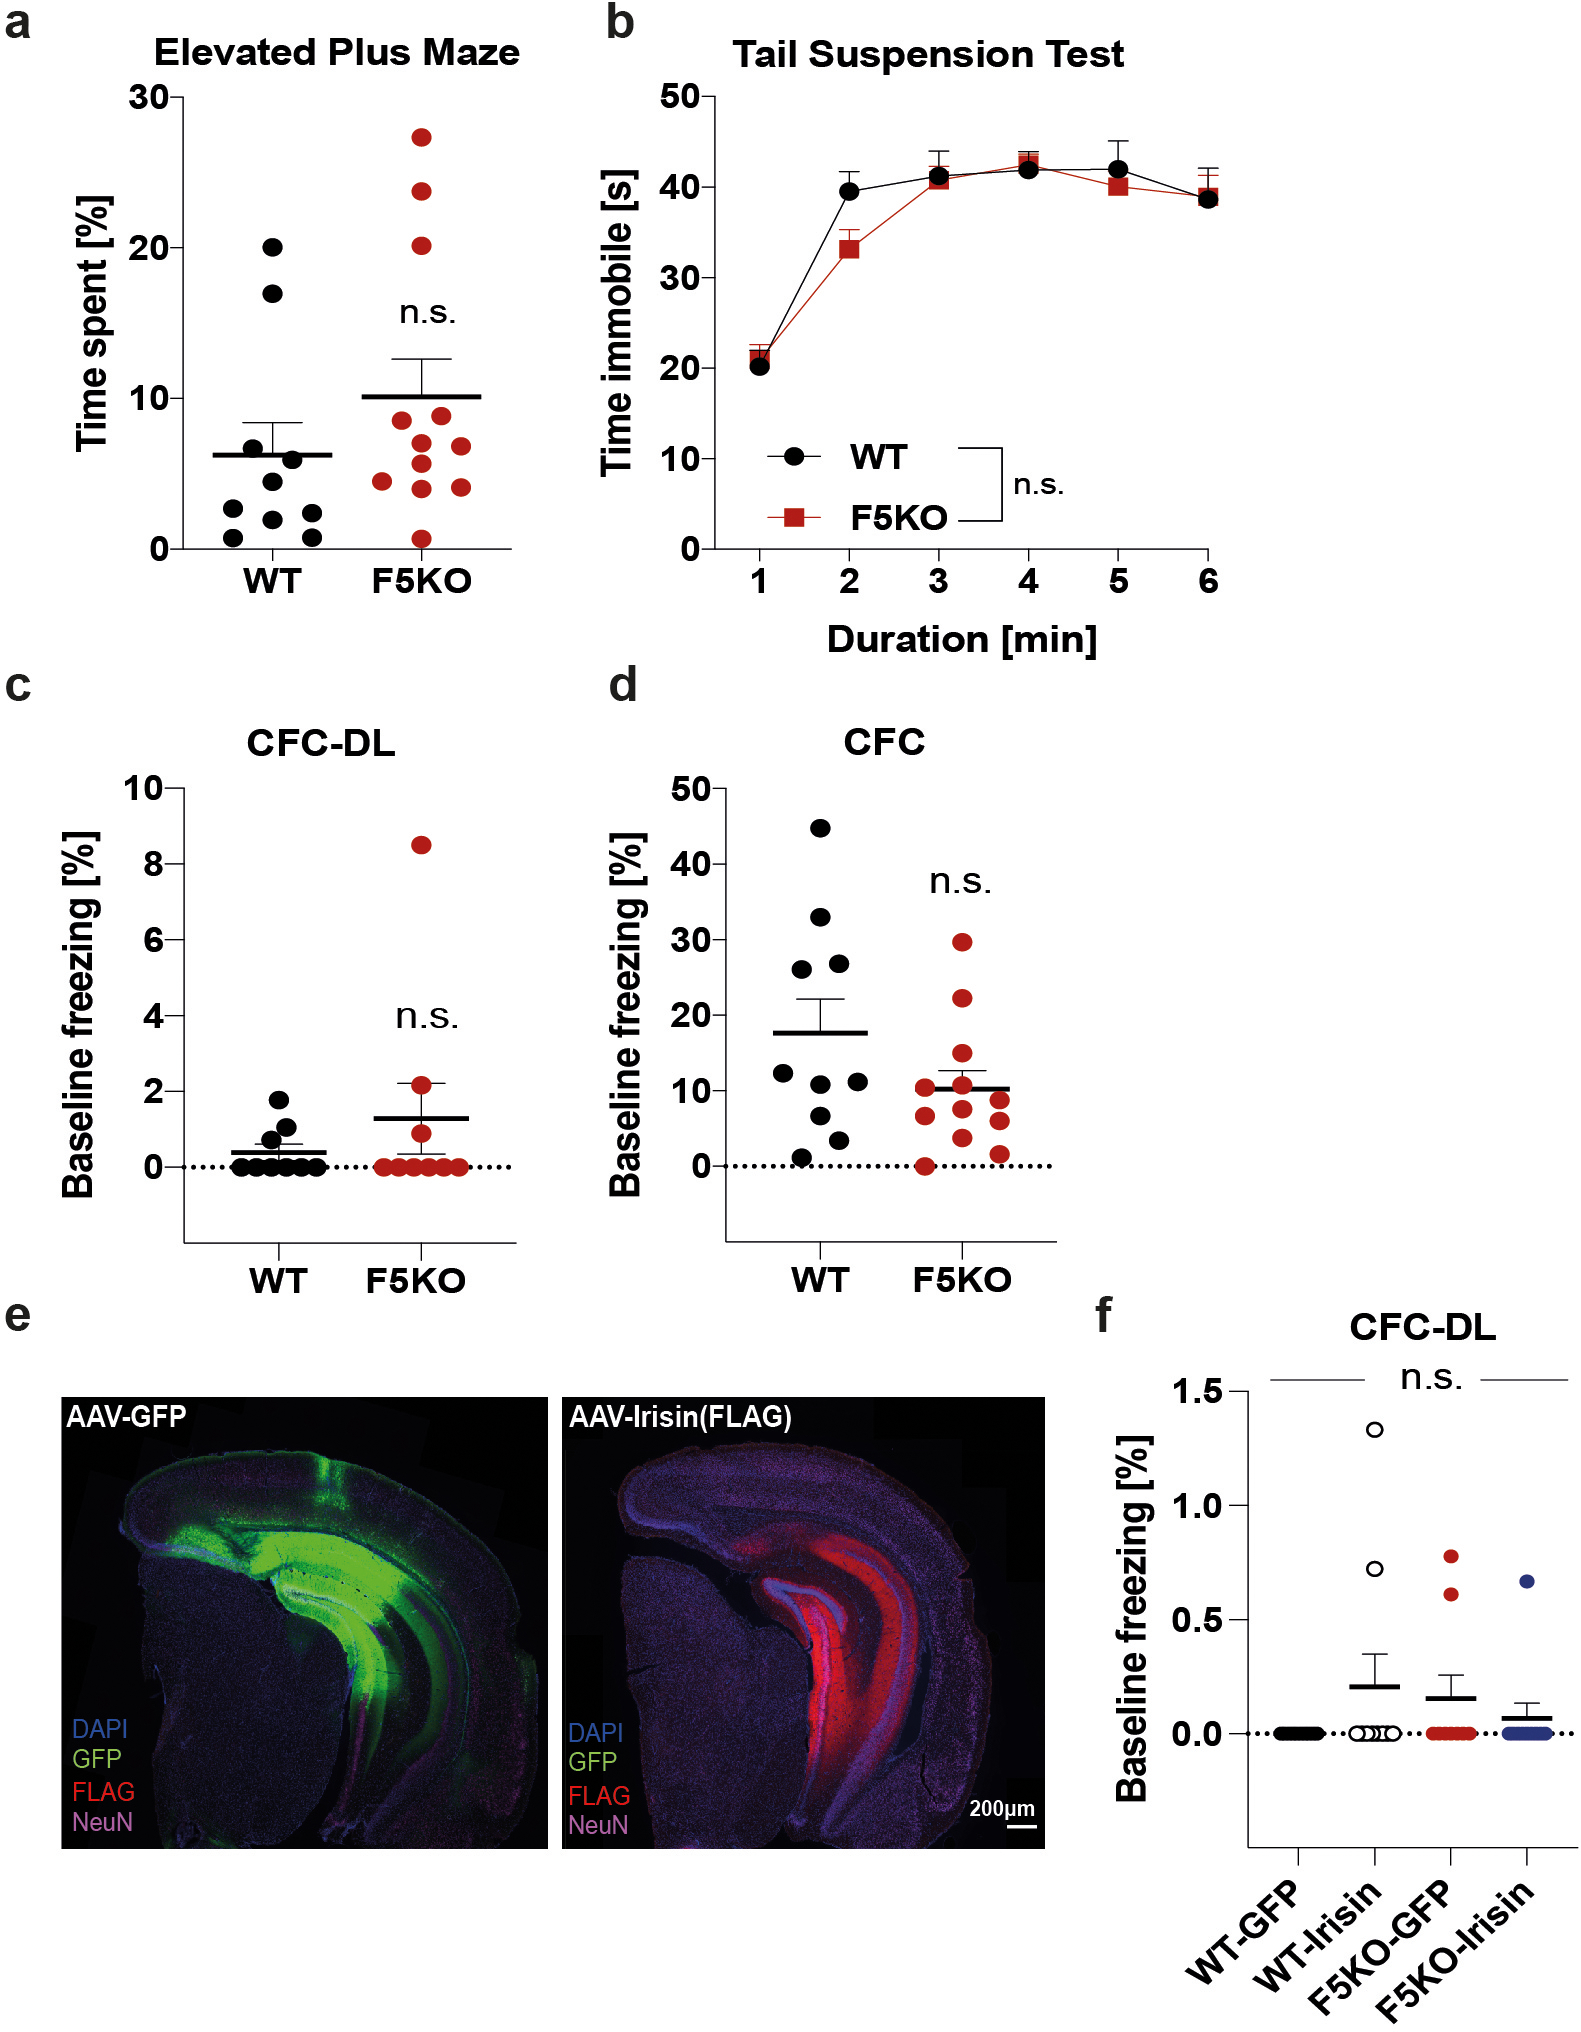
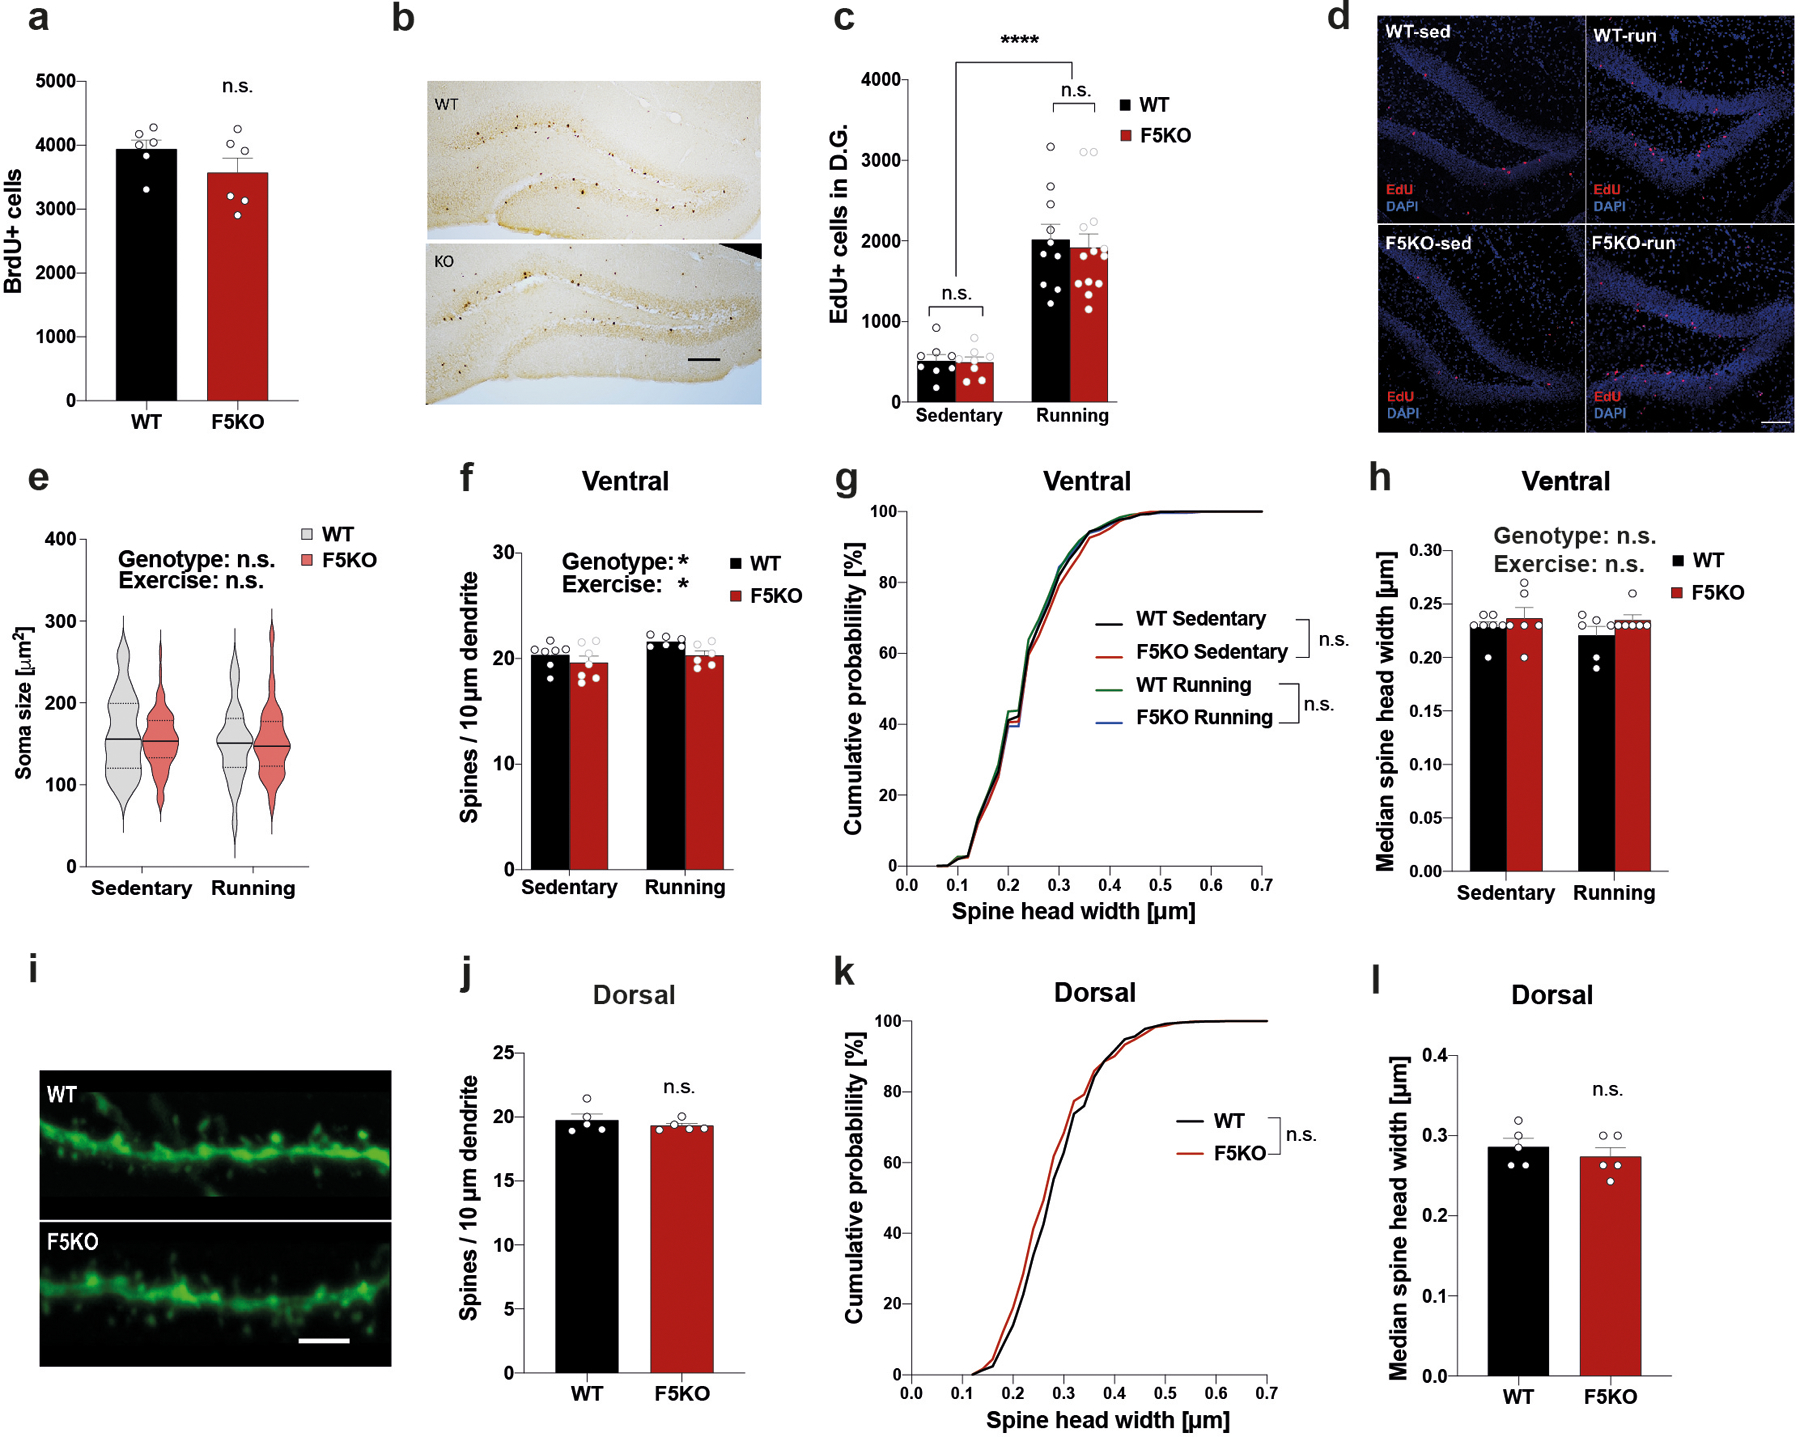
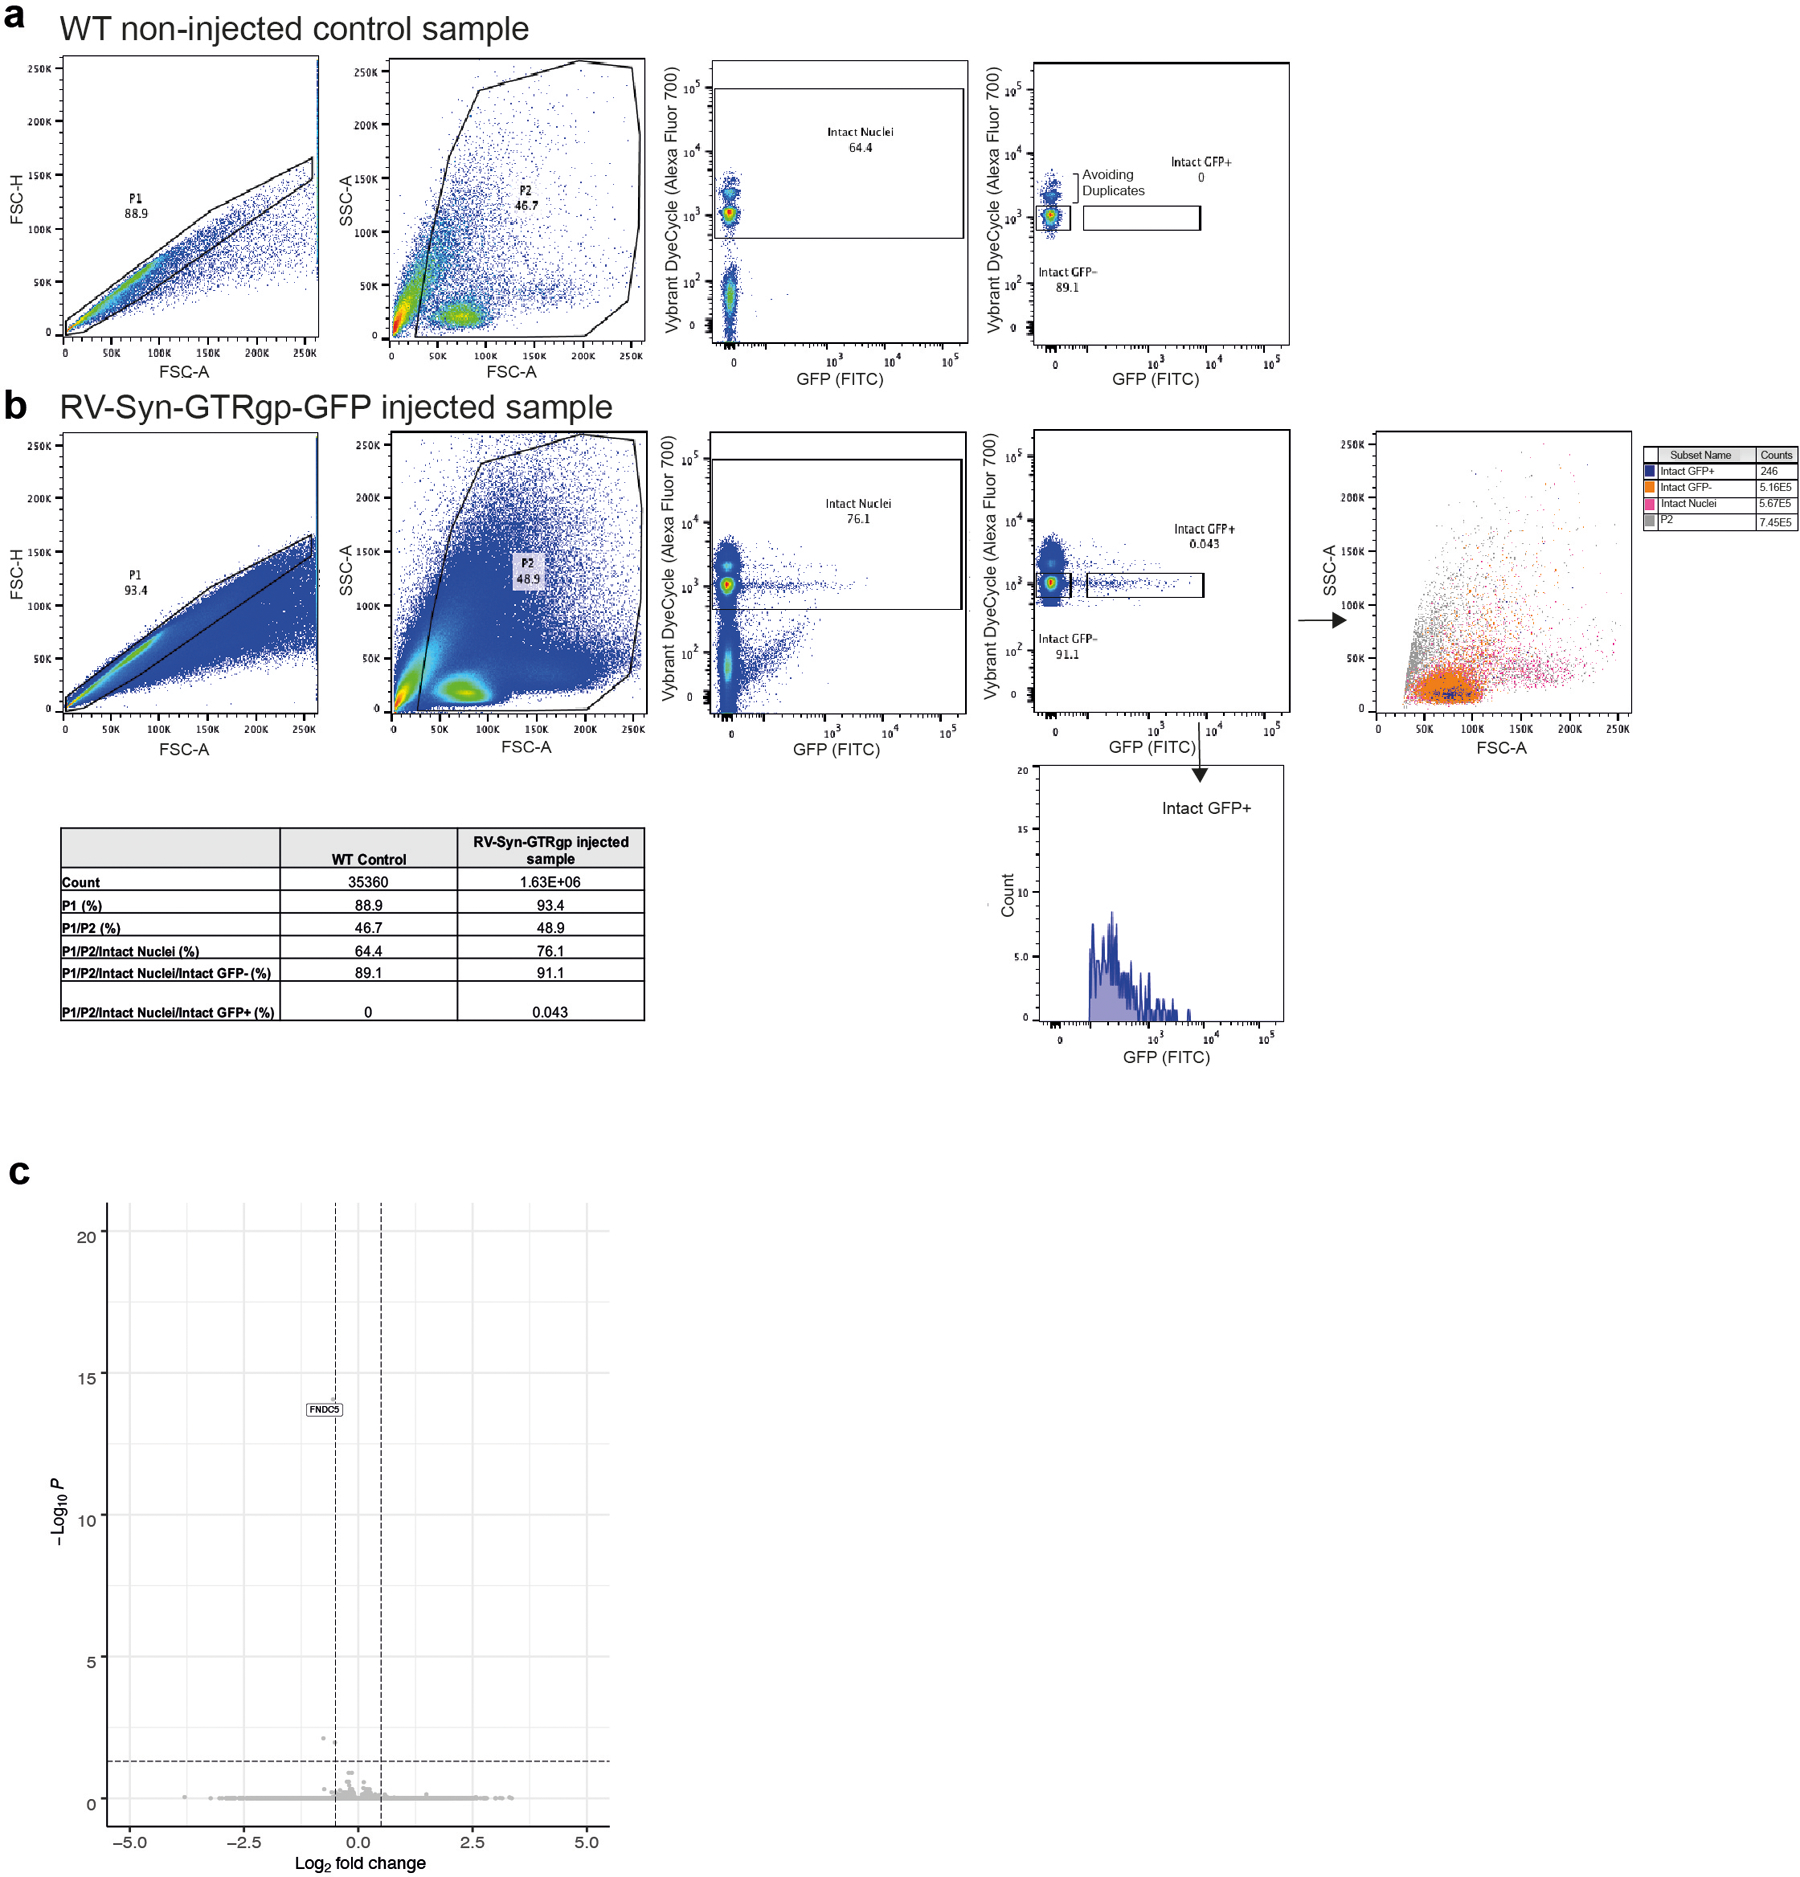
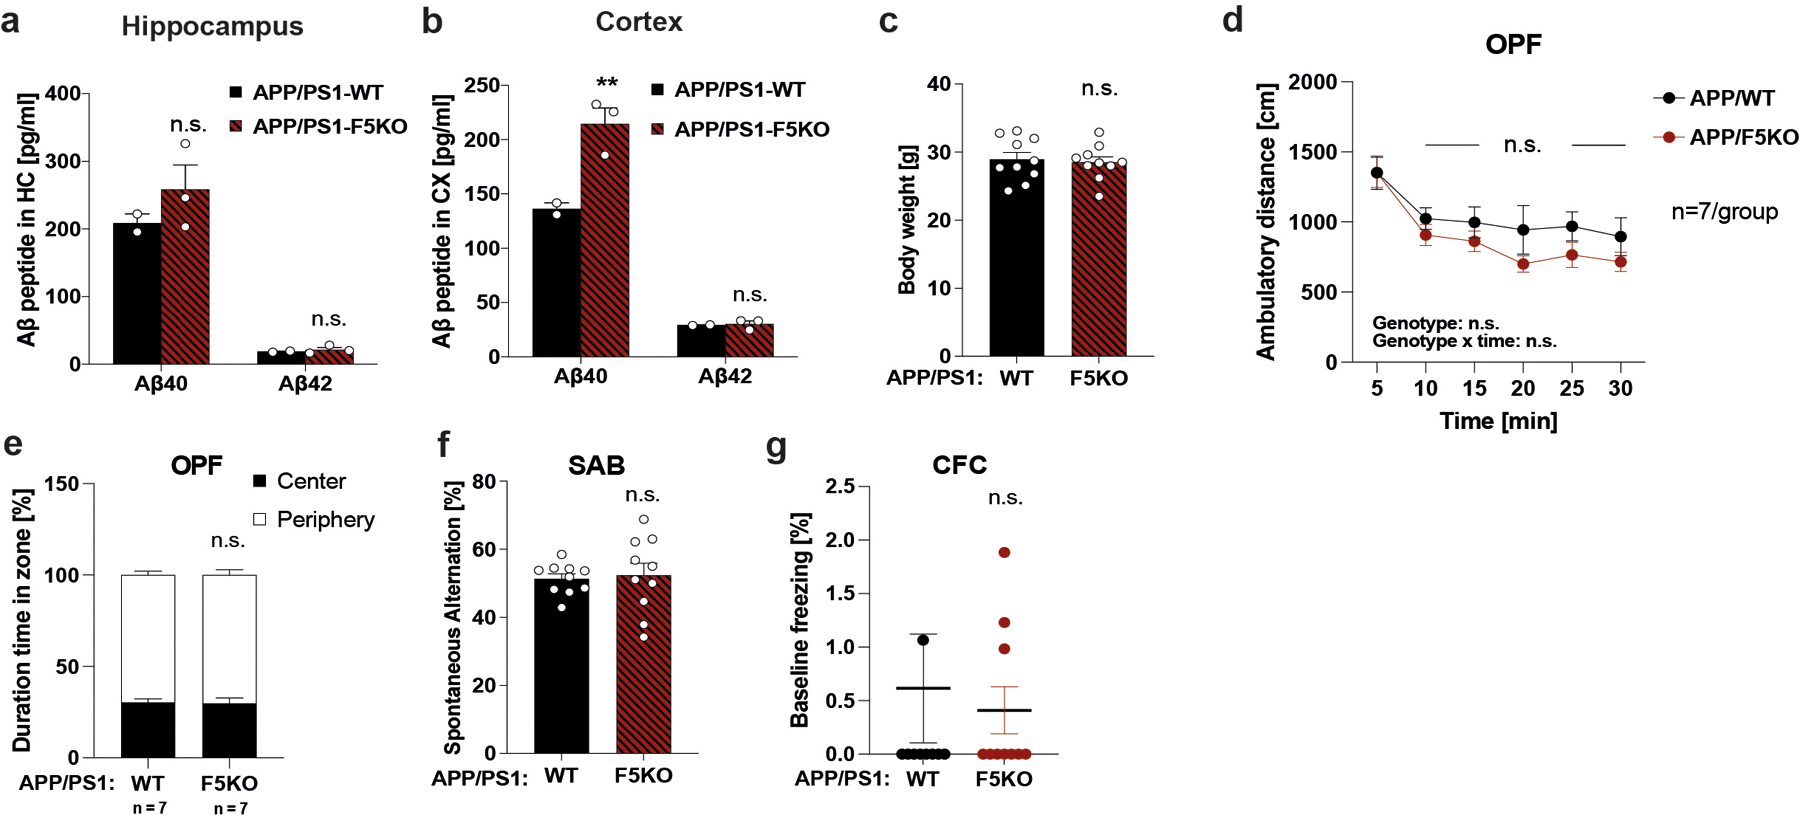
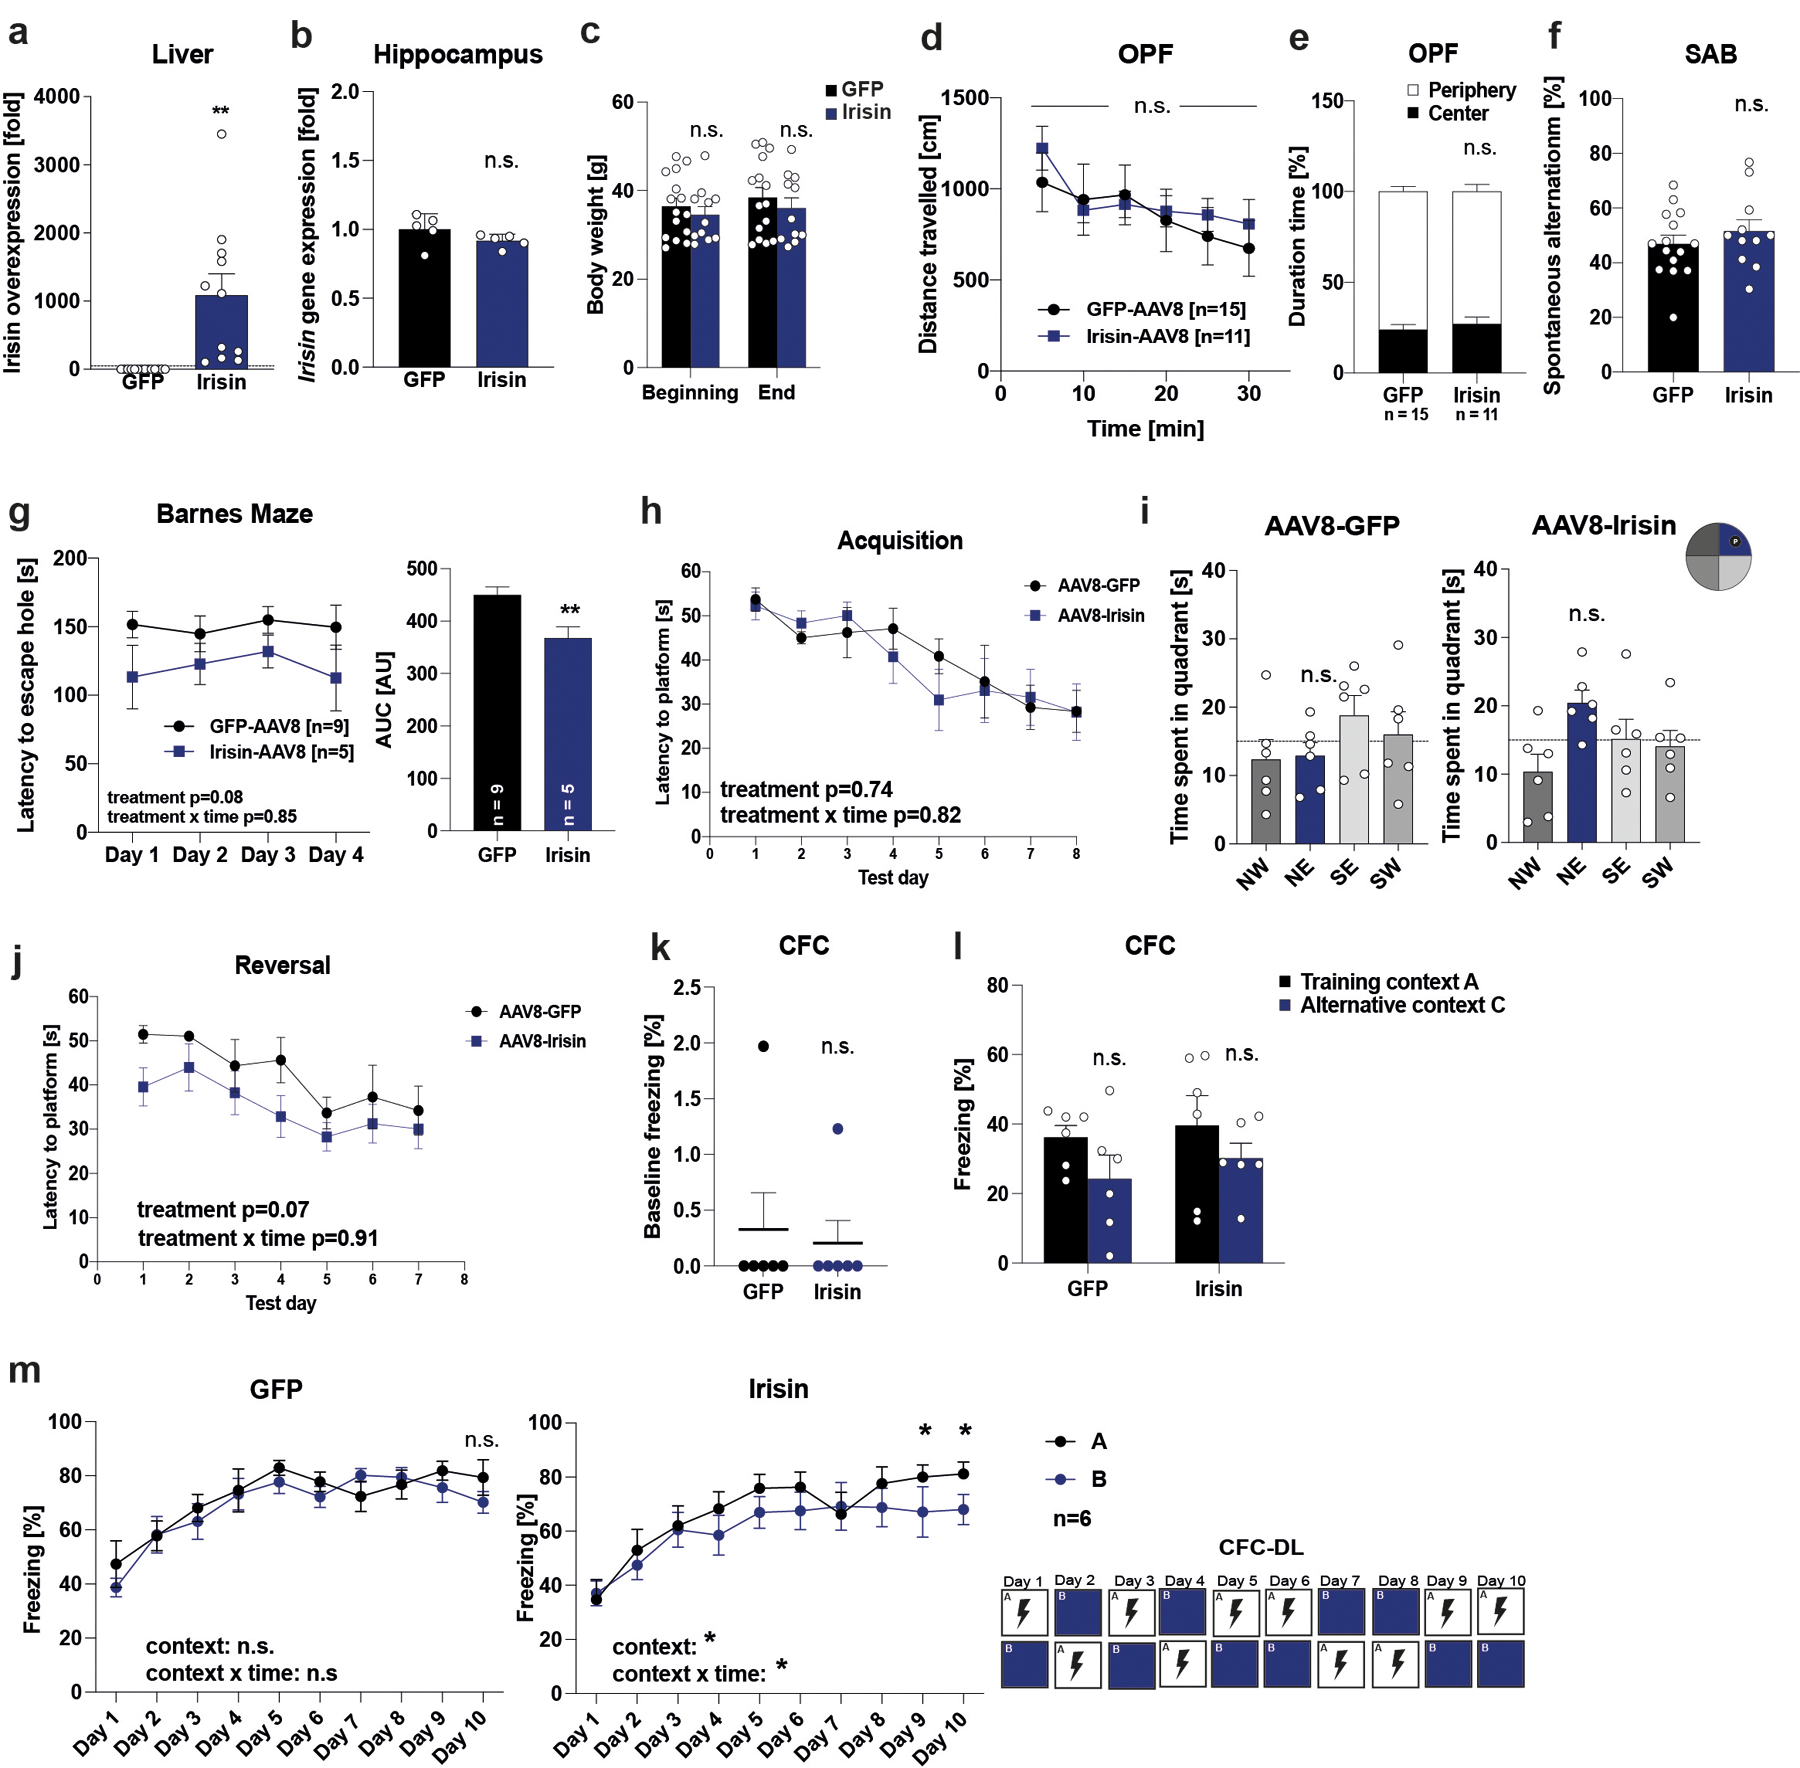
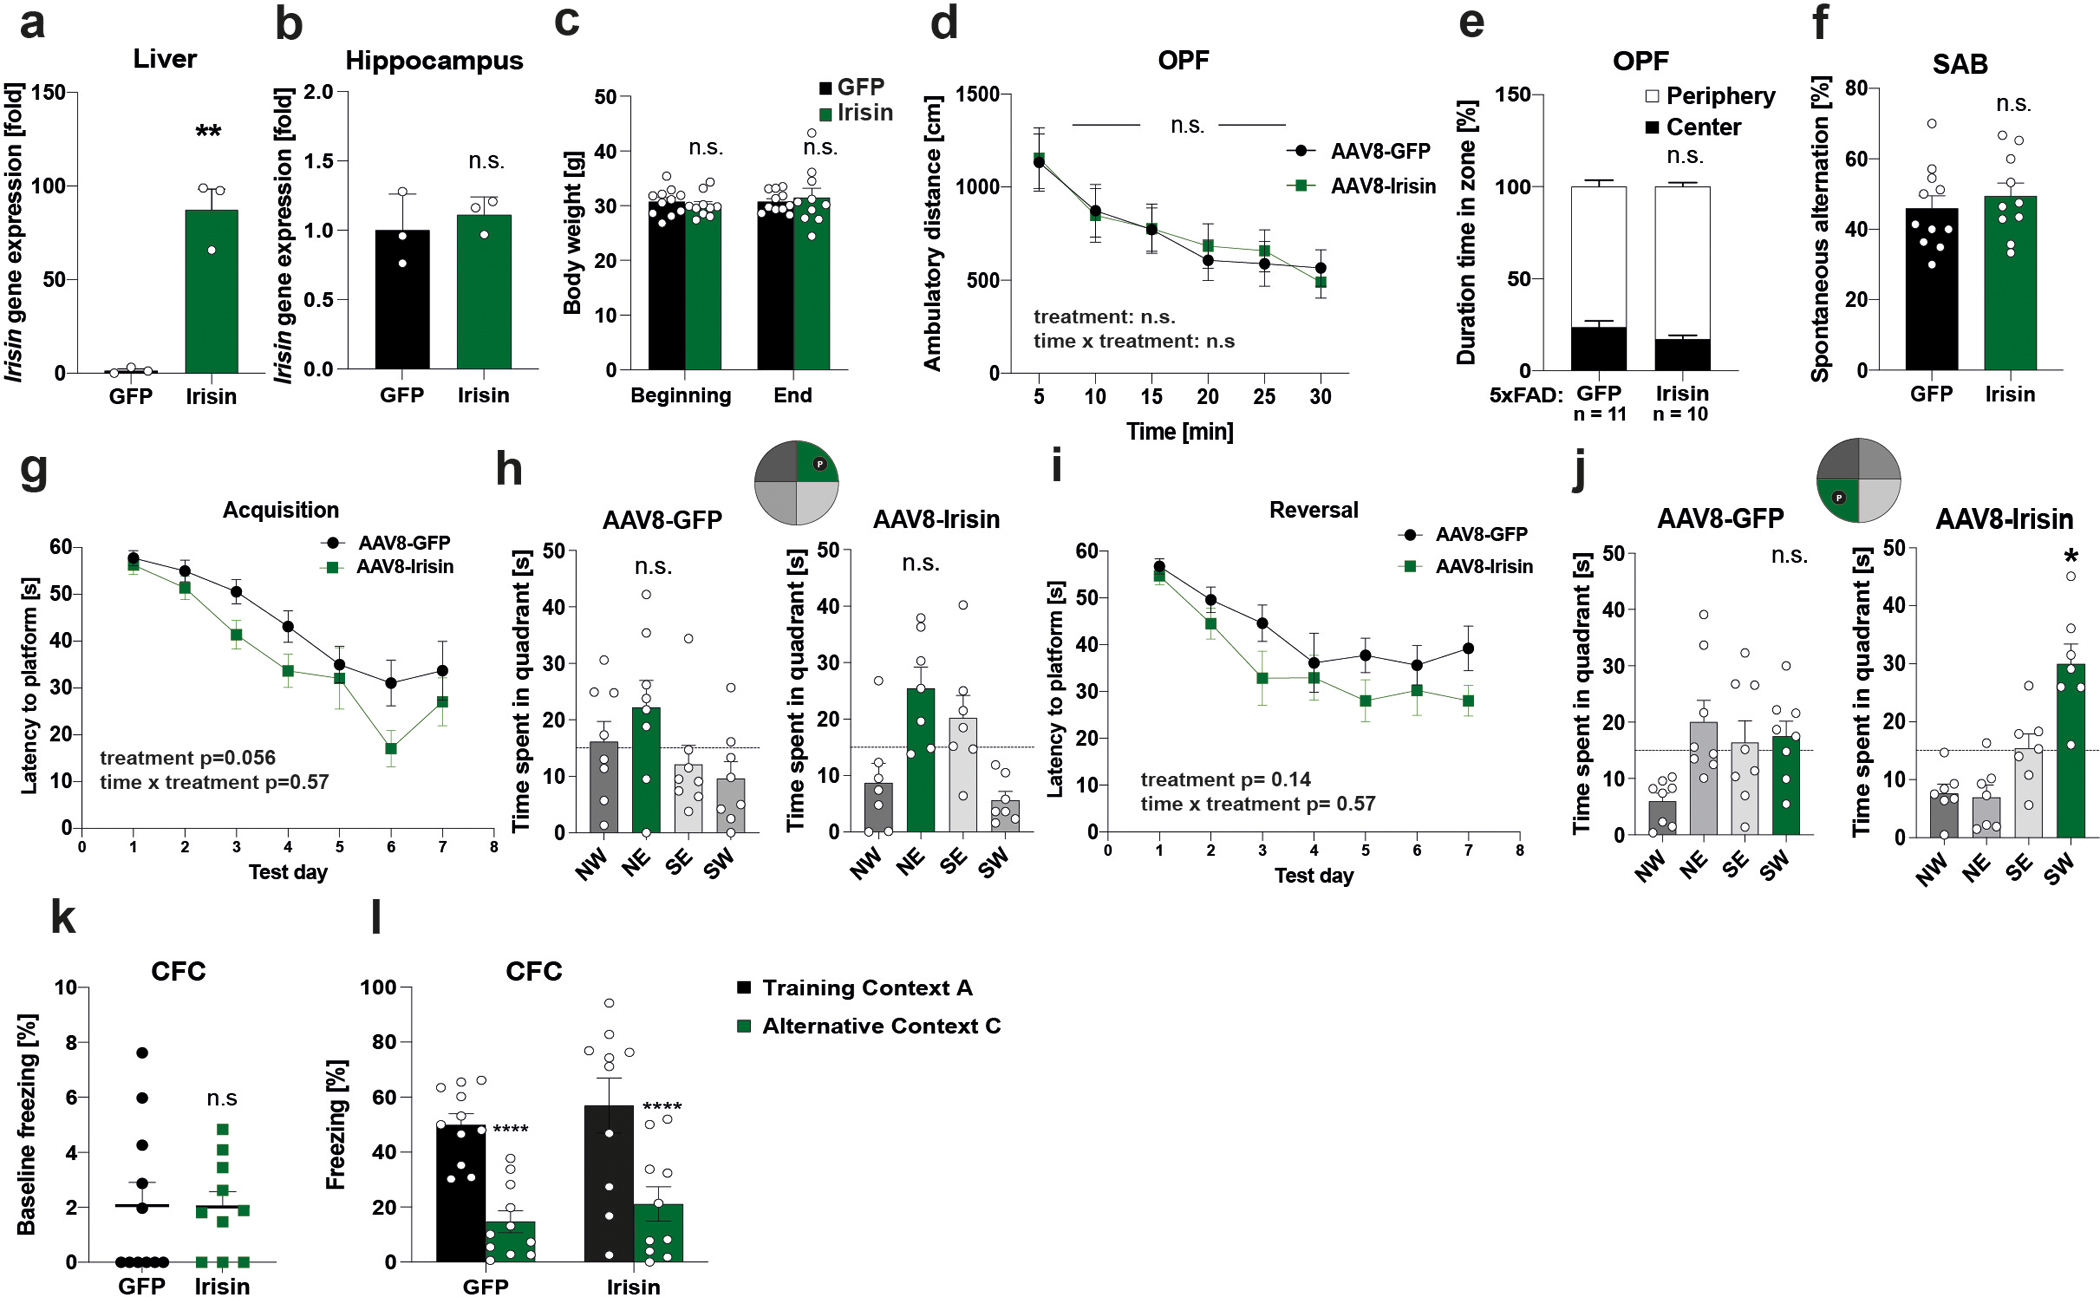
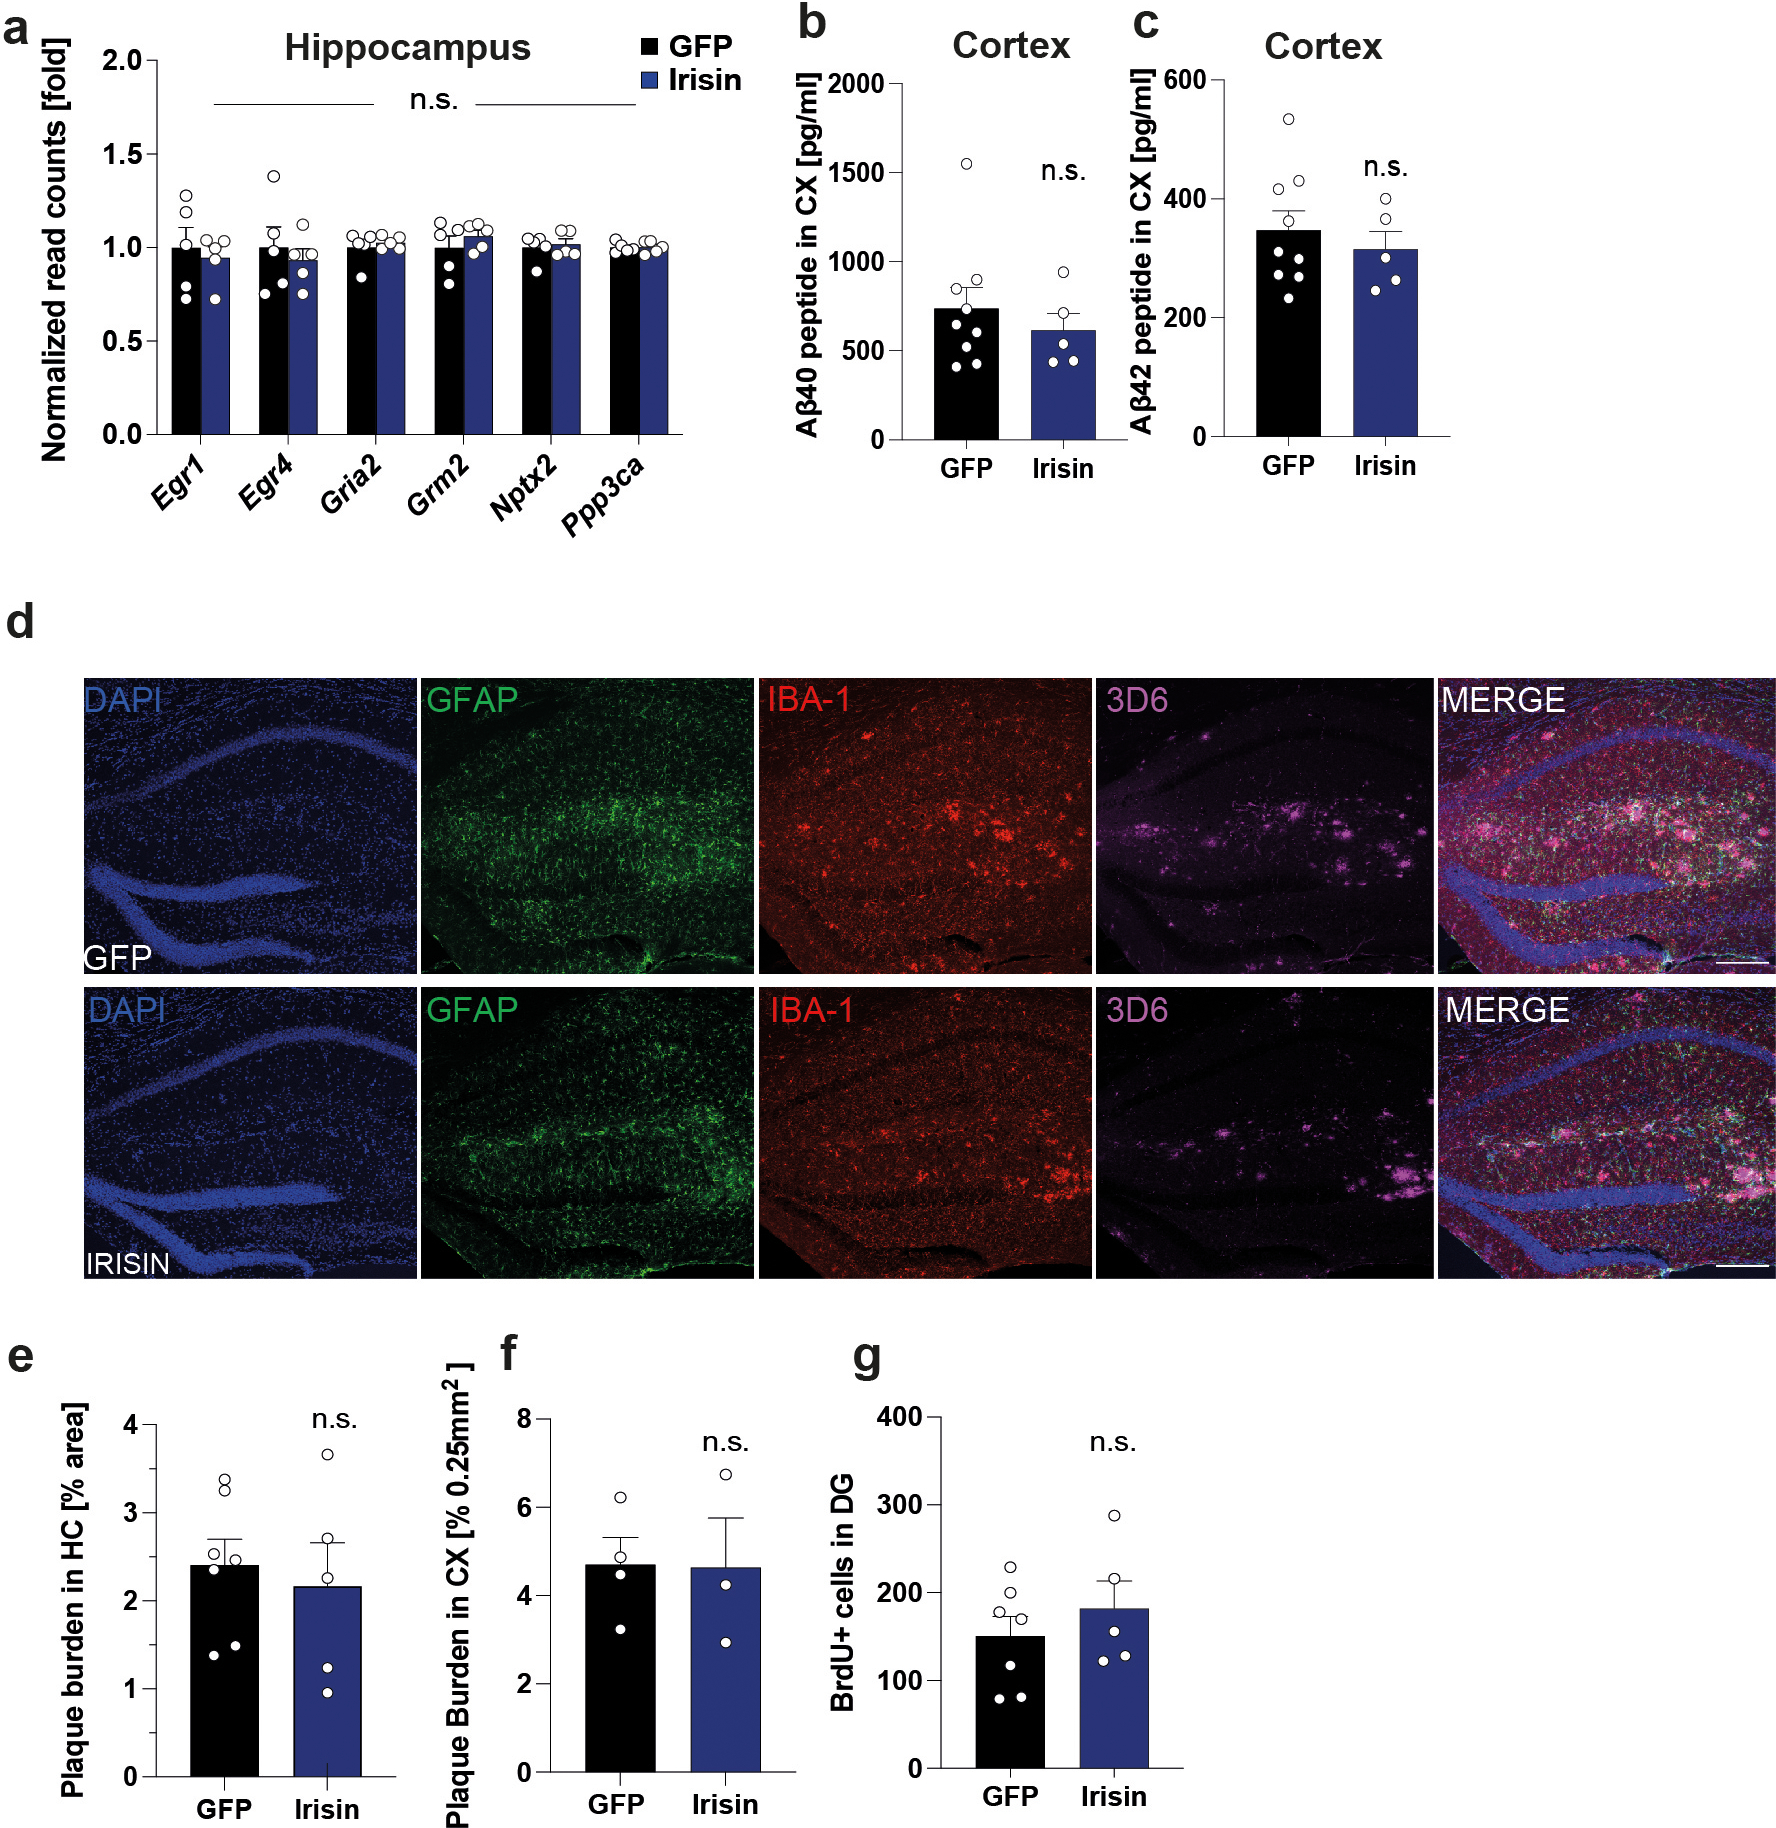
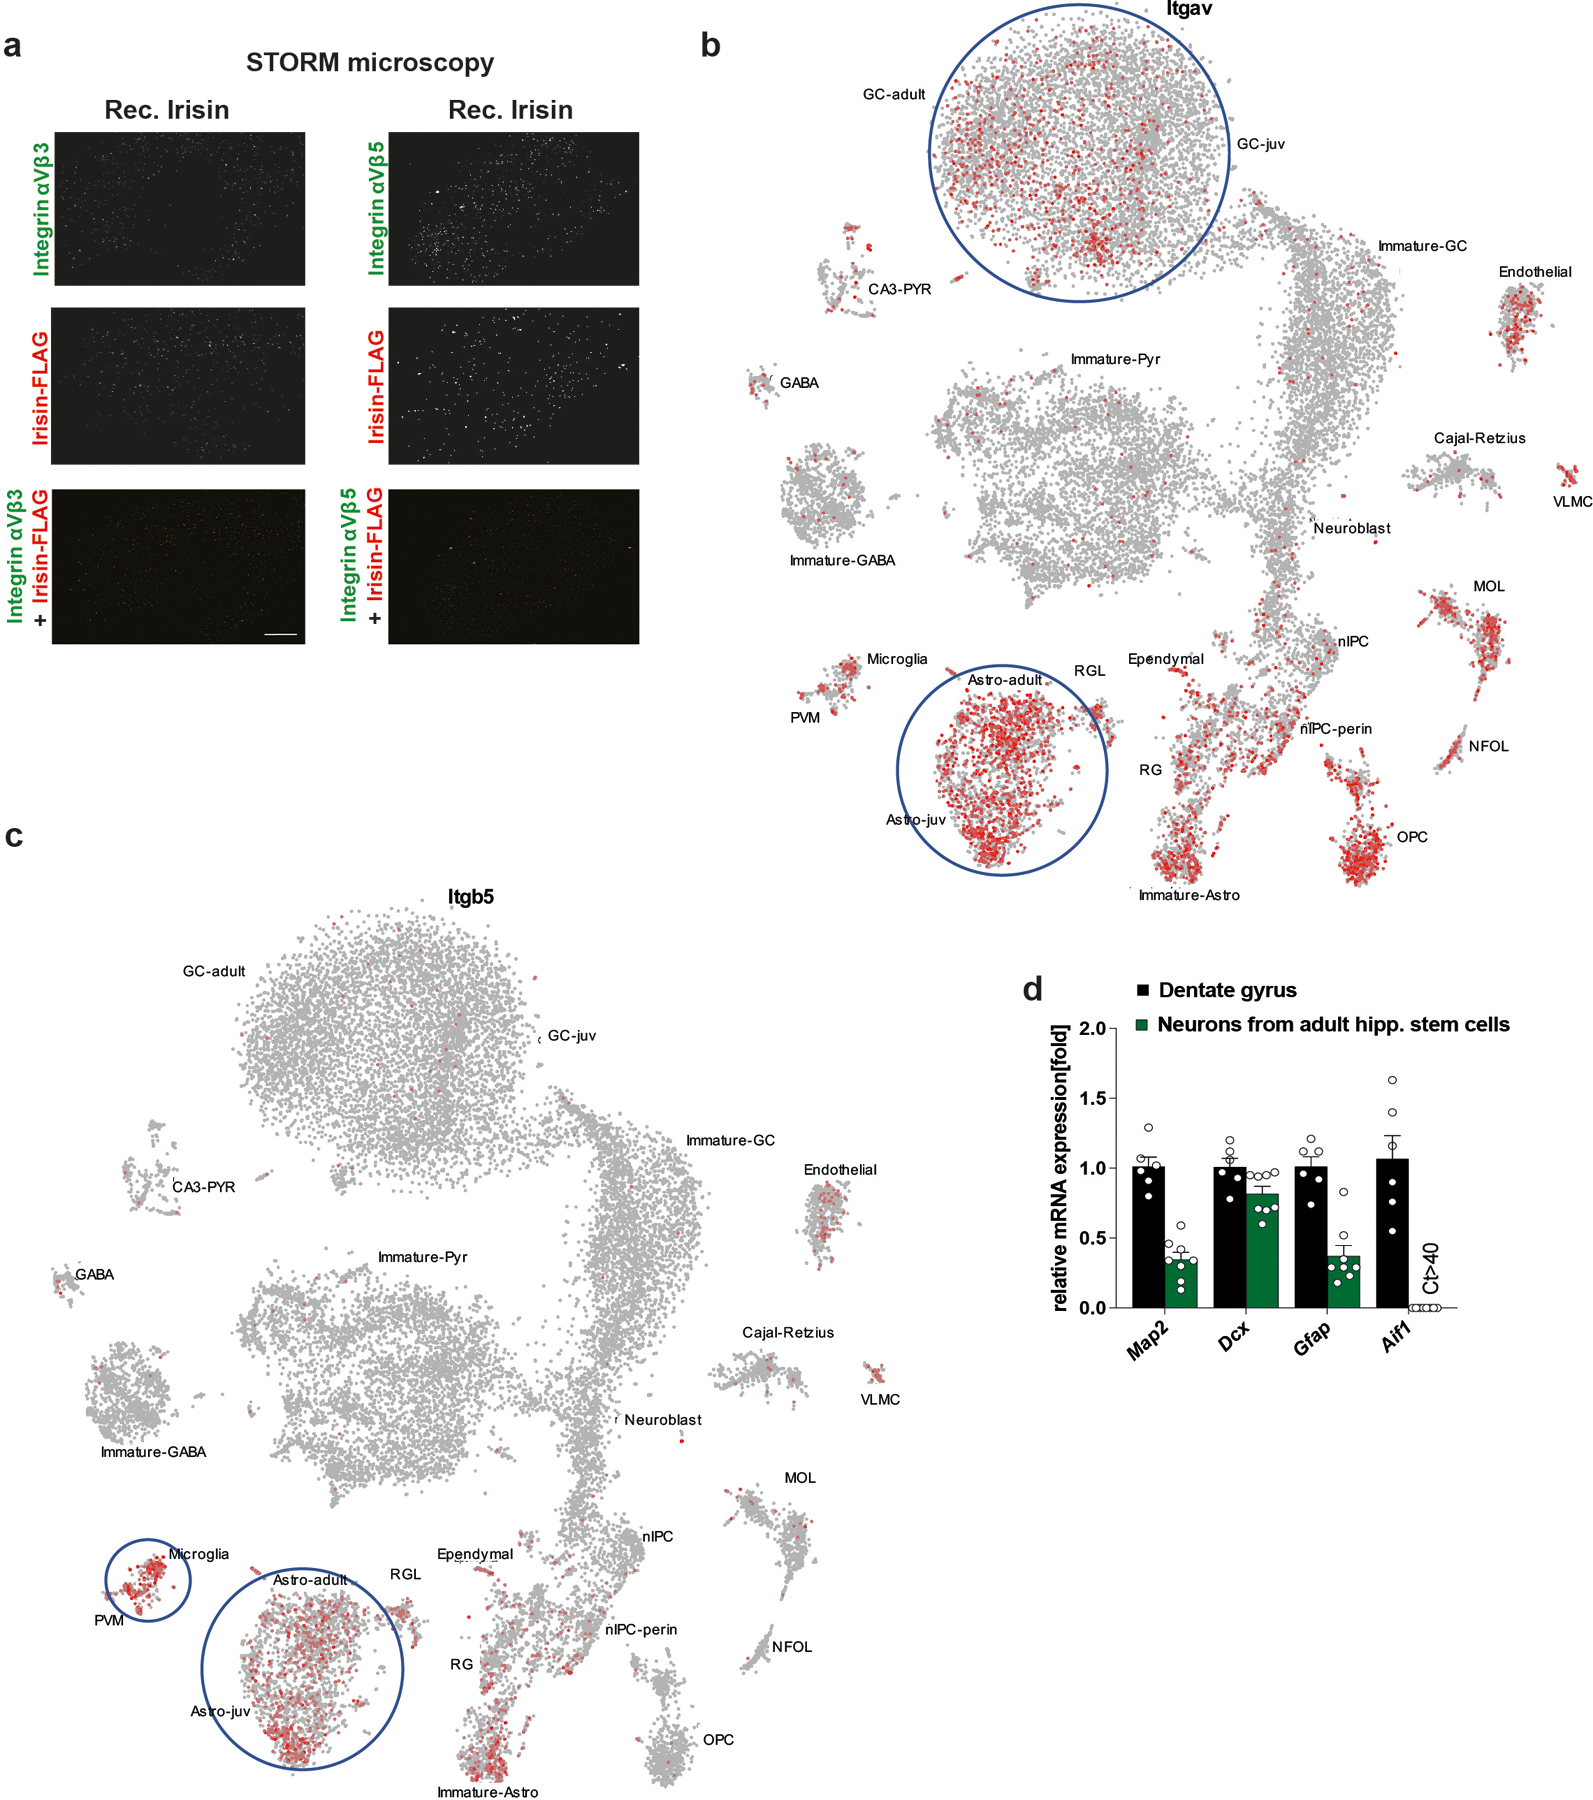
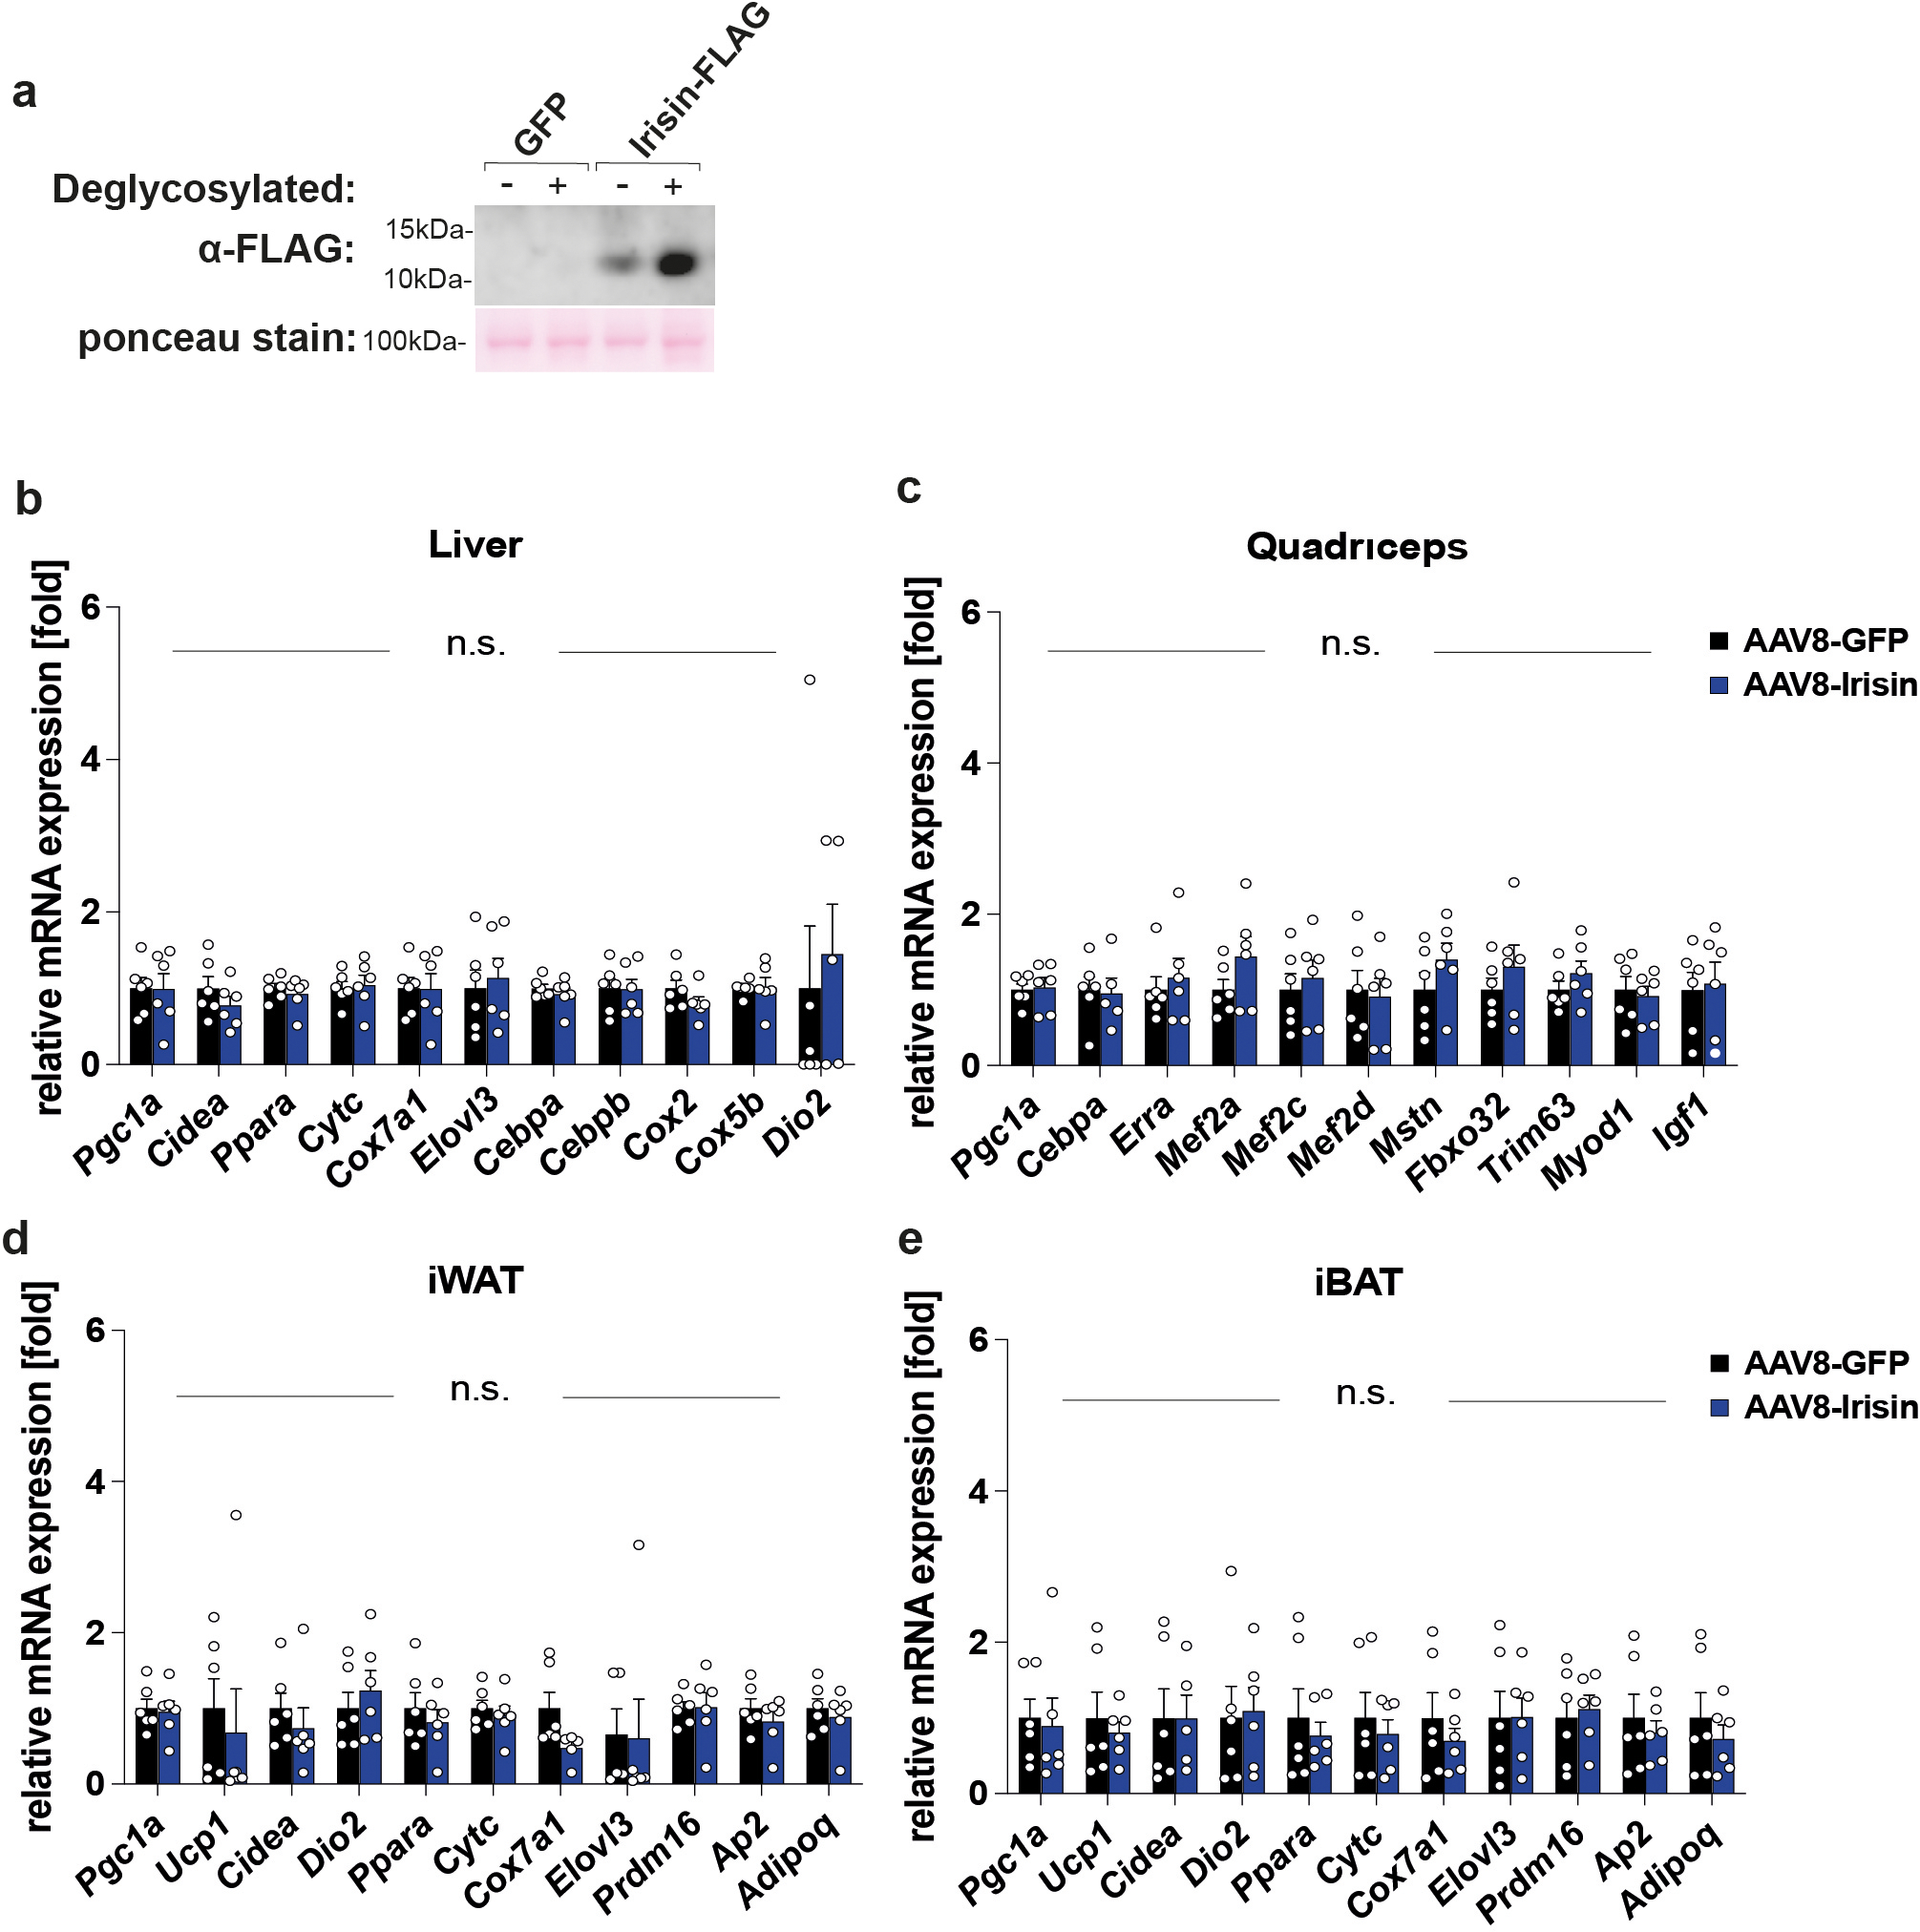
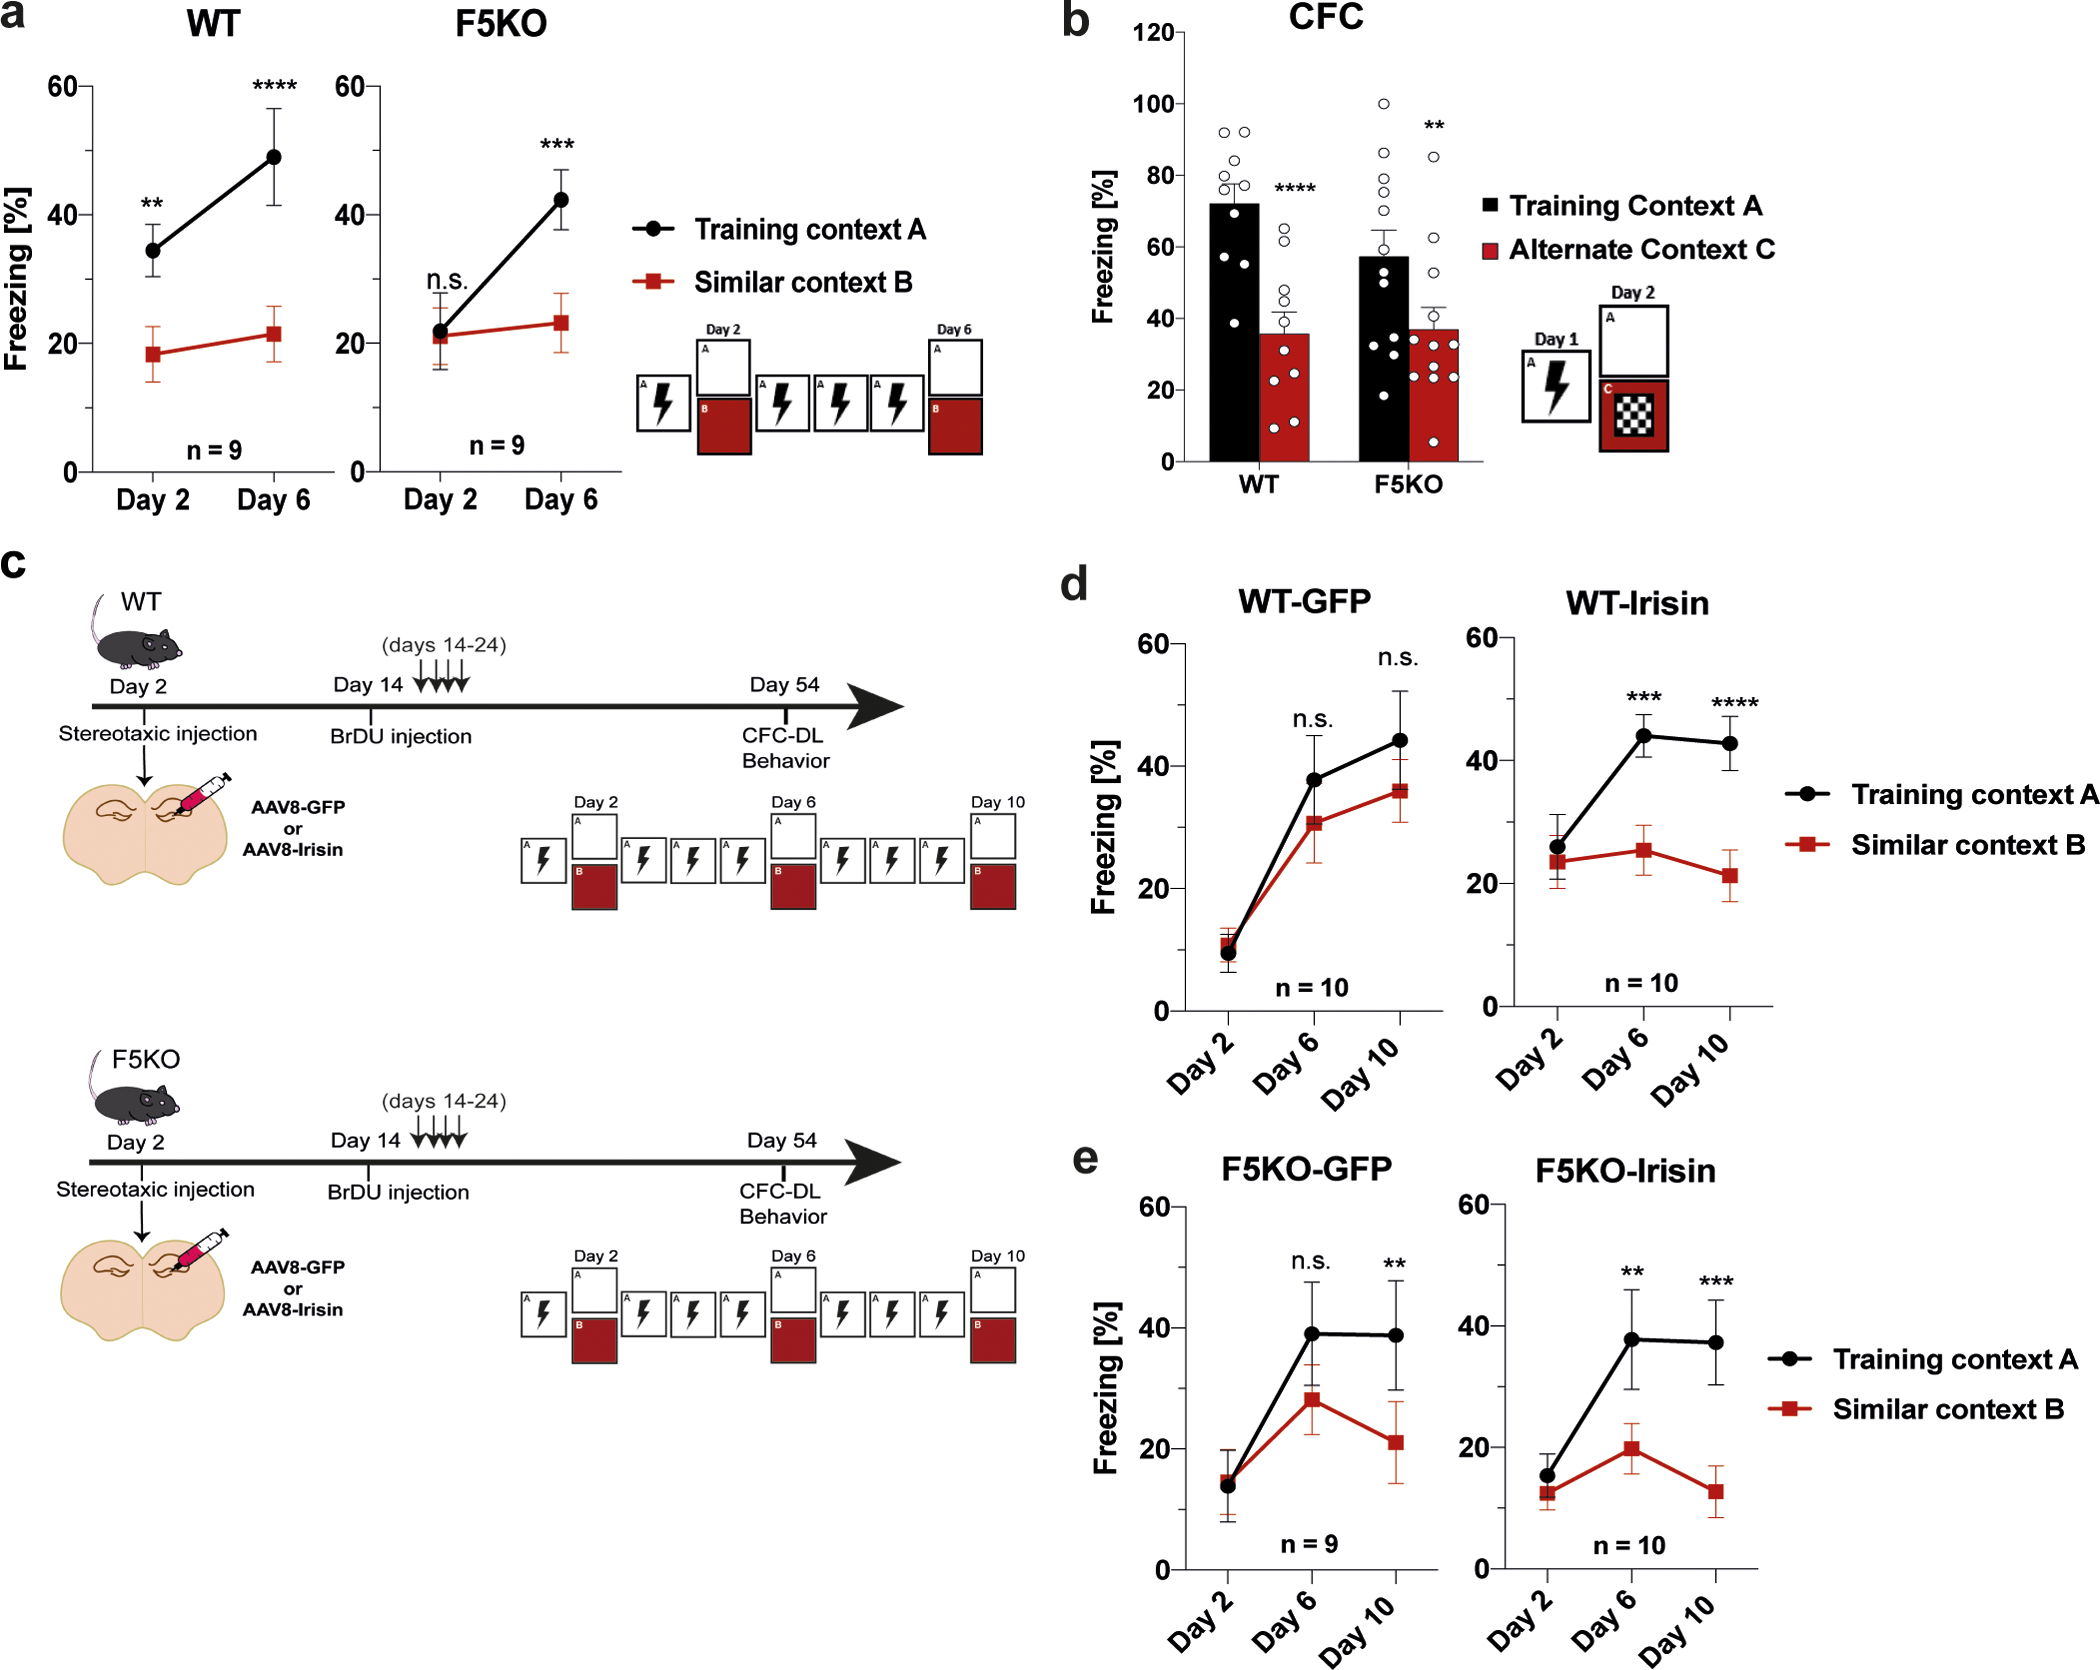
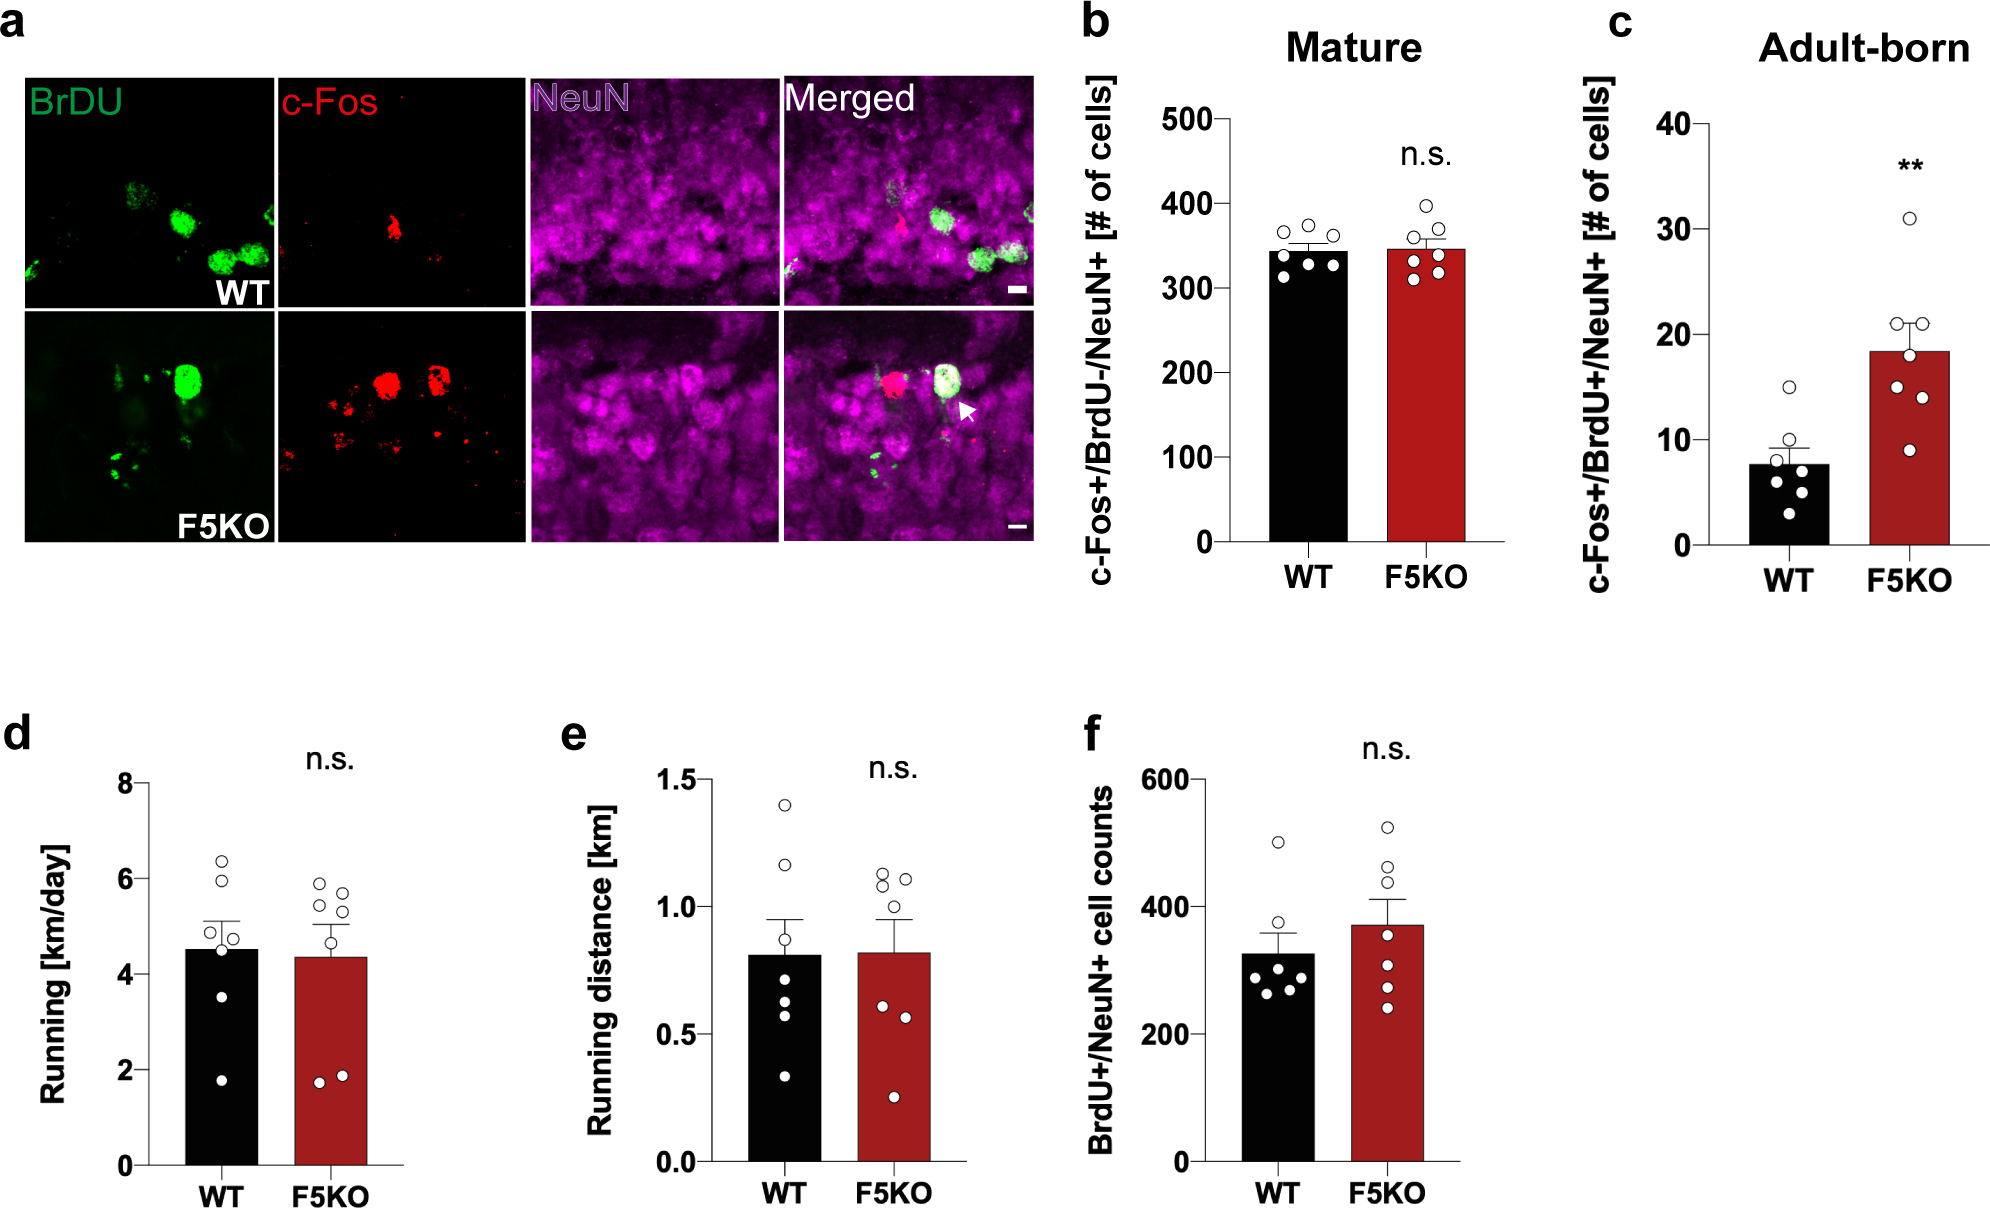
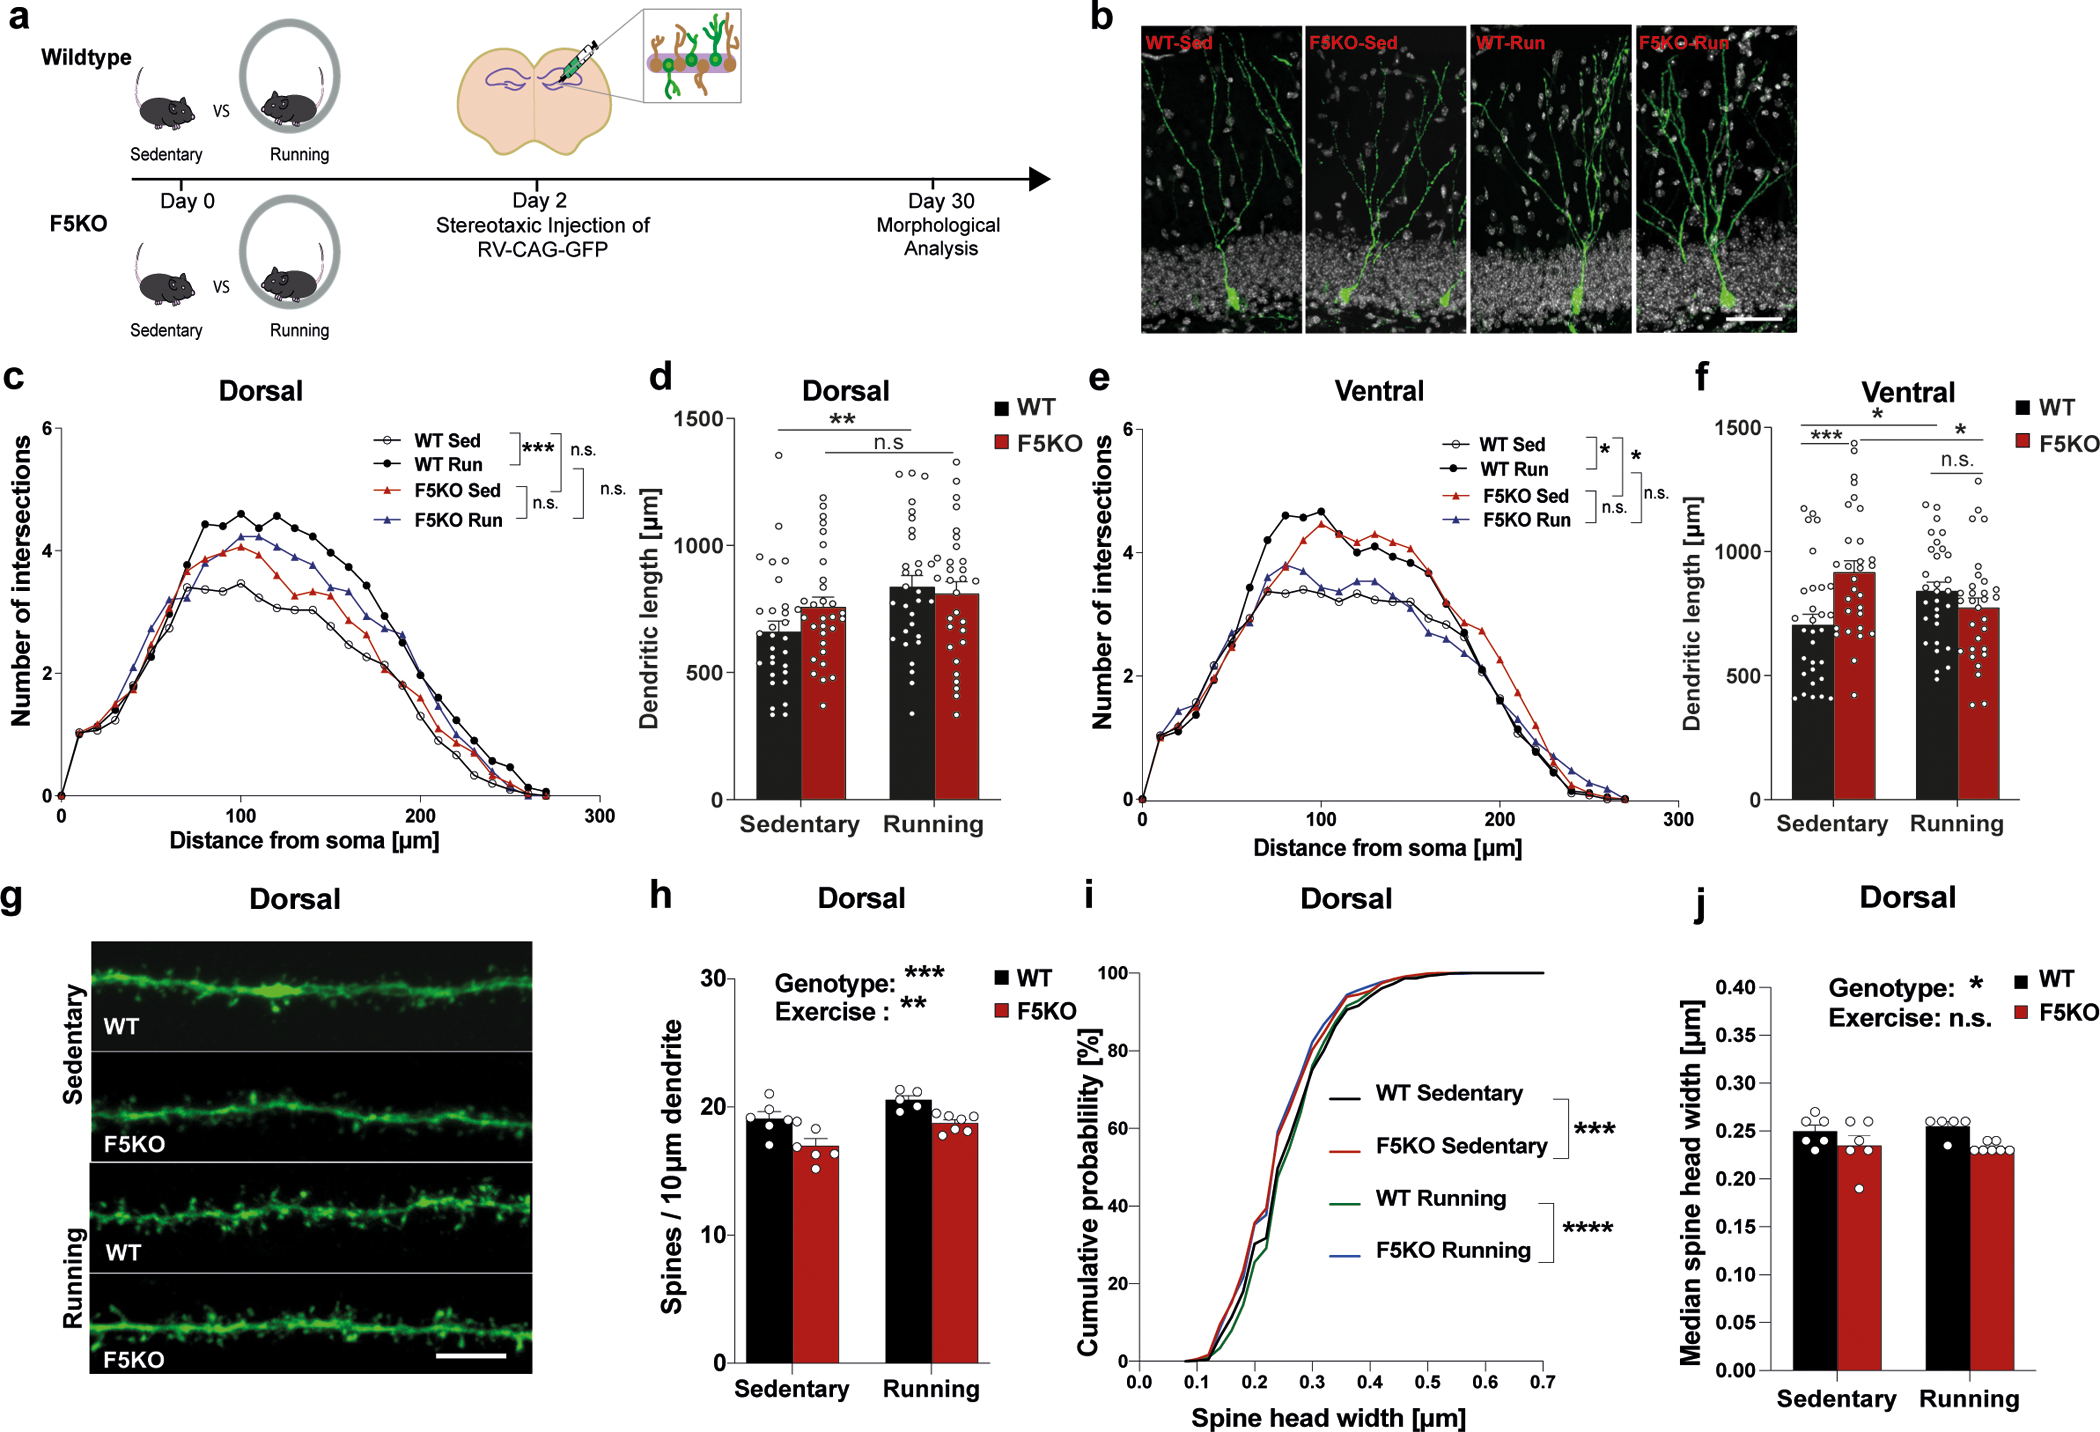
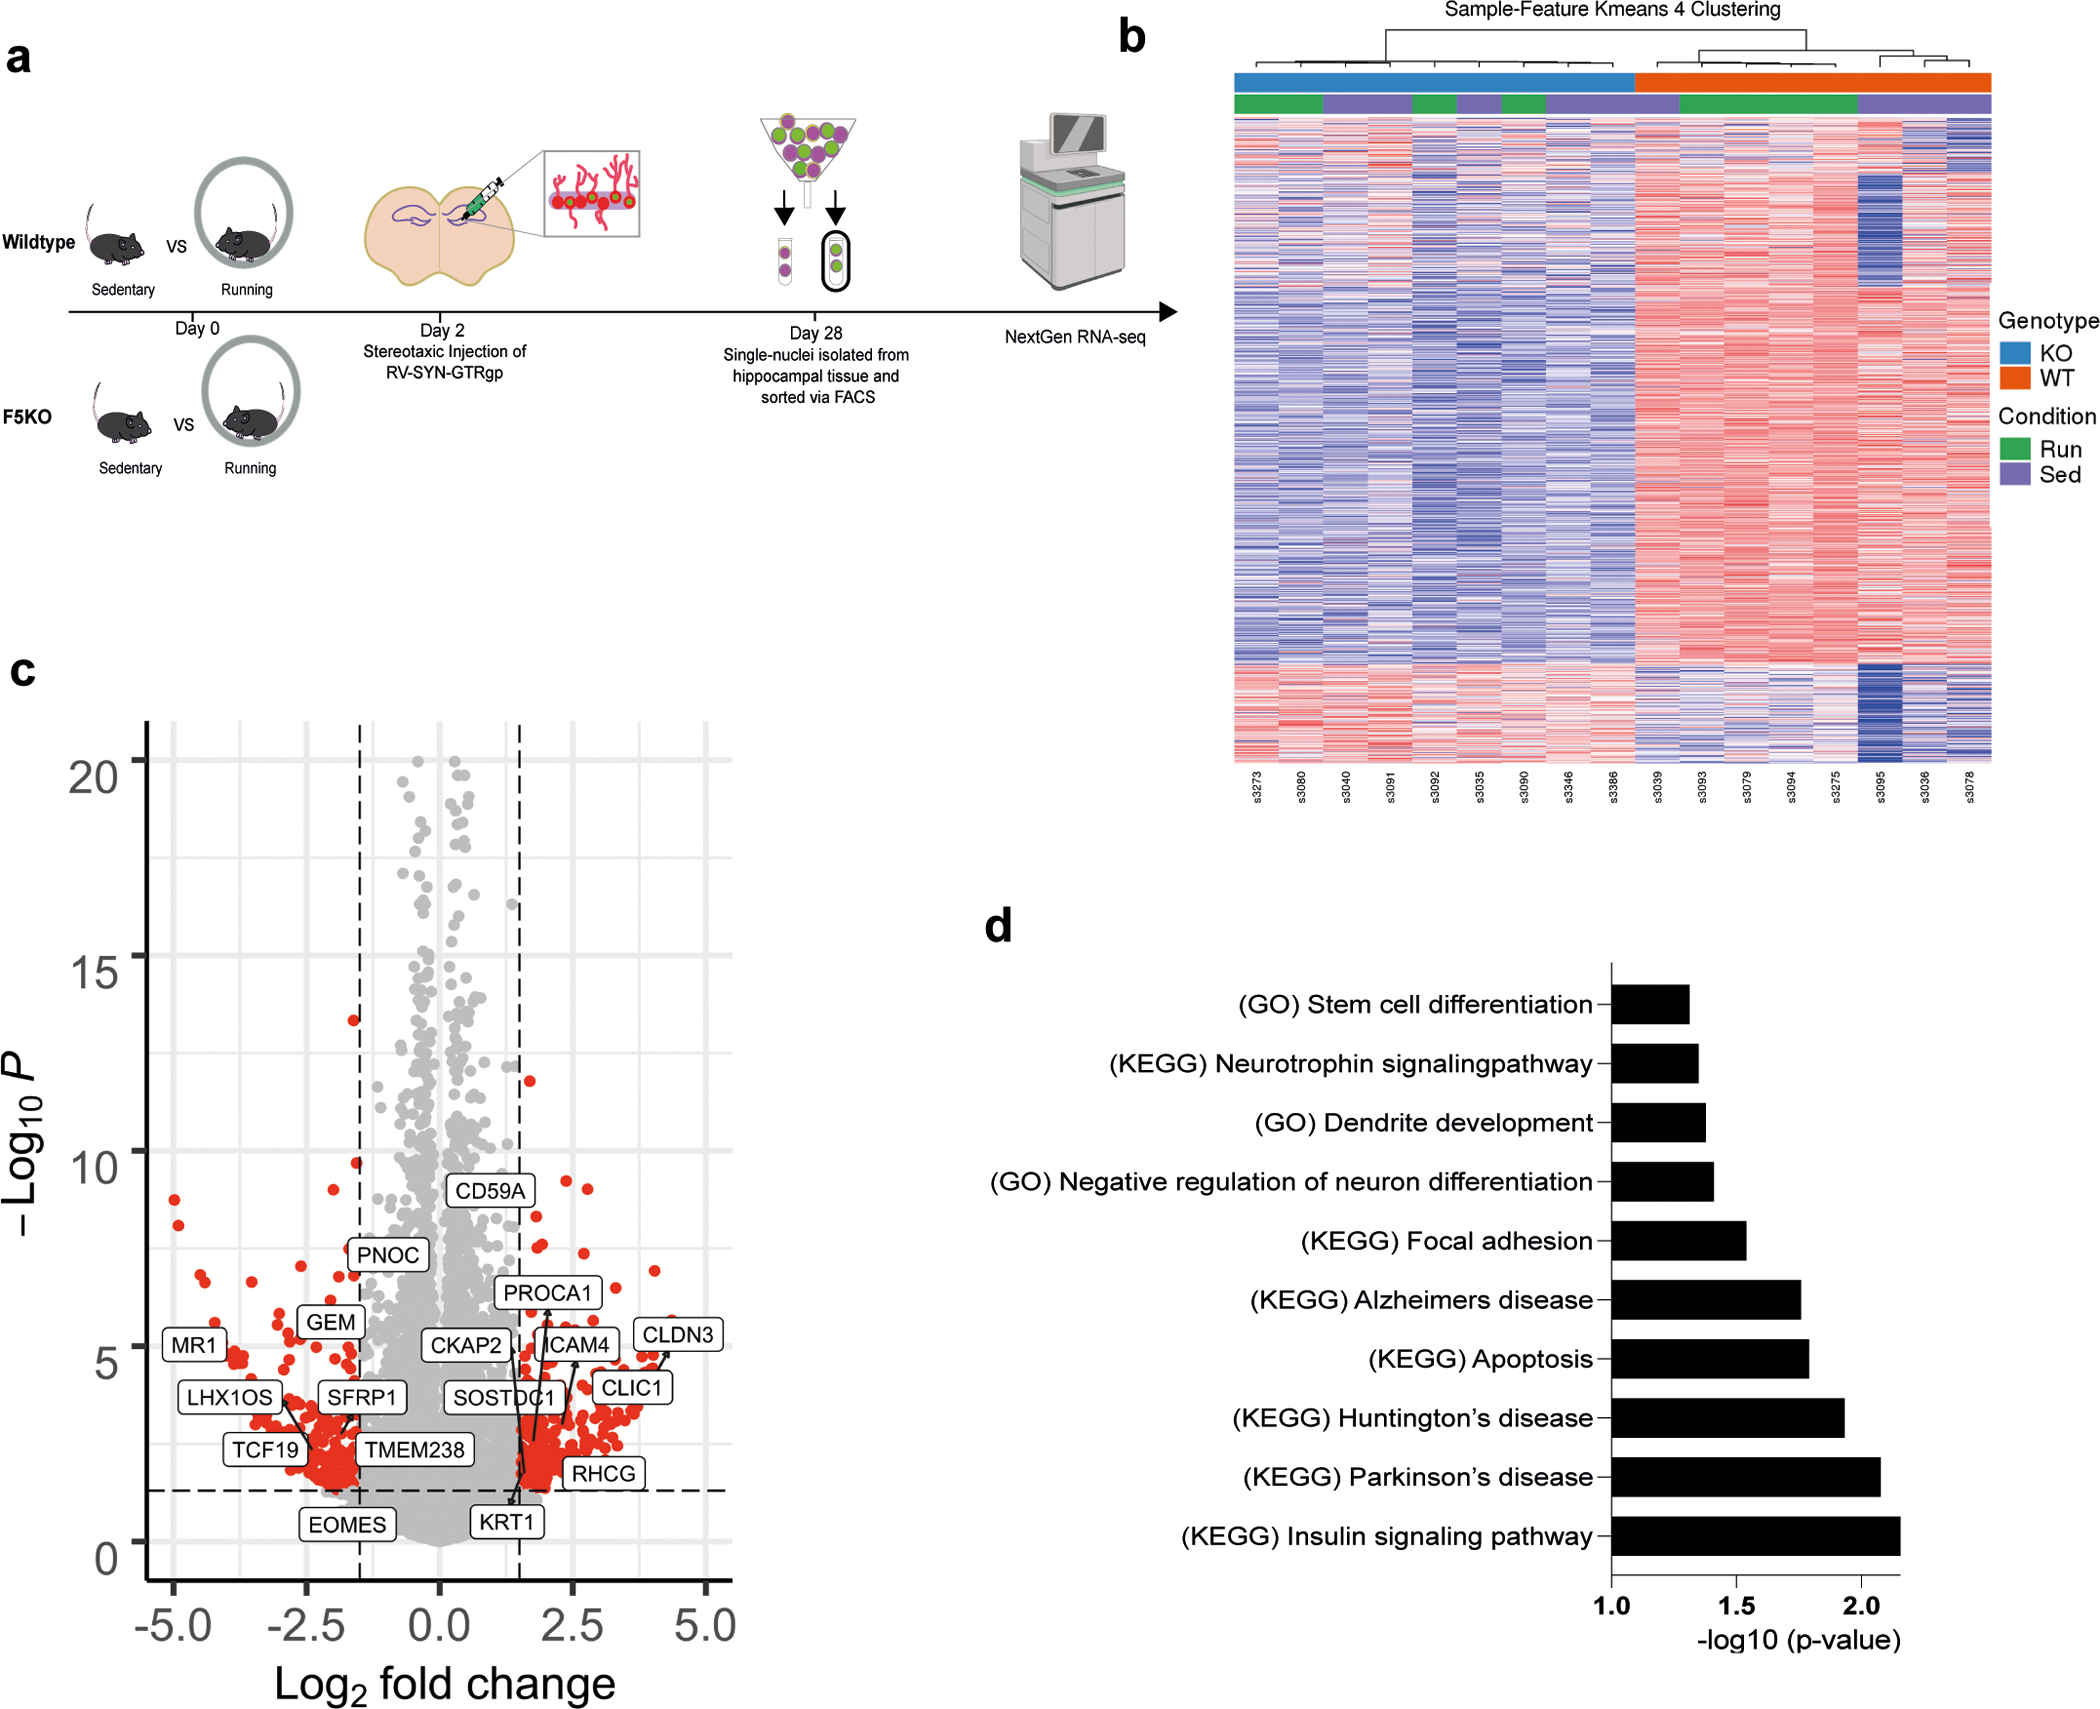
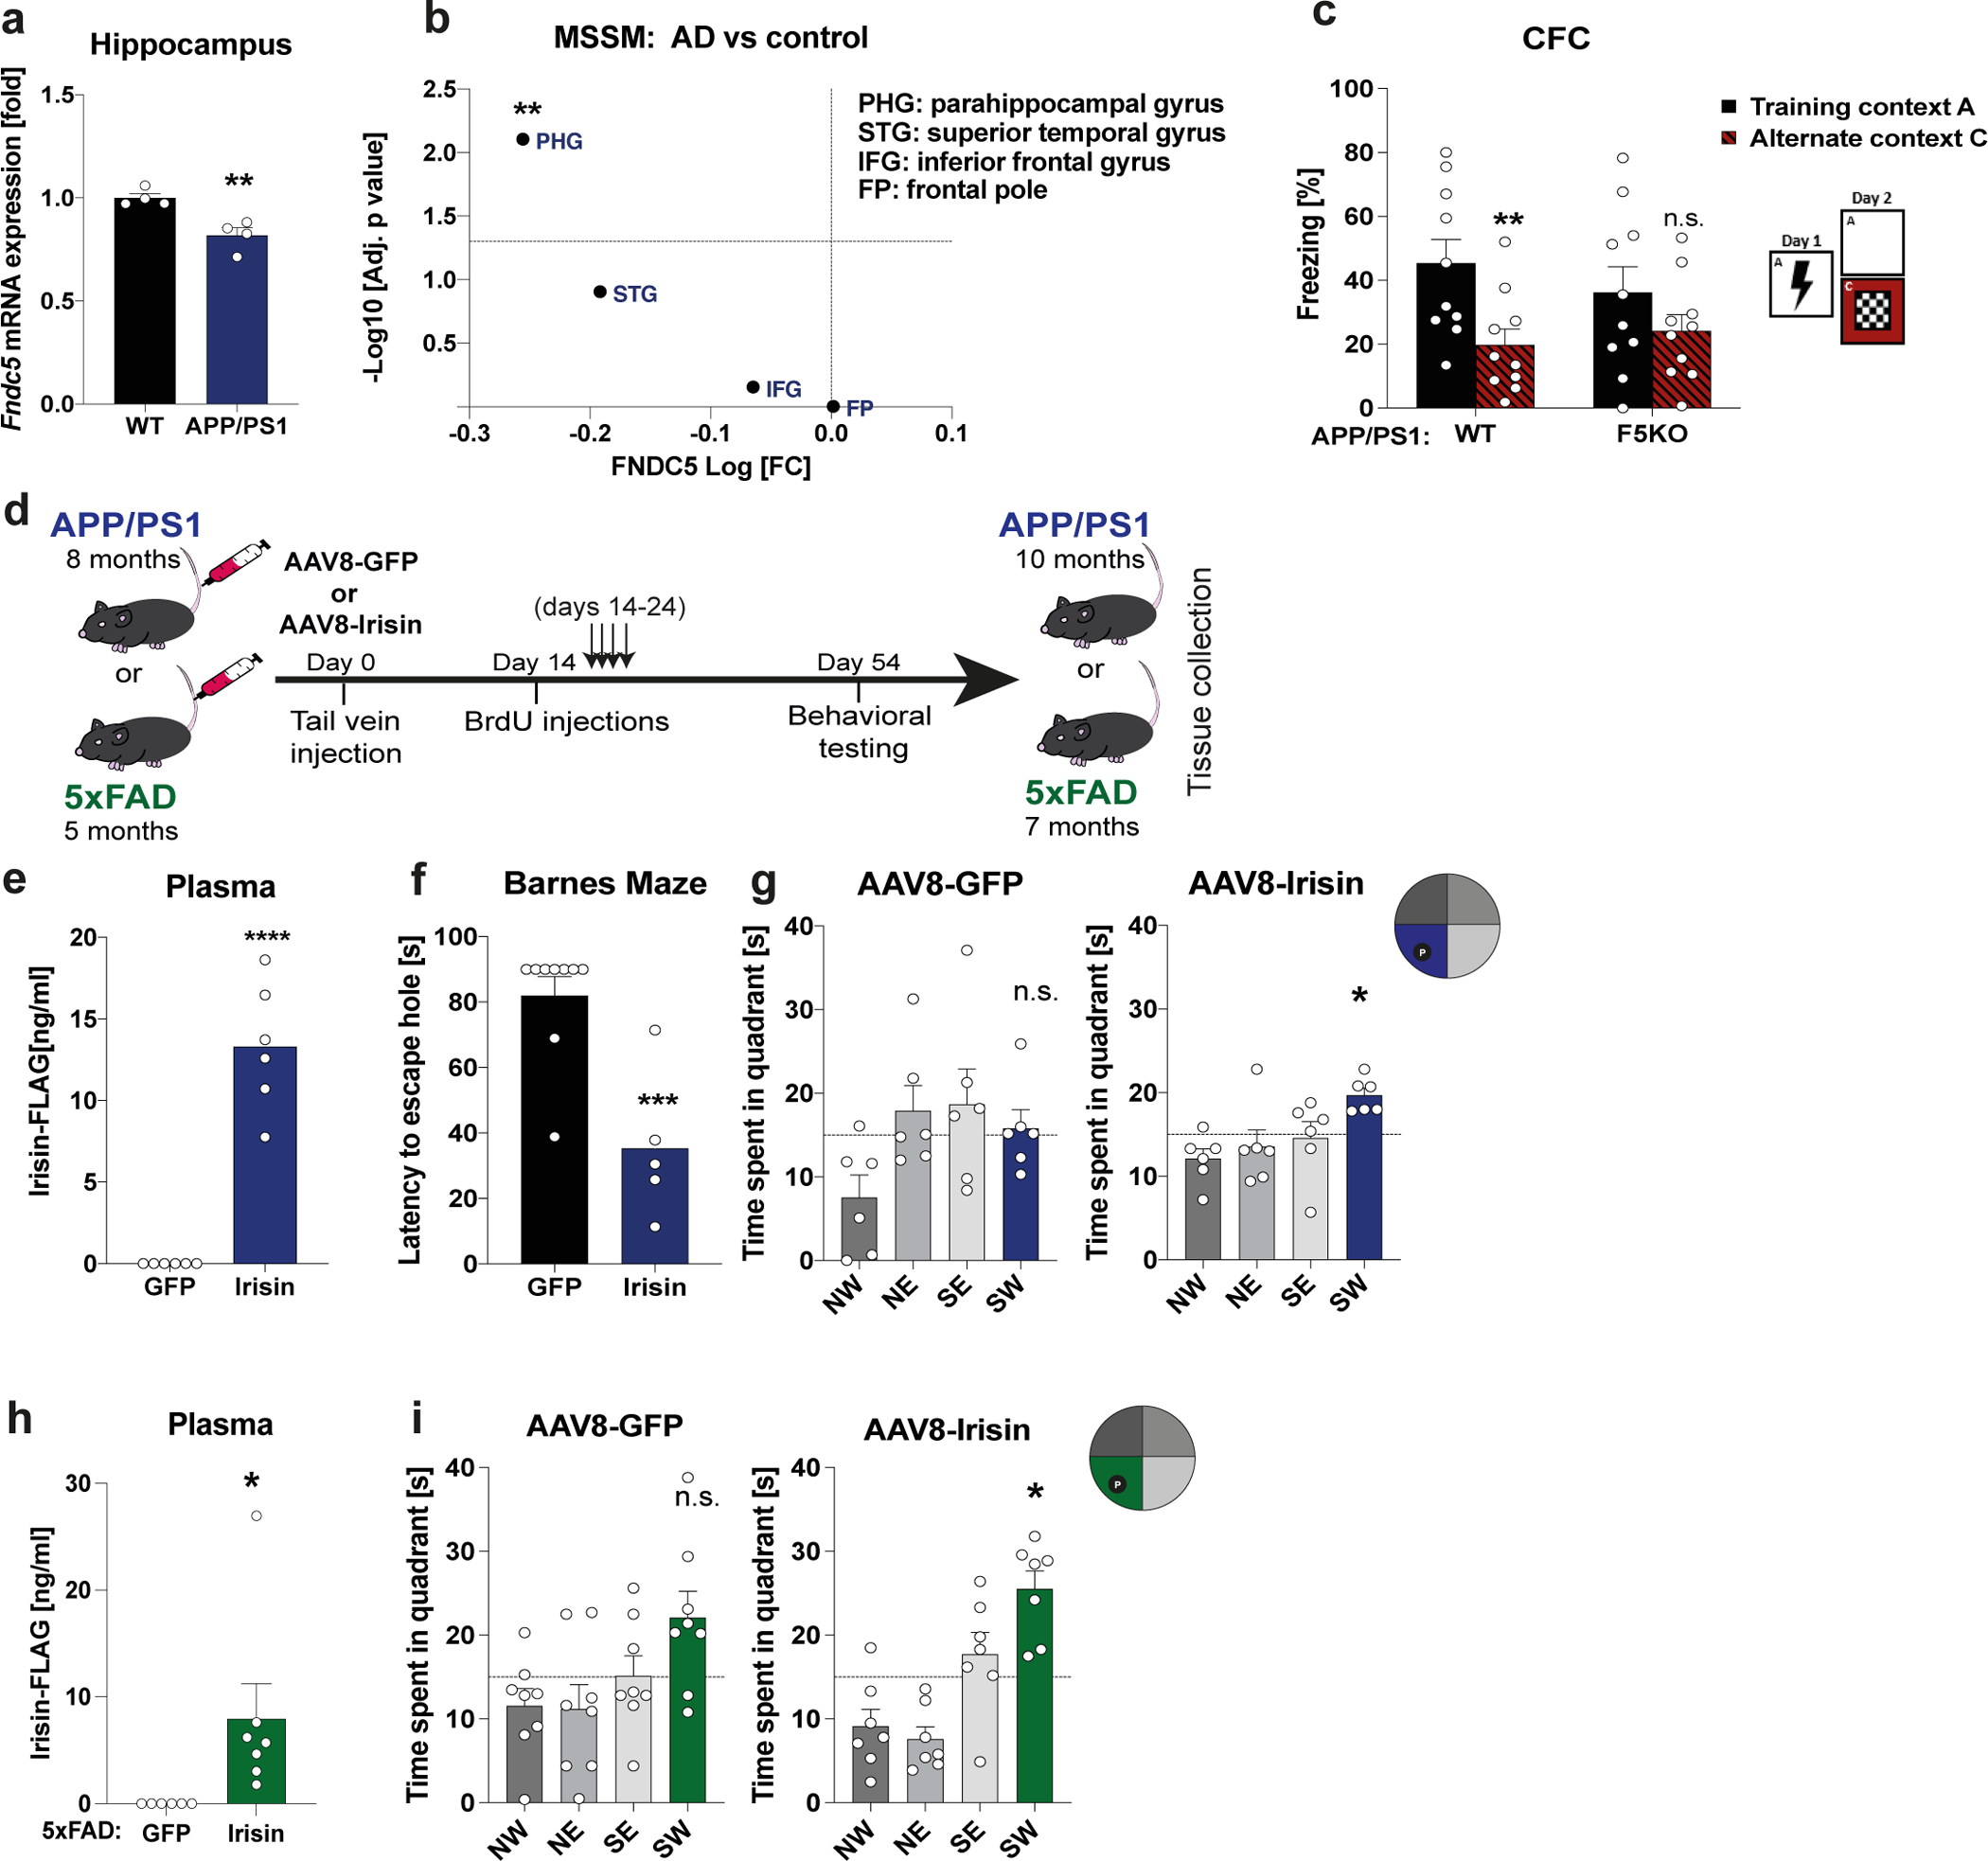
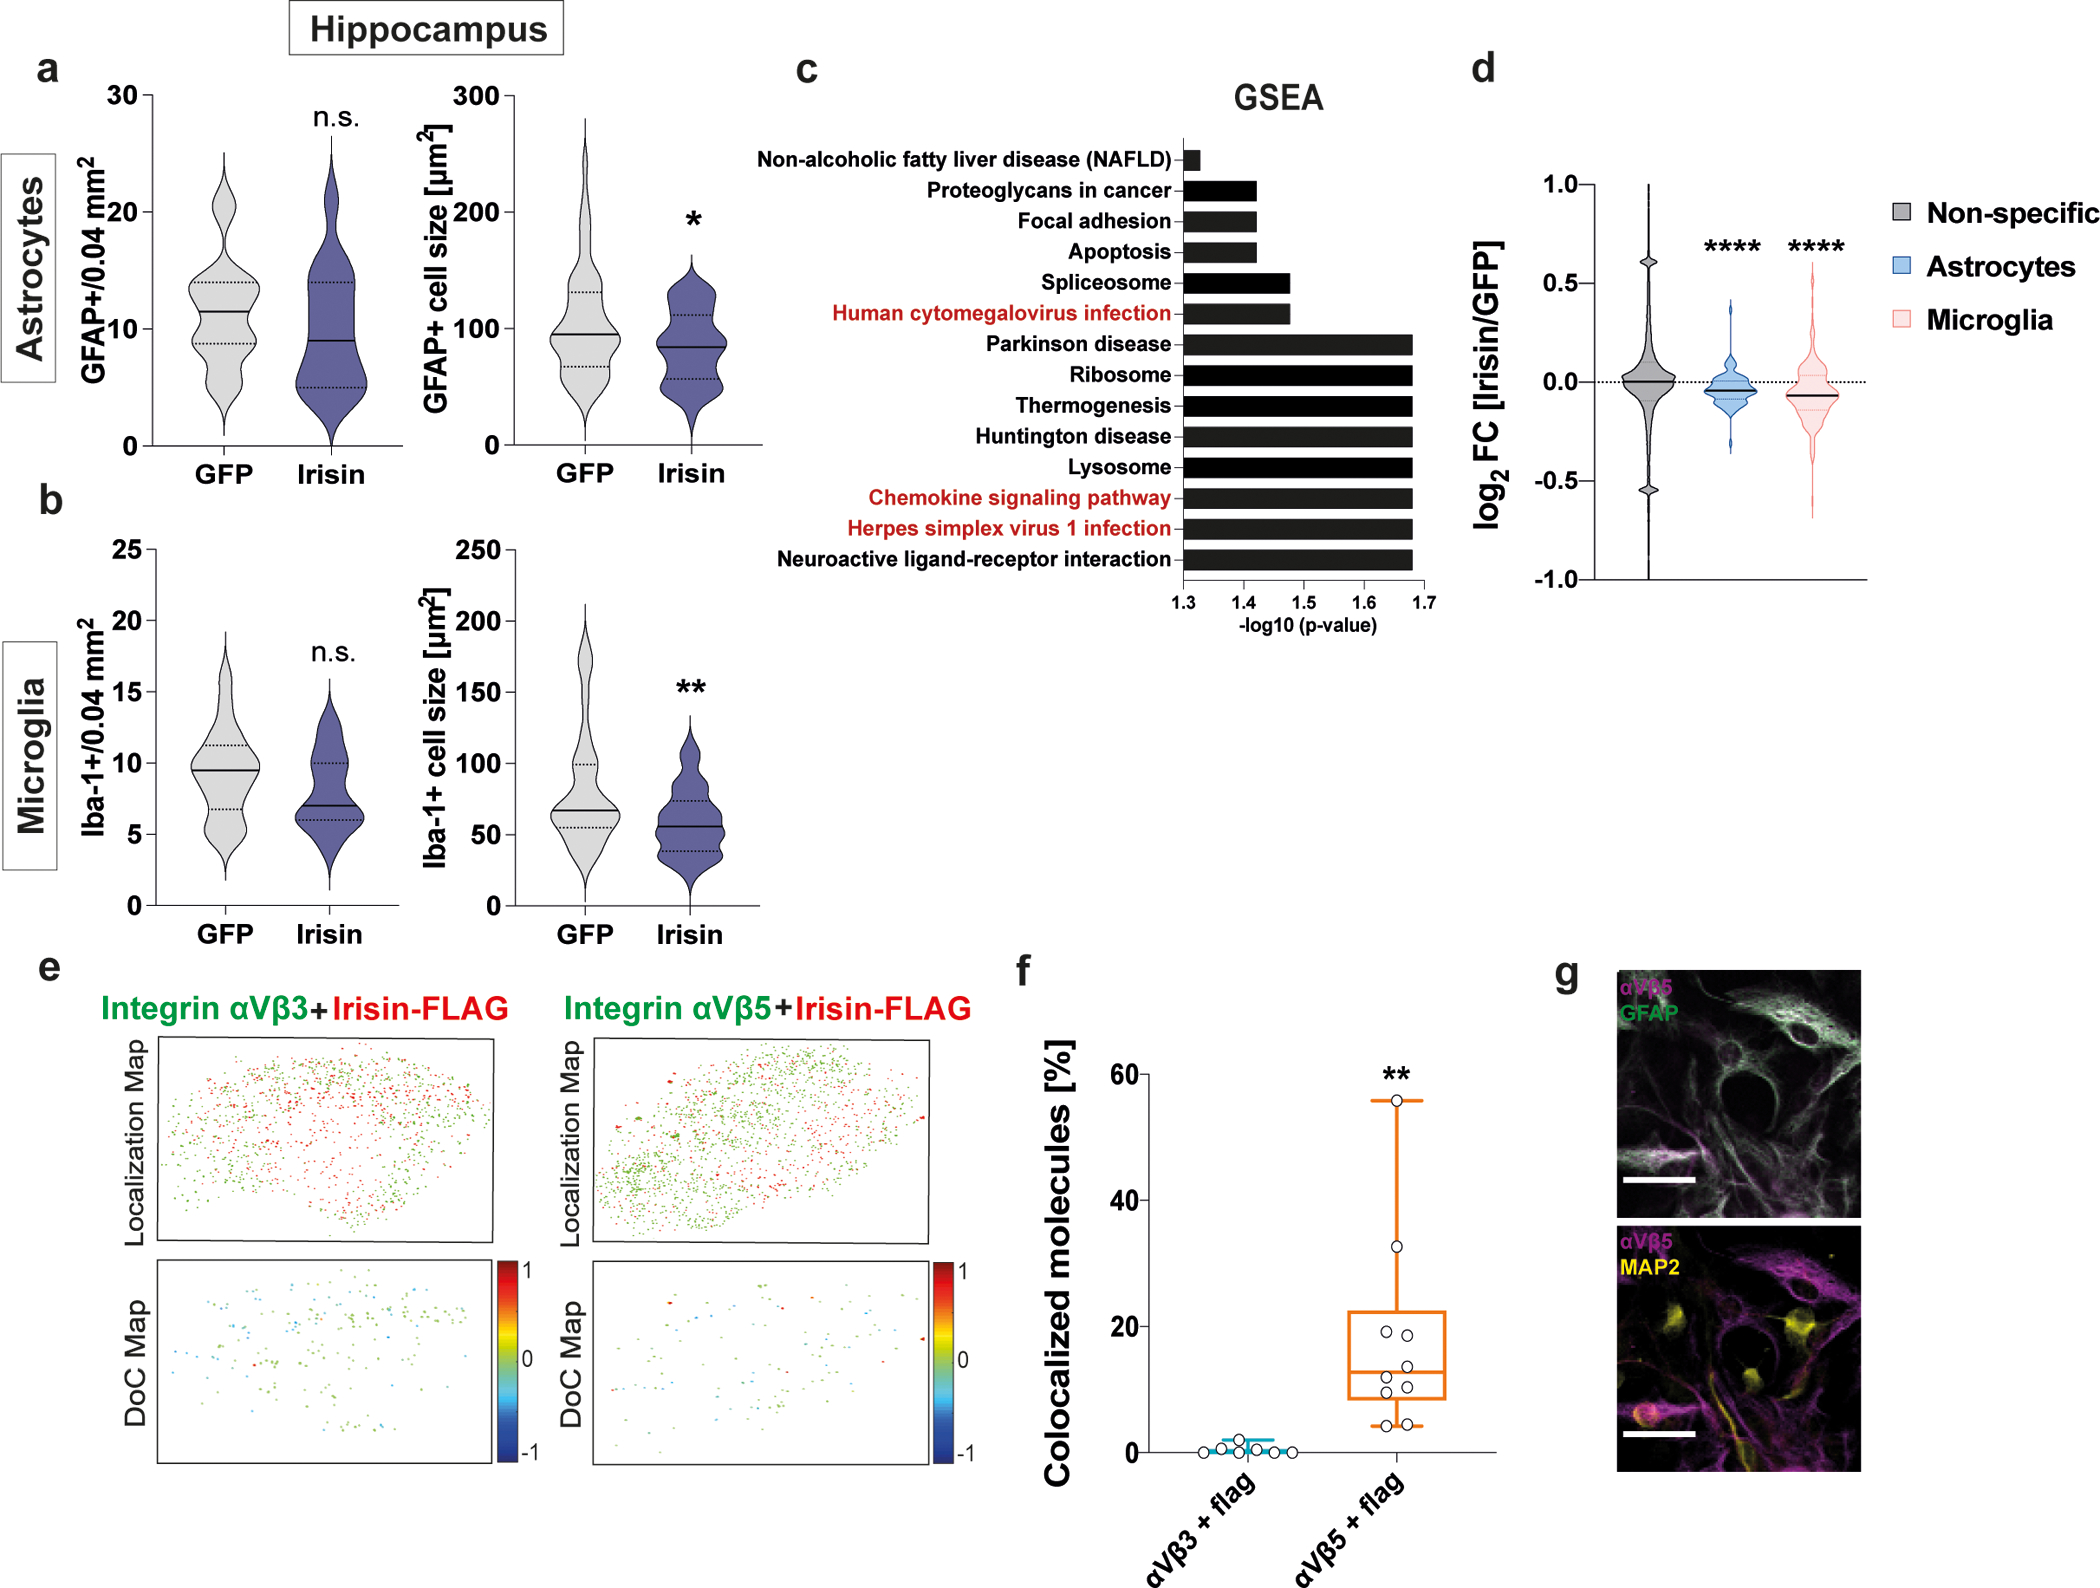
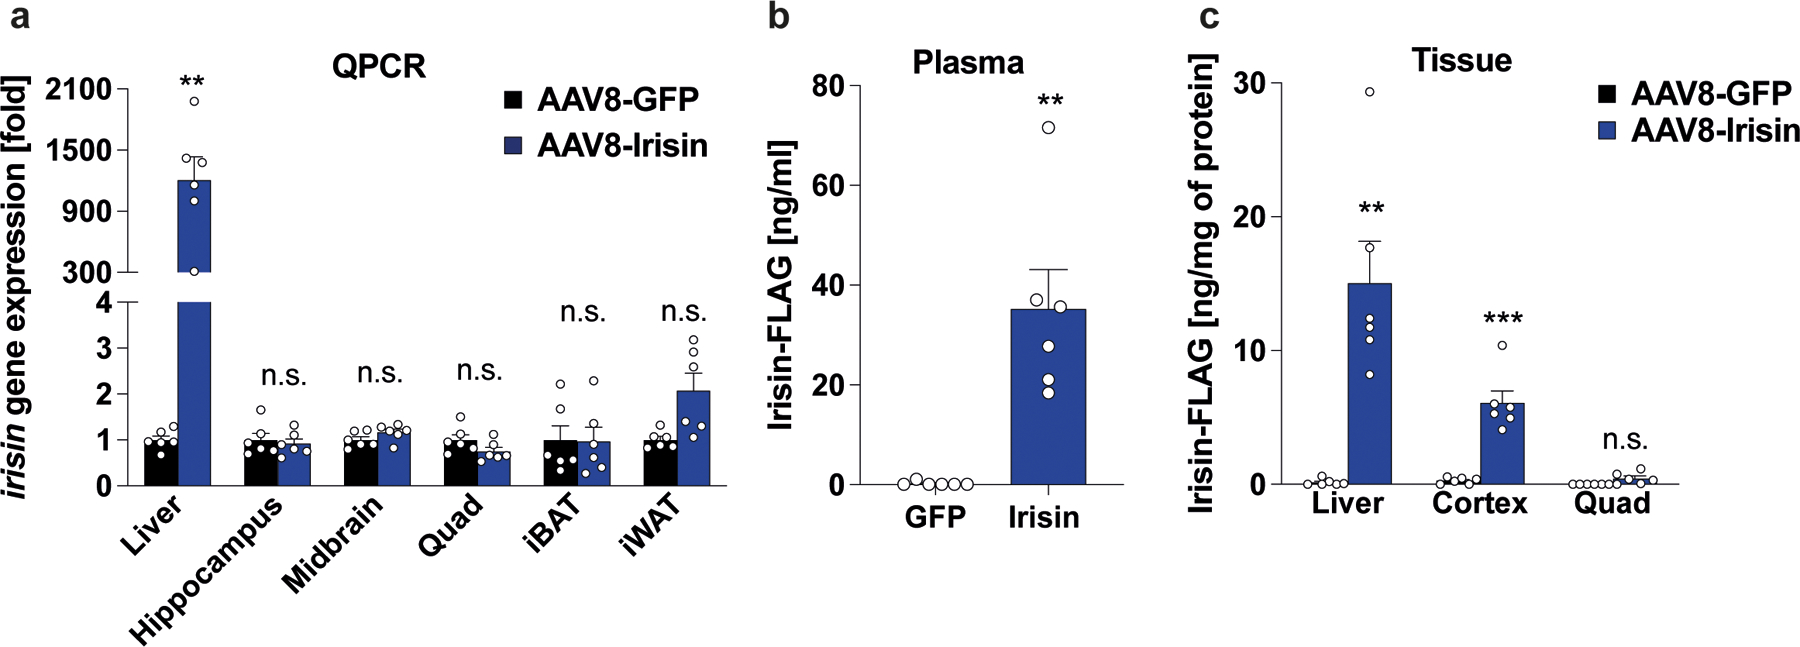
Identifying secreted mediators that drive the cognitive benefits of exercise holds great promise for the treatment of cognitive decline in ageing or Alzheimer's disease (AD). Here, we show that irisin, the cleaved and circulating form of the exercise-induced membrane protein FNDC5, is sufficient to confer the benefits of exercise on cognitive function. Genetic deletion of Fndc5/irisin (global Fndc5 knock-out (KO) mice; F5KO) impairs cognitive function in exercise, ageing and AD. Diminished pattern separation in F5KO mice can be rescued by delivering irisin directly into the dentate gyrus, suggesting that irisin is the active moiety. In F5KO mice, adult-born neurons in the dentate gyrus are morphologically, transcriptionally and functionally abnormal. Importantly, elevation of circulating irisin levels by peripheral delivery of irisin via adeno-associated viral overexpression in the liver results in enrichment of central irisin and is sufficient to improve both the cognitive deficit and neuropathology in AD mouse models. Irisin is a crucial regulator of the cognitive benefits of exercise and is a potential therapeutic agent for treating cognitive disorders including AD.


Conflict of interest statement

COMPETING INTERESTS STATEMENT

The authors declare the following competing interests: B.M.S and C.D.W. hold a patent related to irisin (WO2015051007A1). B.M.S. and C.D.W. are academic co-founders and consultants for Aevum Therapeutics. C.D.W. has a financial interest in Aevum Therapeutics, a company developing drugs which harness the protective molecular mechanisms of exercise to treat neurodegenerative and neuromuscular disorders. Dr. Wrann’s interests were reviewed and are managed by Massachusetts General Hospital and Mass General Brigham in accordance with their conflict of interest policies. The other authors declare no competing interests.

Figures

Extended Data Fig. 1:
Extended Data Fig. 1:. Irisin deletion impairs cognitive function in exercise and aging.
a, Schematic of flox targeting-construct for the Fndc5 locus. b, Bodyweights (WT-sed n = 9; WT-run n = 12; F5KO-sed n = 12; F5KO-run, n = 14). c, qPCR of Fndc5 mRNA expression (n.d.: no detection) (n = 3 per group). d and e, Plasma irisin with commercial ELISA (n = 4 per group) (d) or EIA (n = 2 per group) (e). f, Rotarod, g, Grip strength, h, Gait scan analysis: average propulsion (left) and swing time (right). FR = front right limb, FL = front left, RR = rear right, RL = rear left (WT n = 6, F5KO n = 10), i, Open field test (OPF) (WT-sed n = 5; WT-run n = 6; F5KO-sed n = 6; F5KO-run n = 6), and j, Running activity and k and l, Morris-water-maze (MWM): latency to reach target platform (k) and 24h probe trial in acquisition (l). NE (red bar) was the target quadrant (WT-sed n = 9; WT-run, n = 12; F5KO-sed n = 12; F5KO-run, n = 14). m, Swim speed, 9-months-old mice (WT, n = 10, F5KO, n = 10). n and o, Novel object recognition (NOR) task in young (n) (WT n = 12, F5KO, n =14) and aged mice (o) (WT n = 5, F5KO, n =7). p and q, Bodyweights (p) and Open field test (OPF) (q) for aged mice (WT n = 8, F5KO, n = 7). r, Spontaneous alternation behavior (SAB) in aged mice (WT, n = 7, F5KO, n = 7). s and t, Electrophysiology in DG using acute slices, paired pulse ratio (s) and EPSP input-output curve (t) (WT n = 14, F5KO n = 15 slices, 7 animals per group,). RM-Two-way ANOVA (k, t), Two-way ANOVA (b, h, i), One-way ANOVA. Significance was assigned only if time spent in the target quadrant was significantly different from all other quadrants (l), Two-tailed t-test (d-g, j, m-s). ***p<0.001, ****p<0.0001 n.s.= not significant. Data represented as mean ± SEM of biologically independent samples. See source data for exact p-values.
Extended Data Fig. 2:
Extended Data Fig. 2:. Pattern separation is impaired in F5KO mice and can be rescued by delivering irisin directly into the dentate gyrus.
a, Elevated plus maze. b, Tail suspension test. c and d, Baseline freezing in CFC-DL (c) and in CFC (d) of WT and F5KO mice. e and f, WT and F5KO stereotaxically injected with AAV8-GFP or AAV8-irisin-FLAG into the DG. Representative immunofluorescence images, GFP (green), irisin-FLAG (red), NeuN (magenta) in the hippocampus. Scale bar 200 μm (e) and baseline freezing in the CFC-DL (f) (WT n = 10, F5KO n = 12 (a, b, d); n = 9 per group (c); WT-GFP n = 10, WT-irisin n = 10, F5KO-GFP n = 9, F5KO-irisin n= 10 (f)). RM-Two-way ANOVA (b), One-Way ANOVA (f), Two-tailed t-test (a, c, d). n.s.= not significant. Data are represented as mean ± SEM of biologically independent samples.
Extended Data Fig. 3:
Extended Data Fig. 3:. Adult-born neurons in the hippocampus are altered in global F5KO mice.
a and b, Quantification (a) and representative immunohistochemistry images (b) of BrdU+ adult-borm hippocampal neurons in WT and F5KO mice (n = 6 per group). Scale bar 100 μm. c and d, Quantification (c) and representative immunofluorescence images (d) of EdU+ adult-born hippocampal neurons in WT and F5KO mice with or without running exercise (WT-sed n = 8, WT-run n = 10, F5KO n = 8, F5KO-run n = 13). Scale bar 100 μm. e, Soma size of adult-born hippocampal neurons (WT-sed n= 60, WT-run n = 60, F5KO-sed n = 65, F5KO-run n = 64 neurons). f-h, Dendritic spine analysis of newborn neurons in the ventral hippocampus. Dendritic spines density (f), cumulative distribution of spine head width (g), and median spine head width (h) (WT-sed n = 7, WT-run n = 6, F5KO-sed n = 7, F5KO-run n = 6 (f); WT-sed n = 1239, WT-run n = 1056, F5KO-sed n = 1089, F5KO-run n = 1047 spines (g); WT-sed n = 7, WT-run n = 6, F5KO-sed n = 6, F5KO-run n = 6 (h)). i-l, Dendritic spine analysis in mature granule cells in the dentate gyrus of Thy1-GFP/WT and Thy1-GFP/F5KO. Representative confocal images of dendritic spines stained with anti-GFP (green). Scale bar 5 μm (i), dendritic spines density (j), cumulative distribution of spine head width (k), and median spine head width (l) (n= 5 per group (j, l); WT n = 921, F5KO n = 948 spines (k)). Two-way ANOVA (c, e, f, h), Kruskal-Wallis ANOVA (g), Kolmogorov-Smirnov test (k), Two-tailed t-test (a, j, l). *p<0.05, ****p<0.0001, n.s.= not significant. Data are represented as mean ± SEM of biologically independent samples, except for violin plots with center line = median, dotted line = upper and lower quartile (e). See source data for exact p-values.
Extended Data Fig. 4:
Extended Data Fig. 4:. The transcriptome of adult-born neurons in the hippocampus is altered in global F5KO mice.
a and b, Representative FACS density plots of single nuclei isolated from the hippocampus of a non-injected WT control mouse (a) and a RV-Syn-GTRgp-GFP injected mouse (b). Nuclei were stained with Vybrant DyeCycle stain to label intact nuclei. c, Volcano plot of DESeq2 analysis of bulk RNA-sequencing of microdissected dentate gyrus from F5KO and WT mice (n= 5 per group).
Extended Data Fig. 5:
Extended Data Fig. 5:. Genetic deletion of irisin impairs cognitive function in transgenic mouse models of AD.
a and b, MSD ELISA for Aβ−40 and Aβ−42 peptides in soluble fraction of hippocampus (a) and cortex (b) (APP/PS1-WT n = 2, APP/PS1-F5KO n = 3). c, Body weights at 6 months old. d and e, Open field test (OPF). f, Spontaneous Alternation Behavior (SAB). g, Baseline freezing in CFC. (n =10 per group (c, f, g); n= 7 per group (d, e)). RM-Two-way ANOVA (d, e), Two-way ANOVA (a, b), Two-tailed t-test (c, f, g). **p<0.01, n.s.= not significant. Data are represented as mean ± SEM of biologically independent samples. See source data for exact p-values.
Extended Data Fig. 6:
Extended Data Fig. 6:. Peripheral irisin improves cognitive function in APP/PS1 transgenic mouse models of AD.
APP/PS1 mice were injected with AAV8-GFP or AAV8-irisin-FLAG via the tail vein. a, Liver (GFP n = 14, irisin n = 11) b, Hippocampus Fndc5 mRNA expression (GFP n = 5, irisin n = 5), c, Bodyweights at the beginning and end of the experiment, d and e, OPF test, f, SAB (GFP n = 15, irisin n = 11). g, Barnes Maze, escape latency to hole (GFP n = 9, irisin n = 5), h-j, Morris-water-maze (MWM) latency to reach the target platform (h) and 24h probe trial in in acquisition (i). SW quadrant (blue bar) was the target quadrant. Latency to reach the target platform in reversal (j) (GFP n = 6, irisin n = 6). k and l, Baseline freezing (k) and freezing in CFC (l), m, CFC-DL (n = 6 per group). RM-Two-way ANOVA (c, d, e, g left, h, j, l, m), One-way ANOVA followed by Fisher’s LSD. Significance was assigned only if time spent in the target quadrant was significantly different from all other quadrants (i), Two-tailed t-test (b, f, g right, k), Two-tailed t-test with Welch’s correction (a). *p<0.05, **p<0.01, n.s.= not significant. Data are represented as mean ± SEM of biologically independent samples. See source data for exact p-values.
Extended Data Fig. 7:
Extended Data Fig. 7:. Peripheral irisin improves cognitive function in 5xFAD transgenic mouse models of AD.
5xFAD mice were injected with AAV8-GFP or AAV8-irisin-FLAG via the tail vein. a, Liver b, Hippocampus Fndc5 mRNA expression (n=3 per group). c, Bodyweights at the beginning and end of the experiment, d and e, OPF test, f, SAB. g-j, Morris-water-maze (MWM) latency to reach the target platform in acquisition (g) and 24h probe trial in MWM in acquisition (h). NE quadrant (green bar) was the target quadrant. Latency to reach the target platform in reversal (i) and 24h probe trial in MWM reversal (j). SW quadrant (green bar) was the target quadrant. k and l, CFC, baseline freezing (k) and freezing in CFC (l) (GFP n = 11, irisin n = 10 (c-f, k, l); GFP n = 8, irisin n = 7 (g-j)). RM-Two-way ANOVA (c, d, e, g, i, l), One-way ANOVA followed by Fisher’s LSD. Significance was assigned only if time spent in the target quadrant was significantly different from all other quadrants (h, j), Two-tailed t-test (a, b, f, k). *p<0.05, **p<0.01, ****p<0.0001, n.s.= not significant, data are represented as mean ± SEM of biologically independent samples. See source data for exact p-values.
Extended Data Fig. 8:
Extended Data Fig. 8:. Peripheral irisin reduces glia activation in transgenic mouse models of AD.
APP/PS1 mice were injected with AAV8-GFP or AAV8-irisin-FLAG via the tail vein. a, Expression of synaptic plasticity genes in hippocampus derived from normalized read counts of RNA-seq analysis (GFP n = 5, irisin n = 5), b, MSD ELISA for Abeta40 peptide in cortex soluble fraction, c, MSD ELISA Abeta42 peptide in cortex soluble fraction (GFP n = 9, irisin n = 5). d and e, Representative immunofluorescence confocal images of hippocampus, GFAP (green), Iba-1 (red), 3D6 (Alexa 647). Scale bar 200 μm (d) and quantification of plaque burden in hippocampus (e) (GFP n = 7, irisin n =5). f, Quantification of plaque burden cortex (GFP n = 5, irisin n = 3). g, Quantification of total BrdU+ cells (GFP n = 7, irisin n = 5). Two-way ANOVA (a), Two-tailed t-test (b, c, e-g). n.s.= not significant, data are represented as mean ± SEM of biologically independent samples.
Extended Data Fig. 9:
Extended Data Fig. 9:. Irisin binds αV/β5 integrin receptor on astrocytes in adult hippocampal neural stem cells cultures.
a, Two-color dSTORM images of integrin αV/β3 (left) and αV/β5 (right) (green) and irisin-FLAG (red) molecules. Scale bar 5 μm (irisin-FLAG-αV/β3 n = 7, irisin-FLAG-αV/β5 n = 10), b and c, Itgav gene expression (b) and Itgb5 gene expression (c) in the murine dentate gyrus from Linnarsson lab database (https://linnarssonlab.org/dentate/). d, QPCR analysis of mRNA expression of Map2, Dcx, Gfap, and Aif1 in the dentate gyrus (n = 6) and neurons differentiated from adult hippocampal stem cells (n = 8 from two independent experiments). Ct: cycle threshold value. Data are represented as mean ± SEM of biologically independent samples.
Extended Data Fig. 10:
Extended Data Fig. 10:. Peripherally delivered irisin has central effects.
a-e, WT mice injected with AAV8-GFP or AAV8-irisin-FLAG via the tail vein. Western blot of plasma from AAV8-GFP (1–2) and AAV8-irisin-FLAG (3–4) with or without deglycosylation (a), qPCR analysis of liver (b), quadriceps (c), inguinal white adipose tissue (iWAT) (d), interscapular brown adipose tissue (iBAT) (e). Two-way ANOVA (b-d). Data are represented as mean ± SEM of biologically independent samples (n = 6 per group) (b-e).
Fig. 1.
Fig. 1.. Genetic deletion of irisin impairs cognitive function in exercise and aging.
a, Schematic representation of FNDC5 and irisin. SP= signal peptide, H= hydrophobic domain, C=c-terminal domain a.a.= amino acid. b and c, Morris-water-maze (MWM) latency to reach the target platform in reversal (b) (WT-sed n = 9, WT-run n = 12, F5KO-sed n = 12, F5KO-run n = 14) and 24h probe trial in MWM in reversal (c). SW quadrant (red bar) was the target quadrant (WT-sed n = 9, WT-run n = 12, F5KO-sed n = 11, F5KO-run n = 14). d and e, Novel object recognition (NOR) task in young (d) (WT n = 12, F5KO n = 14) and aged mice (e) (WT n = 5, F5KO n = 7). f-i, Electrophysiology of WT and F5KO using acute hippocampal slices. Schematic showing electrode position to evoke field EPSPs in the dentate gyrus (f), EPSP recordings for LTP measurement (55–60 min after application of a conditioning stimulus, two-tailed t-test on the average from last five minutes) (g), representative traces indicating the average LTP elicited (h), and EPSP slope change in different subregions of hippocampus in the PTP (first minute after conditioning stimulus) and LTP phase (55–60 min after induction) (i) (WT n = 17, F5KO n = 20 slices (g); WT-Total n = 17, WT-dorsal n = 8, WT-ventral n = 9, F5KO-Total n = 20, F5KO-dorsal n = 7, F5KO-ventral n = 13 slices (i), from 7 animals per group). RM-Two-way ANOVA (b), Two-way ANOVA (d, e, i). One-way ANOVA followed by Fisher’s LSD. Significance was assigned only if time spent in the target quadrant was significantly different from all other quadrants (c), Two-tailed t-test (g). *p<0.05, **p<0.01, ***p<0.001, ****p<0.0001. n.s.= not significant. Data represented as mean ± SEM of biologically independent samples. See source data for exact p-values.
Fig. 2.
Fig. 2.. Pattern separation is impaired in F5KO mice and can be rescued by delivering irisin directly into the dentate gyrus.
a, Contextual fear conditioning discrimination learning paradigm (CFC-DL) for WT and F5KO mice (n = 9 per group). b, Contextual fear conditioning (CFC) for WT and F5KO mice (WT n = 10, F5KO n = 12), c-e, WT and F5KO were stereotaxically injected with AAV8-GFP or AAV8-irisin-FLAG into the dentate gyrus. Schematic of experimental layout (c), CFC-DL of AAV8-GFP or AAV8-irisin injected WT (d) and F5KO mice (e) (WT-GFP n = 10, WT-irisin n = 10, F5KO-GFP n = 9, F5KO-irisin n = 10). RM-Two-way ANOVA (a, b, d, e). **p<0.01, ***p<0.001, ****p<0.0001. n.s.= not significant. Data represented as mean ± SEM of biologically independent samples. See source data for exact p-values.
Fig. 3.
Fig. 3.. Adult-born neurons, but not mature granule cells, in the hippocampus display aberrant activation in global F5KO mice.
a-c, Representative confocal images of the dentate gyrus stained with anti-BrdU (green), c-Fos (red), and Neun (magenta), white arrowhead indicates triple-positive cell. Scale bar 5 μm (a) and quantification of BrdU-, c-Fos+, NeuN+ mature granule cells (b) and BrdU+, c-Fos+, NeuN+ adult-born neurons (c) in the dentate gyrus from WT and F5KO mice. d, Running activity/day. e, Total running ninety minutes before sacrificing the mouse. f, Total number of BrdU+/NeuN+ cells (n = 7 per group). Two-tailed t-test (b-f). **p<0.01, n.s.= not significant. Data represented as mean ± SEM of biologically independent samples. See source data for exact p-values.
Fig. 4.
Fig. 4.. Adult-born neurons in the hippocampus develop abnormally in global F5KO mice.
a, Schematic of CAG-GFP retrovirus injection to label newborn neurons in the hippocampus. b-f, Morphological analysis of dendrites of newborn neurons. Representative confocal images of newborn neurons stained with anti-GFP (green) and DAPI (white). Scale bar 100 μm (b), Sholl analysis of dendritic complexity (c), and total dendritic length of newborn neurons in the dorsal hippocampus (d), and Sholl analysis of dendritic complexity (e) and total dendritic length of newborn neurons in the ventral hippocampus (f) (n=30 neurons per group). g-j, Dendritic spine analysis in dorsal newborn neurons. Representative confocal images of dendritic spines stained with anti-GFP (green). Scale bar 5 μm (g), dendritic spines density (h), cumulative distribution of spine head width (i), and median spine head width (j) (WT-sed, n = 6, WT-run, n = 5, F5KO-sed, n = 6, F5KO-run, n = 7 (h, j)); (WT-sed, n = 966, WT-run, n = 817, F5KO-sed, n = 1018, F5KO-run, n = 1180 spines, (i)). RM-Two-way ANOVA (c, e). Two-way ANOVA (d, f, h, j), Kruskal-Wallis ANOVA test (i). *p<0.05, **p<0.01, ***p<0.001, ****p<0.0001, n.s.= not significant. Data represented as mean ± SEM of biologically independent samples, except for violin plots with center line=median, dotted line= upper and lower quartile (d, f). See source data for exact p-values.
Fig. 5.
Fig. 5.. The transcriptome of adult-born neurons in the hippocampus is altered in global F5KO mice.
a, Schematic of selective labeling and FACS sorting of single nuclei of newborn neurons for transcriptomic analysis by RNA-seq. b, Heatmap of Sample-Feature K-means 4 Clustering (blue: F5KO, red: WT, green: Run, purple: Sed). c, Volcano plot of DESeq2 analysis and d, GSEA analysis for dysregulated pathways in newborn neurons in F5KO (WT-sed n = 4, WT-run n = 4, F5KO-run n=4, F5KO-sed n = 5). See source data for exact p-values.
Fig. 6.
Fig. 6.. Peripheral irisin improves cognitive function in transgenic mouse models of AD.
a, Hippocampal Fndc5 mRNA expression in WT and APP/PS1 AD mice (n = 4 per group). b, FNDC5 mRNA expression from RNA-sequencing data from the MSSM study (Mount Sinai School of Medicine, and Mayo), comprising 2,114 samples from 1,234 subjects. c, Contextual fear conditioning (CFC) in APP/PS1-WT (n = 10) and APP/PS1-F5KO mice (n = 10). d, Schematic of experimental outline for irisin-treatment of transgenic AD models. e-g, APP/PS1 mice were injected with AAV8-GFP or AAV8-irisin-FLAG via the tail vein. Irisin-FLAG level in the plasma by ELISA (e) (n = 6 per group), escape latency in the probe trial in the Barnes maze (f) (GFP n = 9, irisin n = 5), and 4h probe trial in the MWM reversal. SW quadrant (blue bar) was the target quadrant (n = 6 per group) (g). h and i, 5xFAD mice were injected with AAV8-GFP or AAV8-irisin-FLAG via the tail vein. Irisin-FLAG levels in the plasma by ELISA (GFP n = 6, irisin n = 7) (h), and 4h probe trial in MWM reversal. SW quadrant (green bar) was the target quadrant (GFP n = 8, irisin n = 7) (i). RM-Two-way ANOVA (c), One-way ANOVA followed by Fisher’s LSD. Significance was assigned only if time spent in the target quadrant was significantly different from all other quadrants (g, i), Two-tailed t-test (a, b, e, f, h). *p<0.05, **p<0.01, ***p<0.001, ****p<0.0001; n.s.= not significant. Data presented as mean ± SEM of biologically independent samples. See source data for exact p-values.
Fig. 7.
Fig. 7.. Peripheral irisin reduces glia activation in transgenic mouse models of AD.
a-d, APP/PS1 mice were injected with AAV8-GFP or AAV8-irisin-FLAG via the tail vein. a and b, Quantification of number (left panel) and cell size (right panel) of GFAP+ astrocytes (a) (GFP n=18, irisin n=15) (left); (GFP n=52, irisin n=42 (right) and Iba1+ microglia (b) (GFP n=18, irisin n=15) (left); (GFP n=52, irisin n=43) (right). c and d, Bulk RNA-seq analysis of hippocampal samples, GSEA analysis for regulated pathways (red for inflammatory pathways) (c) and overrepresentation analysis of glia genes (d) (GFP n = 5, irisin n = 5). e, f, Two-color STORM experiment on differentiated adult hippocampal primary neuronal stem cell cultures incubated with recombinant irisin-FLAG. Clus-DoC localization map (top) for irisin-FLAG (red) and integrin αV/β3(left) or integrin αV/β5 (right) (both in green) and Clus-Doc Degree of colocalization (DoC) (bottom) for irisin-FLAG relative to integrin αV/β3 (left) or integrin αV/β5 (right). Co-localizations are color coded according to their DoC scores (score bar at the right of the bottom panels) (e) and quantification of colocalized molecules (Irisin-FLAG-αV/β3 n = 7, irisin-FLAG-αV/β5 n = 10) (f). g, Representative confocal images of co-localization of αV/β5 integrins (magenta) with GFAP+ astrocytes (green) (top) and MAP2+ neurons (yellow) (bottom). N = 3 per group. Scale bar 20 μm. Two-tailed t-test (a, b), two-tailed t-test with Welch’s correction (d, f). *p<0.05, **p<0.01, ****p<0.0001; n.s.= not significant. Data are represented as mean ± SEM of biologically independent samples, except for violin plots with center line = median, dotted line = upper and lower quartile (d) and box plots: center line = median, bound of box = 25th to 75th percentiles, whiskers = max to min (f). See source data for exact p-values.
Fig. 8.
Fig. 8.. Peripherally delivered irisin crosses the blood brain barrier.
WT mice were injected with AAV8-GFP or AAV8-irisin-FLAG via the tail vein. Tissues were collected three weeks later. a, qPCR analysis. b, Irisin-FLAG levels in plasma and c, tissue lysates by ELISA (n = 6 per group). Multiple t-tests with Bonferroni-Dunn method correction for adjusted p-value (a, c), Two-tailed t-test (b). **p<0.01, ****p <0.0001, n.s.= not significant. Data are represented as mean ± SEM of biologically independent samples. See source data for exact p-values.

References

    1. Maass A et al. Vascular hippocampal plasticity after aerobic exercise in older adults. Mol Psychiatry 20, 585–593, doi:10.1038/mp.2014.114 (2015). - DOI - PubMed
    1. Colcombe S & Kramer AF Fitness effects on the cognitive function of older adults: a meta-analytic study. Psychol Sci 14, 125–130 (2003). - PubMed
    1. Voss MW et al. Exercise and Hippocampal Memory Systems. Trends Cogn Sci 23, 318–333, doi:10.1016/j.tics.2019.01.006 (2019). - DOI - PMC - PubMed
    1. Buchman AS et al. Total daily physical activity and the risk of AD and cognitive decline in older adults. Neurology 78, 1323–1329, doi:10.1212/WNL.0b013e3182535d35 (2012). - DOI - PMC - PubMed
    1. van Praag H, Christie BR, Sejnowski TJ & Gage FH Running enhances neurogenesis, learning, and long-term potentiation in mice. Proceedings of the National Academy of Sciences of the United States of America 96, 13427–13431 (1999). - PMC - PubMed

Publication types